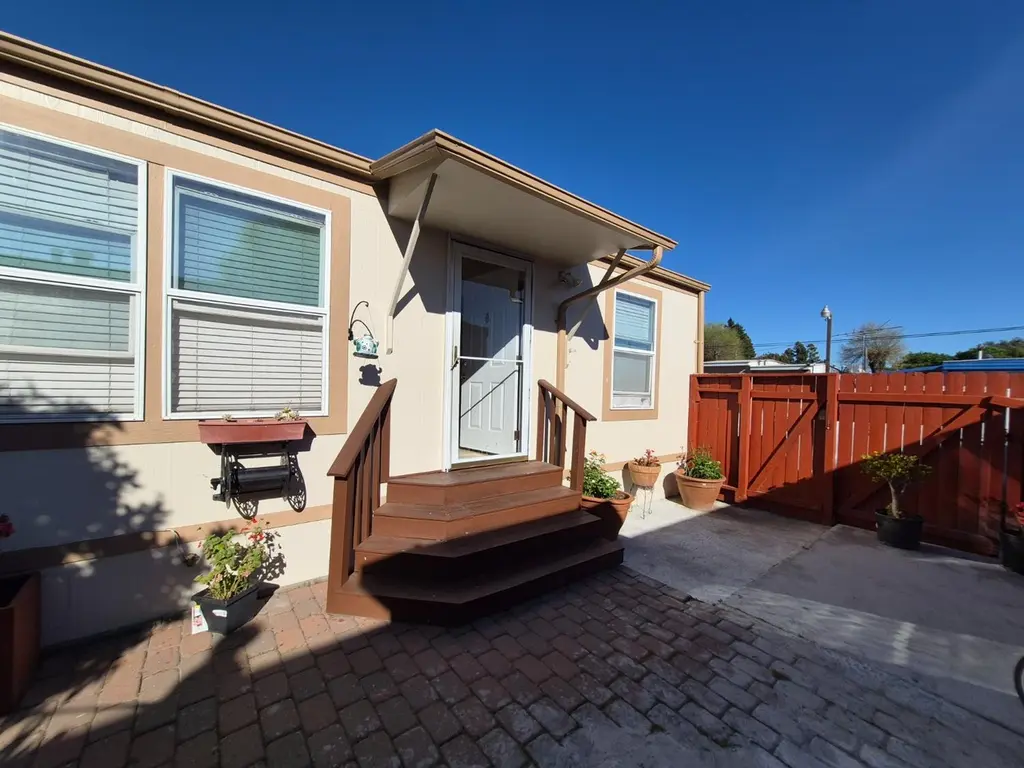
2399 E 14th St #60 · San Leandro, CA
Flood risk 1/10 · Minimal
- FEMA flood zone
- X (unshaded)
- Chance of flooding over 30 yrs
- 0.0%
- Est. flood insurance / yr
- $507 – $1,088
Fire risk 4/10 · Minor
- Est. fire insurance / yr
- $659 – $1,223
Heat risk 4/10 · Minor
- Hot days now (above 84°F)
- 7 days/yr
- Hot days in 30 yrs
- 15 days/yr
Wind risk 1/10 · Minimal
- Chance of severe wind over 30 yrs
- —
Air-quality risk 7/10 · Major
- Unhealthy air days now
- 12 days/yr
- Unhealthy air days in 30 yrs
- 12 days/yr
Risk factors via First Street. Map © Google.
Why this score? — see what drove the B- grade
The composite is a weighted blend of 9 inputs, each scored 0–100. Each bar is that input's sub-score; the figure is the points it added to the 100-point composite (weight × sub-score).
- Cash flow +30.0/30.0
- 1% rule +10.0/10.0
- DSCR +10.0/10.0
- ARV discount +5.9/15.0
- Schools +3.4/10.0
- Livability +3.4/5.0
- Rent growth +2.9/5.0
- Condition / age +2.5/5.0
- Appreciation +0.0/10.0
$159,900
🖨 Deal sheet 📄 Offer letter ✓ Due diligence
Listing remarks
This immaculant 3 bed 2 bath mobile home is a must see, in an ALL AGE PARK. It is a lot of bang for the buck! It offer's an open floor and the abundance of natural light. Out side it has a fenced front yard and private parking if desired.
Key facts
- Private parking
- Fenced front yard
- Built 2001
Tags
Neighborhood map
What this means for you Summary
Snapshot
- This is a 3-bed/2.0-bath manufactured listed at $160k.
Deal economics
- At list price, monthly cash flow is $1k ($15k/yr) — positive.
- The deal already cash-flows at list — no discount required.
- Meets the 1% rule at list price ($3k rent vs $160k).
- Cap rate 15.5% vs local median 2.0% in San Leandro — top-decile yield for the area; either an underpriced asset or a hidden risk that comps aren't pricing in. Stress-test before assuming the spread holds.
Location & tenants
- Location reads 68/100 on livability (#289 in CA) — a middle-class / working-renter tenant base. Strengths: commute A+, employment A+, health & safety A+; Watch: amenities C-, schools D, crime F.
- San Leandro Unified (urban): math 28% / reading 42% proficiency, ranked #831 of 1,400 in CA (top 59%) — families likely to look elsewhere, expect single-tenant / working-renter base with shorter leases.
- Market conditions: Rents rising (+1.7%/yr); 106 active listings in the ZIP; 36 comparable units currently listed for rent nearby; rentals at typical pace (median 15d on market — plan ~3-4 weeks tenant-placement turnaround); solid renter incomes; 1,742 units permitted in Alameda County in 2024 (856 in 5+ unit buildings).
- This rent runs 30% of the median local income ($109k/yr) — at the standard rent-burdened threshold; future hikes will face affordability resistance.
Forward outlook
- Local home prices are declining (-3.0%/yr); year-one equity from $1k of loan paydown is wiped out by about $5k of value loss. Plan a longer hold.
- Alameda County population projected at +34% by 2050 — long-run rental-demand tailwind backs the buy-and-hold thesis.
- At projected returns (-3.0% appreciation + 1.7% rent growth), your $45k cash investment doubles in ~4 years — after that, you're playing with house money.
Negotiation context
- Only 9 days on market — expect competitive offers; lowballing is unlikely to land.
Questions for the listing agent
- Is there a deadline driving the sale (1031 exchange, divorce, estate, relocation)? That informs how much negotiation room exists.
- Schools are D-rated, which usually means shorter tenancies and higher turnover. Who's the typical renter profile here, and what's been the actual vacancy rate?
- Crime grade is F in this area — have there been break-ins, vandalism, or insurance claims at this property in the last 3 years? What carrier currently insures it and at what premium?
- What's the average days-on-market for RENTAL listings here right now (not sales)? A rising rental-DOM trend means longer vacancies and softer asking-rent achievability than the comps imply.
- What's the recent tenant-quality profile in this submarket — average credit score on applications, eviction rate, late-payment / NSF rate, and stable-employment percentage? A property-management company in the area should have these aggregated.
- How much new for-sale + rental construction is in the pipeline within 1–3 miles? Heavy new supply typically softens prices + rents 12–24 months out; constrained supply supports both.
Investment metrics
- 1% rule
- 1.71% ✓
- Cap rate
- 15.46%
- Cash-on-cash
- 32.73%
- DSCR
- 2.46
- GRM
- 4.9
CMA / ARV
- ARV (on-the-fly)
- $154,560
- Comps found
- 2
Show comp detail 2 sales within ~0.75 mi
| Address | Dist | Beds/Ba | Sqft | Sold | Price | $/sf | Match |
|---|---|---|---|---|---|---|---|
| 2399 E 14th St #60 | 0.00mi | 3/2.0 | 1,018 (+6%) | 1mo | $163,900 | $161 | 89 |
| 2399 E 14th St #179 | 0.04mi | 2/2.0 (-1) | 960 (0%) | 6mo | $120,000 | $125 | 88 |
Match score weights: distance 35% · size 25% · config 20% · recency 20%. Top-matched comps best support the ARV.
Projected returns pro-forma
-3.0% appreciation · 1.74% rent growth · sell at horizon
- IRR
- 26.5%
- Equity multiple
- 2.08×
- Total profit
- $48,381
- Equity at exit
- $23,842
- IRR
- 33.4%
- Equity multiple
- 3.87×
- Total profit
- $128,350
- Equity at exit
- $13,825
Cash invested: $44,772 (down + closing). Projections, not guarantees.
Landlord ↔ Tenant lean methodology
- Overall (STATE)
- 18 Strongly Tenant-Friendly
- State California
- 18 Strongly Tenant-Friendly · D+13
- County
- — inherits STATE
- City
- — inherits STATE
ZIP-level market 94577
- Rents YoY
- 1.7%
- Active inventory
- 106
- Price-to-rent
- 4.9×
Monthly cashflow live
- Estimated rent
- $2,727 high interval (Pro) →
- Mortgage (P&I)
- −$839
- Tax from tax record
- −$28 /mo · $334/yr
- Insurance
- −$67
- HOA
- −$0
- Vacancy / Maint / Mgmt
- −$573
- Net cashflow
- $1,221
Break-even live
UW: 25.0% down · 7.5% · 30yr · 1.5% tax · 5.0% vac · 8.0% maint · 8.0% mgmt
Financing live
Cash to close
- Down payment
- $39,975
- Closing costs
- $4,797
- Reserves months
- —
- Total cash needed
- —
Loan-product check · same deal, 3 products live
Conventional
25% down · 7.5% · 30yr
- Down + closing
- —
- Monthly P&I
- —
- Monthly cashflow
- —
- DSCR
- —
- Eligible?
- —
Personal DTI + credit; lowest rate.
DSCR
20% down · 8.5% · 30yr
- Down + closing
- —
- Monthly P&I
- —
- Monthly cashflow
- —
- DSCR
- —
- Eligible?
- —
No personal income docs; deal must DSCR.
Hard money
10% down · 12.0% · 12mo
- Down + closing
- —
- Monthly P&I
- —
- Monthly cashflow
- —
- DSCR
- —
- Eligible?
- —
Short-term bridge; refi at stabilization.
Rent comps 36 comps
| Address | Beds | Baths | Sqft | Rent | $/sqft | DOM | Units | Dist |
|---|---|---|---|---|---|---|---|---|
| 85 Estabrook St San Leandro, CA | 1.0–2.0 | 1.0–2.0 | 800 | $2,775 | $3.47 | 5d | 7 | 0.13mi |
| 2251 Buena Vista Ave Apt 19 San Leandro, CA | 2.0 | 1.0 | 750 | $2,350 | $3.13 | 15d | 1 | 0.17mi |
| 2795 San Leandro Blvd San Leandro, CA | 2.0 | 1.0 | 663 | $2,700 | $4.07 | 43d | 1 | 0.17mi |
| 13495 Bancroft Ave San Leandro, CA | 1.0–2.0 | 1.0 | 745 | $2,495 | $3.35 | 10d | 2 | 0.25mi |
| 70 Harlan St San Leandro, CA | 2.0 | 1.0 | 690 | $2,495 | $3.62 | 2d | 6 | 0.32mi |
| 2027 Washington Ave Unit 1 San Leandro, CA | 2.0 | 1.0 | 950 | $2,600 | $2.74 | 20d | 1 | 0.33mi |
| 2027 Washington Ave San Leandro, CA | 2.0 | 1.0 | 950 | $2,600 | $2.74 | 15d | 1 | 0.33mi |
| 14101 E 14th St #201 San Leandro, CA | 2.0 | 2.0 | 1000 | $2,650 | $2.65 | 43d | 1 | 0.46mi |
| 1774 Bancroft Ave San Leandro, CA | 2.0 | 1.0 | 815 | $3,000 | $3.68 | 5d | 1 | 0.49mi |
| 1675 Hays St San Leandro, CA | 1.0–2.0 | 1.5–2.0 | 859 | $2,645 | $3.08 | 43d | 3 | 0.58mi |
| 475 Juana Ave Unit 06 San Leandro, CA | 2.0 | 1.5 | 800 | $2,395 | $2.99 | 43d | 1 | 0.60mi |
| 900 143rd Ave San Leandro, CA | 2.0 | 2.0 | 972 | $2,746 | $2.83 | 1d | 1 | 0.68mi |
| 1720 142nd Ave San Leandro, CA | 2.0 | 1.0 | 820 | $2,895 | $3.53 | 24d | 1 | 0.70mi |
| 560 Estudillo Ave San Leandro, CA | 2.0 | 1.0 | 900 | $2,495 | $2.77 | 3d | 1 | 0.78mi |
| 566 Estudillo Ave San Leandro, CA | 2.0 | 1.0 | 900 | $2,495 | $2.77 | 12d | 1 | 0.79mi |
| 424 Callan Ave San Leandro, CA | 1.0–2.0 | 1.0–2.0 | 950 | $2,723 | $2.87 | 20d | 6 | 0.83mi |
| 1600 Grand Ave San Leandro, CA | 1.0–2.0 | 1.0 | 900 | $2,695 | $2.99 | 43d | 1 | 0.84mi |
| 14700 Pansy St San Leandro, CA | 2.0 | 2.5 | 1112 | $3,495 | $3.14 | 5d | 1 | 0.84mi |
| 1255 Hays St Unit 8 San Leandro, CA | 2.0 | 2.0 | 1050 | $2,295 | $2.19 | 24d | 1 | 0.86mi |
| 1255 Hays St Unit 17 San Leandro, CA | 2.0 | 1.0 | 950 | $2,195 | $2.31 | 43d | 1 | 0.86mi |
| 100 Callan Ave San Leandro, CA | 2.0 | 1.0–2.0 | 687 | $3,011 | $4.38 | 1d | 6 | 0.86mi |
| 959 Joaquin Ave Unit T955E San Leandro, CA | 2.0 | 1.0 | 832 | $2,450 | $2.94 | 18d | 1 | 0.92mi |
| 14615 Saturn Dr Unit B San Leandro, CA | 2.0 | 1.0 | 1000 | $2,995 | $3.00 | 43d | 1 | 0.96mi |
| 14822 E 14th St San Leandro, CA | 2.0 | 2.0 | 953 | $2,300 | $2.41 | 18d | 1 | 0.99mi |
| 235 Haas Ave San Leandro, CA | 1.0–2.0 | 1.0–2.0 | 710 | $2,685 | $3.78 | 2d | 8 | 1.02mi |
| 179 Haas Ave Apt 11 San Leandro, CA | 2.0 | 1.0 | 800 | $2,575 | $3.22 | 43d | 1 | 1.04mi |
| 150 Haas Ave San Leandro, CA | 2.0 | 1.0 | 930 | $2,400 | $2.58 | 5d | 1 | 1.08mi |
| 14744 Washington Ave San Leandro, CA | 1.0–2.0 | 1.0–2.0 | 860 | $2,645 | $3.08 | 12d | 18 | 1.13mi |
| 902 Davis St San Leandro, CA | 1.0–2.0 | 1.0–2.0 | 756 | $2,875 | $3.80 | 5d | 11 | 1.21mi |
| Corvallis St San Leandro, CA | 3.0 | 1.0 | 1100 | $3,600 | $3.27 | 1d | 1 | 1.21mi |
| 14700 Washington Ave San Leandro, CA | 1.0–2.0 | 1.0 | 724 | $6,399 | $8.84 | 1d | 8 | 1.28mi |
| 14772 Midland Rd Unit C San Leandro, CA | 3.0 | 1.0 | 950 | $2,999 | $3.16 | 10d | 1 | 1.30mi |
| 554 Bancroft Ave San Leandro, CA | 2.0 | 1.0 | 694 | $2,200 | $3.17 | 43d | 1 | 1.31mi |
| 11818 Foothill Way Unit 3 Oakland, CA | 2.0 | 1.0 | 1000 | $1,995 | $2.00 | 43d | 1 | 1.43mi |
| 170 Stoakes Ave Unit 9 San Leandro, CA | 2.0 | 1.0 | 900 | $2,295 | $2.55 | 15d | 1 | 1.43mi |
| 439 Central Ct San Leandro, CA | 2.0 | 1.0 | 1100 | $2,895 | $2.63 | 43d | 1 | 1.50mi |
Tax reassessment forecast CA · Resets to sale price
- Current annual tax
- $334 · $28/mo
- Projected year-2 tax
- $1,215 · $101/mo
- Expected delta
- +$882/yr (+$73/mo · 264.1%)
ⓘ Screening estimate from a state-policy table — verify with the county assessor before closing.
Climate risk First Street
- Flood 1/10 Low FEMA zone X (unshaded) · 0% chance over 30 yrs
- Wildfire 4/10 Moderate
- Heat 4/10 Moderate 7 d/yr ≥84°F today · 15 d/yr by 30 yrs out
- Wind 1/10 Low
- Air quality 7/10 Severe 12 unhealthy d/yr today · 12 by 30 yrs out
Nearby sold comps map
Loading sold comps map…
Walkable amenities ~0.75 mi
Loading nearby amenities…
Taxation est. · year 1
- Rental income
- $32,720
- − Mortgage interest
- −$8,957
- − Property taxes
- −$334
- − Insurance
- −$800
- − Repairs & maintenance
- −$2,618
- − Management
- −$2,618
- − Depreciation
- −$4,652
- Taxable income
- $12,743
- Est. tax owed @ 24.0%
- −$3,058
- After-tax cash flow
- $11,595/yr
For passive investors: Depreciation is non-cash, so a rental often shows a tax loss while cash-flowing — sheltering income. Rental losses are passive: they offset passive income freely, and up to $25,000/yr can offset ordinary (W-2) income if you actively participate and your MAGI is under $100k (phasing out to $0 by $150k); unused losses carry forward. On sale, claimed depreciation is recaptured at up to 25%, and gains may owe capital-gains tax (a 1031 exchange can defer both). Figures are a year-1 estimate at your 24.0% rate — not tax advice; consult a CPA.
Schools (NCES district)
- District
- San Leandro Unified
- NCES district ID
- 0634680
- Math proficiency
- 28% ▲ 3.00%
- Reading proficiency
- 42% ▲ 5.00%
- Median HH income
- $63,377
- Composite
- 34.23/100
- National rank
- #10252
- State rank
- #831 of 1400 in CA
Livability — San Leandro
- Score
- 68/100
- State rank
- #289
- US rank
- #9768
Category grades
Schools grade is shown separately in the Schools card above.
Census & demographics
- Census place
- San Leandro, CA
- County
- Alameda County · 1,614,355 people
- City population
- 88,086
- Metro
- San Francisco-Oakland-Berkeley, CA
- Population (ZIP)
- 46,317
- Household income
- $108,772
- Rent vs Own
- Severe rent burden
- 2005.0
Population outlook (Alameda County) Hauer SSP2
- Today (2025)
- 1,928,884 people
- By 2030
- 2,069,146 · +7.3%
- By 2040
- 2,338,405 · +21.2%
- By 2050
- 2,586,608 · +34.1%
- By 2075
- 3,061,911 · +58.7%
- By 2100
- 3,234,133 · +67.7%
Race, ethnicity, and origin ACS 2023
- Neighborhood character
- Highly diverse neighborhood (Simpson 0.76)
- Race & ethnicity
- Hispanic / Latino 31% Asian 28% White 23% Two or more races 14% Black 12% Native American 2% Pacific Islander 1%
- Hispanic origin (detail)
- Mexican 23%
- Common ancestry
- Russian 2% Italian 1% Lithuanian 1%
- Foreign-born
- 34% · Canada, China, Vietnam
- Languages at home
- 51% English-only · Spanish 23% Chinese 10% Tagalog/Filipino 7%
Political lean MEDSL · Alameda
- 2024 margin
- Solid D (+53.6) · D 74.6% · R 21.0% · Other 4.4%
- 2008→2024 swing
- -5.9pp toward R · 2008: 59.5pp · 2024: 53.6pp
- All cycles
- 2024: D+53.6 2020: D+62.5 2016: D+64.4 2012: D+59.8 2008: D+59.5
Not yet ingested
- Civics
- —
Market trends
- HPI YoY
- ▼ -867.55%
- Current HPI
- 265.2446
- Rent YoY
- ▲ 1.74%
- Metro
- San Francisco-Oakland-Berkeley, CA
- State GDP YoY
- ▲ 3.21%
- F500 in state
- 116
Industry mix (Fortune 500 HQ in CA)
| Industry | F500 HQs | Revenue |
|---|---|---|
| Technology | 27 | $1,492B |
|
||
| Financial Services | 3 | $174B |
|
||
| Retail | 3 | $44B |
|
||
| Insurance | 3 | $26B |
|
||
| Media / Entertainment | 2 | $115B |
|
||
| Pharmaceuticals / Biotech | 2 | $62B |
|
||
Property tax history
+0.7%/yrLatest (2025): $334 · +0.9% YoY. Source: county tax records.
Cash-flow waterfall
monthlySold comps — $/sqft
last 12 mo · ≤1 miLoading sold comps…