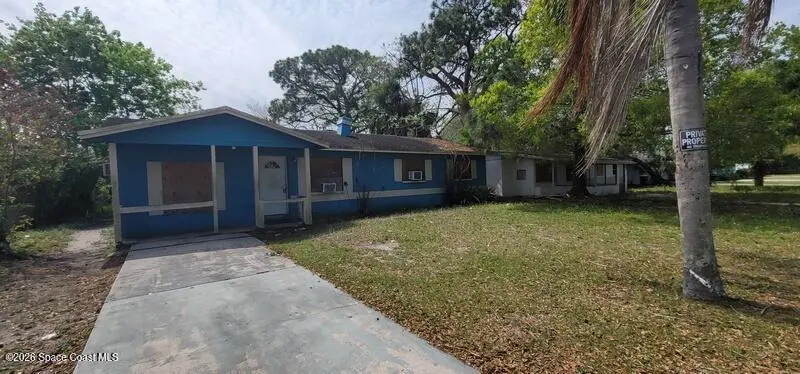
907 Fern Ave · Cocoa, FL
Flood risk 1/10 · Minimal
- FEMA flood zone
- X (unshaded)
- Chance of flooding over 30 yrs
- 0.0%
- Est. flood insurance / yr
- $507 – $1,088
Fire risk 4/10 · Minor
- Est. fire insurance / yr
- $947 – $1,759
Heat risk 10/10 · Severe
- Hot days now (above 106°F)
- 7 days/yr
- Hot days in 30 yrs
- 23 days/yr
Wind risk 10/10 · Severe
- Chance of severe wind over 30 yrs
- 99.0%
Air-quality risk 1/10 · Minimal
- Unhealthy air days now
- 0 days/yr
- Unhealthy air days in 30 yrs
- 0 days/yr
Risk factors via First Street. Map © Google.
Why this score? — see what drove the B grade
The composite is a weighted blend of 9 inputs, each scored 0–100. Each bar is that input's sub-score; the figure is the points it added to the 100-point composite (weight × sub-score).
- Cash flow +30.0/30.0
- DSCR +10.0/10.0
- 1% rule +9.8/10.0
- ARV discount +7.5/15.0
- Schools +4.7/10.0
- Livability +3.6/5.0
- Rent growth +3.5/5.0
- Condition / age +2.5/5.0
- Appreciation +0.0/10.0
$108,000
🖨 Deal sheet 📄 Offer letter ✓ Due diligence
Listing remarks
Many financing options available. Close to jobs, schools, and shopping. Features a large, fenced back yard. Don't miss out. Multi offers exist . Please submit highest and best offer by 11:59 pm est 04/30/2026 .
Key facts
- 8,712 sq ft lot
- Built 1964
- Listed 72 days
Tags
Property features AI
Exterior
- Parking: Off-street parking
- Utilities: Public sewer; Electricity available; Sewer available; Water available
- Home design: Single family residence; One story; Entry level 1; North-facing
- Construction: Block and stucco construction; Shingle roof; Built area approximately 1,156 (living area)
- Exterior features: Front porch; Chain link fencing; Lot is cleared; City street frontage; Asphalt road surface
Interior
- Kitchen: No appliances included
- Bedrooms: 3 bedrooms (all on the main level)
- Bathrooms: 2 bathrooms (1 full, 1 half)
- Heating & cooling: Electric heating; Wall/window air conditioning units
- Interior features: Five total rooms; Other interior features
- Laundry & utility: Unfurnished (no washer/dryer listed)
Neighborhood map
What this means for you Summary
Snapshot
- This is a 3-bed/2.0-bath single-family listed at $108k.
Deal economics
- At list price, monthly cash flow is $468 ($6k/yr) — positive.
- The deal already cash-flows at list — no discount required.
- Meets the 1% rule at list price ($2k rent vs $108k).
- Recommended offer: $102k (6.0% below list) — sets the bar for market timing.
Location & tenants
- Location reads 72/100 on livability (#344 in FL) — a middle-class / working-renter tenant base. Strengths: commute A+, cost of living A+, housing A+; Watch: crime F, amenities F, employment D-.
- Brevard (suburban): math 53% / reading 57% proficiency, ranked #19 of 73 in FL (top 26%) — acceptable for families but not a draw, mixed tenant base, ~2y average lease.
- Zoned schools: Endeavour Elementary School (math 15% / reading 20%, grade F, #2,117 of 2,144 statewide, top 99%, 717 students, 72% FRL); Ronald Mcnair Magnet Middle School (math 58% / reading 50%, grade B-, #196 of 571 statewide, top 36%, 364 students, 58% FRL); Cocoa High School (math 21% / reading 27%, grade F, #529 of 667 statewide, top 80%, 1,551 students, 73% FRL) — zoned schools average 68% FRL vs 43% district-wide (25 pts higher); higher-poverty schools than district average — tighter screening recommended.
- Zoned-school proficiency averages 32% at this address vs 55% district-wide (-23 pts) — the specific schools serving this property underperform the Brevard average; the district grade overstates school quality for this exact location.
- Market conditions: Rents rising fast (+4.1%/yr); 167 active listings in the ZIP; 31 comparable units currently listed for rent nearby; rentals at typical pace (median 24d on market — plan ~3-4 weeks tenant-placement turnaround); lower-income renter base — watch delinquency; 4,602 units permitted in Brevard County in 2024 (702 in 5+ unit buildings).
- This rent runs 43% of the median local income ($44k/yr) — at the standard rent-burdened threshold; future hikes will face affordability resistance.
Forward outlook
- Local home prices are declining (-3.0%/yr); year-one equity from $747 of loan paydown is wiped out by about $3k of value loss. Plan a longer hold.
- Brevard County population projected at +15% by 2050 — modest demand growth; plan on rents tracking national, not racing it.
- At projected returns (-3.0% appreciation + 4.1% rent growth), your $30k cash investment doubles in ~7 years — after that, you're playing with house money.
Negotiation context
- It's been on market 72 days — a 6% lower offer ($102k) is reasonable based on typical stale-listing flexibility.
- Current owner paid $45k; list at $108k implies a 140% gain — meaningful room to come down on a strong offer.
Risks & watch-outs
- Climate carrying-cost: severe wind risk, 99% chance of damaging wind over 30y; extreme-heat days projected 7→23/yr by 2055 (HVAC capex compounding) — expect insurance premiums to compound above CPI over the hold.
Questions for the listing agent
- It's been on market 72 days. Have you received any prior offers? Is the seller open to a 6% concession, seller financing, or rate buy-down credit?
- Built in 1964 — when were the roof, HVAC, electrical panel, plumbing, and water heater last replaced?
- Why hasn't it sold? Are there any deal-killer items the seller is aware of (foundation, flood, title, zoning, code violations)?
- Is there a deadline driving the sale (1031 exchange, divorce, estate, relocation)? That informs how much negotiation room exists.
- Schools are B-rated — typically a magnet for longer-tenancy family renters. What's the average tenant stay here, and is there a school-zone premium baked into asking?
- Crime grade is F in this area — have there been break-ins, vandalism, or insurance claims at this property in the last 3 years? What carrier currently insures it and at what premium?
- What's the average days-on-market for RENTAL listings here right now (not sales)? A rising rental-DOM trend means longer vacancies and softer asking-rent achievability than the comps imply.
- What's the recent tenant-quality profile in this submarket — average credit score on applications, eviction rate, late-payment / NSF rate, and stable-employment percentage? A property-management company in the area should have these aggregated.
- How much new for-sale + rental construction is in the pipeline within 1–3 miles? Heavy new supply typically softens prices + rents 12–24 months out; constrained supply supports both.
Investment metrics
- 1% rule
- 1.48% ✓
- Cap rate
- 11.50%
- Cash-on-cash
- 18.59%
- DSCR
- 1.83
- GRM
- 5.6
CMA / ARV
No comps found within radius.
Projected returns pro-forma
-3.0% appreciation · 4.13% rent growth · sell at horizon
- IRR
- 11.7%
- Equity multiple
- 1.47×
- Total profit
- $14,223
- Equity at exit
- $16,103
- IRR
- 21.6%
- Equity multiple
- 2.94×
- Total profit
- $58,734
- Equity at exit
- $9,338
Cash invested: $30,240 (down + closing). Projections, not guarantees.
Landlord ↔ Tenant lean methodology
- Overall (STATE)
- 87 Strongly Landlord-Friendly
- State Florida
- 87 Strongly Landlord-Friendly · R+3
- County
- — inherits STATE
- City
- — inherits STATE
ZIP-level market 32922
- Home prices YoY
- -20.3%
- Rents YoY
- 4.1%
- Active inventory
- 167
- Price-to-rent
- 5.6×
Monthly cashflow live
- Estimated rent
- $1,599 high interval (Pro) →
- Mortgage (P&I)
- −$566
- Tax from tax record
- −$183 /mo · $2,197/yr
- Insurance
- −$45
- HOA
- −$0
- Vacancy / Maint / Mgmt
- −$336
- Net cashflow
- $468
Break-even live
UW: 25.0% down · 7.5% · 30yr · 1.5% tax · 5.0% vac · 8.0% maint · 8.0% mgmt
Financing live
Cash to close
- Down payment
- $27,000
- Closing costs
- $3,240
- Reserves months
- —
- Total cash needed
- —
Loan-product check · same deal, 3 products live
Conventional
25% down · 7.5% · 30yr
- Down + closing
- —
- Monthly P&I
- —
- Monthly cashflow
- —
- DSCR
- —
- Eligible?
- —
Personal DTI + credit; lowest rate.
DSCR
20% down · 8.5% · 30yr
- Down + closing
- —
- Monthly P&I
- —
- Monthly cashflow
- —
- DSCR
- —
- Eligible?
- —
No personal income docs; deal must DSCR.
Hard money
10% down · 12.0% · 12mo
- Down + closing
- —
- Monthly P&I
- —
- Monthly cashflow
- —
- DSCR
- —
- Eligible?
- —
Short-term bridge; refi at stabilization.
Rent comps 31 comps
| Address | Beds | Baths | Sqft | Rent | $/sqft | DOM | Units | Dist |
|---|---|---|---|---|---|---|---|---|
| 647 School St Cocoa, FL | 2.0 | 1.0 | 844 | $1,495 | $1.77 | 23d | 1 | 0.17mi |
| 305 Prospect Ave Cocoa, FL | 3.0 | 1.0 | 1180 | $1,595 | $1.35 | 23d | 1 | 0.20mi |
| 305 Edinburgh Dr Cocoa, FL | 3.0 | 1.5 | 1280 | $1,750 | $1.37 | 23d | 1 | 0.22mi |
| 420 N Fiske Blvd Cocoa, FL | 3.0 | 1.5 | 1382 | $1,695 | $1.23 | 23d | 1 | 0.40mi |
| 516 Donley St Cocoa, FL | 2.0 | 2.0 | 1485 | $1,800 | $1.21 | 19d | 1 | 0.44mi |
| 317 Pineda St Unit B Cocoa, FL | 2.0 | 1.0 | 984 | $1,200 | $1.22 | 14d | 1 | 0.44mi |
| 616 S Kentucky Ave Cocoa, FL | 3.0 | 1.0 | 960 | $1,600 | $1.67 | 19d | 1 | 0.47mi |
| 613 Paw Paw St Apt A Cocoa, FL | 2.0 | 1.0 | 1104 | $1,175 | $1.06 | 23d | 1 | 0.56mi |
| 118 Olive St Cocoa, FL | 2.0 | 1.0 | 933 | $1,350 | $1.45 | 23d | 1 | 0.60mi |
| 302 Palm Ave Cocoa, FL | 2.0 | 1.0 | 820 | $1,600 | $1.95 | 14d | 1 | 0.61mi |
| 801 Washington St Unit A Cocoa, FL | 3.0 | 1.5 | 1000 | $1,760 | $1.76 | 23d | 1 | 0.62mi |
| 801 Washington St Unit B Cocoa, FL | 2.0 | 1.0 | 700 | $1,290 | $1.84 | 23d | 1 | 0.62mi |
| 301 Forrest Ave Cocoa, FL | 2.0 | 1.0–2.0 | 619 | $1,699 | $2.74 | 23d | 5 | 0.62mi |
| 330 Palm Ave Unit PAL332 Cocoa, FL | 2.0 | 1.0 | 700 | $1,200 | $1.71 | 23d | 1 | 0.63mi |
| 802 Forrest Ave Unit B Cocoa, FL | 2.0 | 1.0 | 1000 | $1,500 | $1.50 | 23d | 1 | 0.69mi |
| 14 Carmalt St Unit CSB105 Cocoa, FL | 2.0 | 1.0 | 1000 | $1,300 | $1.30 | 23d | 1 | 0.69mi |
| 800 N Fiske Blvd Cocoa, FL | 1.0–2.0 | 1.0 | 850 | $1,200 | $1.41 | 23d | 2 | 0.70mi |
| 19 Highland St Cocoa, FL | 2.0 | 1.0 | 728 | $1,600 | $2.20 | 23d | 1 | 0.71mi |
| 1105 Santa Rosa Dr Rockledge, FL | 3.0 | 2.0 | 1096 | $2,000 | $1.82 | 23d | 1 | 0.72mi |
| 1010 N Fiske Blvd Cocoa, FL | 2.0 | 1.0–1.5 | 750 | $1,275 | $1.70 | 14d | 8 | 0.77mi |
| 1515 Peachtree St Cocoa, FL | 3.0 | 2.0 | 1056 | $1,475 | $1.40 | 23d | 1 | 0.78mi |
| 944 Kentucky Ave Rockledge, FL | 3.0 | 2.0 | 1236 | $1,945 | $1.57 | 19d | 1 | 0.85mi |
| 1050 N Fiske Blvd Cocoa, FL | 1.0–2.0 | 1.0 | 708 | $1,200 | $1.69 | 23d | 2 | 0.90mi |
| 1050 N Fiske Blvd #406 Cocoa, FL | 2.0 | 1.0 | 816 | $1,200 | $1.47 | 19d | 1 | 0.90mi |
| 1105 Myrtle Ln Cocoa, FL | 3.0 | 1.5 | 1232 | $1,800 | $1.46 | 14d | 1 | 0.97mi |
| 295 Royal Tern CIR Rockledge, FL | 1.0–3.0 | 1.0–2.0 | 1020 | $2,467 | $2.42 | 14d | 33 | 1.00mi |
| 1616 Terrace St Cocoa, FL | 3.0 | 2.0 | 850 | $1,600 | $1.88 | 23d | 1 | 1.00mi |
| 1305 N Fiske Blvd Cocoa, FL | 2.0 | 1.0 | 750 | $1,275 | $1.70 | 19d | 1 | 1.14mi |
| 1711 Dixon Blvd Cocoa, FL | 2.0 | 1.0 | 740 | $1,262 | $1.70 | 19d | 2 | 1.39mi |
| 1711 Dixon Blvd #246 Cocoa, FL | 2.0 | 1.0 | 837 | $1,350 | $1.61 | 14d | 1 | 1.42mi |
| 1525 S Fiske Blvd Rockledge, FL | 1.0–2.0 | 1.0 | 890 | $1,500 | $1.69 | 23d | 1 | 1.42mi |
Listing history 18 events
-
2026-06-18days on market $108,000 Active 72 DOM
-
2026-06-17days on market $108,000 Active 71 DOM
-
2026-06-16days on market $108,000 Active 70 DOM
-
2026-06-15days on market $108,000 Active 69 DOM
-
2026-06-14pricedays on market $108,000 Active 67 DOM
-
2026-06-10days on market $114,000 Active 64 DOM
-
2026-06-08days on market $114,000 Active 62 DOM
-
2026-06-07days on market $114,000 Active 61 DOM
-
2026-06-05days on market $114,000 Active 58 DOM
-
2026-06-03days on market $114,000 Active 57 DOM
-
2026-06-02days on market $114,000 Active 56 DOM
-
2026-06-01days on market $114,000 Active 55 DOM
-
2026-05-31days on market $114,000 Active 54 DOM
-
2026-05-31days on market $114,000 Active 53 DOM
-
2026-05-08price $114,000
-
2026-05-07price $109,000
-
2026-04-06$120,000 Active
-
1986-10-01soldstatus $45,000
ⓘ Source: listings_history table (triggers on properties + properties_extension) + one-shot
backfill from property_details.listing_events for pre-trigger history.
Tax reassessment forecast FL · Resets to sale price
- Current annual tax
- $2,197 · $183/mo
- Projected year-2 tax
- $2,197 · $183/mo
- Expected delta
- $0/yr ($0/mo · 0.0%)
ⓘ Screening estimate from a state-policy table — verify with the county assessor before closing.
Climate risk First Street
- Flood 1/10 Low FEMA zone X (unshaded) · 0% chance over 30 yrs
- Wildfire 4/10 Moderate
- Heat 10/10 Extreme 7 d/yr ≥106°F today · 23 d/yr by 30 yrs out
- Wind 10/10 Extreme 99% chance of damaging wind over 30 yrs
- Air quality 1/10 Low 0 unhealthy d/yr today · 0 by 30 yrs out
Nearby sold comps map
Loading sold comps map…
Walkable amenities ~0.75 mi
Loading nearby amenities…
Taxation est. · year 1
- Rental income
- $19,182
- − Mortgage interest
- −$6,050
- − Property taxes
- −$2,197
- − Insurance
- −$540
- − Repairs & maintenance
- −$1,535
- − Management
- −$1,535
- − Depreciation
- −$3,142
- Taxable income
- $4,185
- Est. tax owed @ 24.0%
- −$1,004
- After-tax cash flow
- $4,616/yr
For passive investors: Depreciation is non-cash, so a rental often shows a tax loss while cash-flowing — sheltering income. Rental losses are passive: they offset passive income freely, and up to $25,000/yr can offset ordinary (W-2) income if you actively participate and your MAGI is under $100k (phasing out to $0 by $150k); unused losses carry forward. On sale, claimed depreciation is recaptured at up to 25%, and gains may owe capital-gains tax (a 1031 exchange can defer both). Figures are a year-1 estimate at your 24.0% rate — not tax advice; consult a CPA.
Schools (NCES district)
- District
- Brevard
- NCES district ID
- 1200150
- Math proficiency
- 53% ▼ -9.00%
- Reading proficiency
- 57% ▼ -4.00%
- Median HH income
- $49,426
- Composite
- 46.86/100
- National rank
- #2370
- State rank
- #19 of 73 in FL
Livability — Cocoa
- Score
- 72/100
- State rank
- #344
- US rank
- #5979
Category grades
Schools grade is shown separately in the Schools card above.
Census & demographics
- Census place
- Cocoa, FL
- County
- Brevard County · 602,871 people
- City population
- 67,424
- Metro
- Palm Bay-Melbourne-Titusville, FL
- Population (ZIP)
- 14,700
- Household income
- $44,469
- Rent vs Own
- Severe rent burden
- 1007.0
Population outlook (Brevard County) Hauer SSP2
- Today (2025)
- 623,254 people
- By 2030
- 648,420 · +4.0%
- By 2040
- 690,009 · +10.7%
- By 2050
- 715,669 · +14.8%
- By 2075
- 775,744 · +24.5%
- By 2100
- 776,687 · +24.6%
Race, ethnicity, and origin ACS 2023
- Neighborhood character
- Diverse neighborhood (Simpson 0.66)
- Race & ethnicity
- White 45% Black 29% Hispanic / Latino 21% Two or more races 12%
- Hispanic origin (detail)
- Mexican 10% Puerto Rican 1% Cuban 4%
- Common ancestry
- Slovak 2% Romanian 2% Lithuanian 1%
- Foreign-born
- 14% · Canada
- Languages at home
- 81% English-only · Spanish 16% German/W. Germanic 2%
Political lean MEDSL · Brevard
- 2024 margin
- Strong R (+20.8) · D 39.1% · R 59.9% · Other 1.0%
- 2008→2024 swing
- -10.4pp toward R · 2008: -10.4pp · 2024: -20.8pp
- All cycles
- 2024: R+20.8 2020: R+16.4 2016: R+19.8 2012: R+12.7 2008: R+10.4
Not yet ingested
- Civics
- —
Market trends
- HPI YoY
- ▼ -68.95%
- Current HPI
- 271.1139
- Rent YoY
- ▲ 4.13%
- Metro
- Palm Bay-Melbourne-Titusville, FL
- State GDP YoY
- ▲ 3.28%
- F500 in state
- 36
Industry mix (Fortune 500 HQ in FL)
| Industry | F500 HQs | Revenue |
|---|---|---|
| Industrial Technology | 2 | $29B |
|
||
| Insurance | 2 | $17B |
|
||
| Retail | 1 | $60B |
|
||
| Technology Distribution | 1 | $58B |
|
||
| Homebuilding | 1 | $35B |
|
||
| Technology Manufacturing | 1 | $35B |
|
||
Price history
+153.3% since first listed4 events — show timeline
- 2026-05-08 Price Changed $114,000 SCMLS
- 2026-05-07 Price Changed $109,000 SCMLS
- 2026-04-06 Listed $120,000 SCMLS
- 1986-10-01 Sold (Public Records) $45,000 Public Records
Property tax history
+24.2%/yrLatest (2025): $2,197 · -1.5% YoY. Source: county tax records.
Cash-flow waterfall
monthlySold comps — $/sqft
last 12 mo · ≤1 miLoading sold comps…