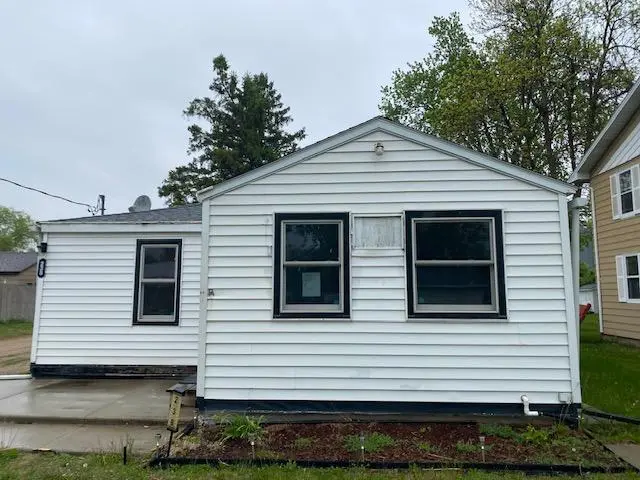
238 Meeker Ave W · Eden Valley, MN
Flood risk 1/10 · Minimal
- FEMA flood zone
- X (unshaded)
- Chance of flooding over 30 yrs
- 0.0%
- Est. flood insurance / yr
- $473 – $860
Fire risk 1/10 · Minimal
- Est. fire insurance / yr
- $888 – $1,650
Heat risk 2/10 · Minimal
- Hot days now (above 98°F)
- 7 days/yr
- Hot days in 30 yrs
- 14 days/yr
Wind risk 2/10 · Minimal
- Chance of severe wind over 30 yrs
- —
Air-quality risk 2/10 · Minimal
- Unhealthy air days now
- 2 days/yr
- Unhealthy air days in 30 yrs
- 2 days/yr
Risk factors via First Street. Map © Google.
Why this score? — see what drove the C- grade
The composite is a weighted blend of 9 inputs, each scored 0–100. Each bar is that input's sub-score; the figure is the points it added to the 100-point composite (weight × sub-score).
- Cash flow +13.7/30.0
- Appreciation +10.0/10.0
- ARV discount +7.5/15.0
- Schools +4.6/10.0
- DSCR +4.1/10.0
- Livability +4.0/5.0
- 1% rule +3.2/10.0
- Rent growth +2.5/5.0
- Condition / age +2.5/5.0
$105,000
🖨 Deal sheet 📄 Offer letter ✓ Due diligence
Listing remarks MLS
Very cute home with many updates inside including a gorgeous kitchen and bathroom@ Newer appliances, granite counter tops, vinyl flooring, and main floor laundry. Big fenced in yard perfect form entertaining. Basement has kitchenette and potential for more bedrooms and a bigger family room.
Key facts
- Main floor laundry
- Updated kitchen
- Fenced-in backyard
Tags
Property features AI
Exterior
- Parking: Attached 2-car garage (approx. 21x24, 7' tall door, 9' wide door) with gravel and concrete surfaces
- Utilities: City water connected; City sewer connected; Electric service: circuit breakers and fuses, 100 amp service; Electric fuel for heating/hot water
- Home design: Residential property; One story; Main entry level is the main floor
- Construction: Frame construction; Asphalt pitched roof; Block foundation
- Exterior features: Vinyl exterior; Chain link and partial fencing; Irregular lot with light tree coverage; City street frontage with curbs, paved streets and sidewalks
Interior
- Kitchen: Eat-in kitchen; Washer/dryer hookup (listed with amenities)
- Bedrooms: 2 bedrooms (primary on main level); Additional bedroom on lower level
- Flooring: Tile floors
- Bathrooms: 1 full bathroom on main floor; 1 half bathroom in basement
- Heating & cooling: Baseboard heat; No central air
- Interior features: Main floor primary bedroom; Tile floors; Electric water heater; Full block basement with sump pump; Eat-in kitchen / informal dining area; Main floor laundry
- Laundry & utility: Washer hookup; Electric dryer hookup (main level)
Neighborhood map
What this means for you Summary
Snapshot
- This is a 2-bed/2.0-bath single-family listed at $105k.
Deal economics
- At list price, monthly cash flow is $7 ($89/yr) — positive.
- The deal already cash-flows at list — no discount required.
- To meet the 1% rule (rent ≥ 1% of price), the offer needs to be $86k (18.0% below list).
- Recommended offer: $86k (18.0% below list) — sets the bar for 1% rule.
Location & tenants
- Location reads 79/100 on livability (#99 in MN, #2,244 nationally) — a middle-class / working-renter tenant base. Strengths: crime A+, cost of living A+, housing A+; Watch: employment C-, amenities F, commute F.
- Eden Valley-Watkins School District (rural): math 52% / reading 55% proficiency, ranked #82 of 301 in MN (top 27%) — acceptable for families but not a draw, mixed tenant base, ~2y average lease.
- Market conditions: 21 active listings in the ZIP; 73 units permitted in Meeker County in 2024 (5 in 5+ unit buildings).
Forward outlook
- In year one you build about $11k of equity ($726 loan paydown + $10k appreciation (10.0% local appreciation)).
- Meeker County population projected at -17% by 2050 — secular population decline; favor cash flow + early exit over multi-decade hold.
- At projected returns (10.0% appreciation + 3.0% rent growth), your $29k cash investment doubles in ~3 years — after that, you're playing with house money.
- By year 4, paydown + projected appreciation supports a ~$40k cash-out refi (75% LTV) — recoverable capital for the next deal without selling this one.
Negotiation context
- It's been on market 17 days — a 2% lower offer ($103k) is reasonable based on typical stale-listing flexibility.
- 8 sale attempts since 17y ago with the ask held roughly flat each time — persistent listings suggest the price (not the market) is what's stuck; bring a comps-based counter.
Risks & watch-outs
- Watch-outs: built in 1905 — expect roof / HVAC / electrical / plumbing capex.
Questions for the listing agent
- Built in 1905 — when were the roof, HVAC, electrical panel, plumbing, and water heater last replaced?
- Is there a deadline driving the sale (1031 exchange, divorce, estate, relocation)? That informs how much negotiation room exists.
- Schools are A-rated — typically a magnet for longer-tenancy family renters. What's the average tenant stay here, and is there a school-zone premium baked into asking?
- What's the average days-on-market for RENTAL listings here right now (not sales)? A rising rental-DOM trend means longer vacancies and softer asking-rent achievability than the comps imply.
- What's the recent tenant-quality profile in this submarket — average credit score on applications, eviction rate, late-payment / NSF rate, and stable-employment percentage? A property-management company in the area should have these aggregated.
- How much new for-sale + rental construction is in the pipeline within 1–3 miles? Heavy new supply typically softens prices + rents 12–24 months out; constrained supply supports both.
Investment metrics
- 1% rule
- 0.82% ✗
- Cap rate
- 6.38%
- Cash-on-cash
- 0.30%
- DSCR
- 1.01
- GRM
- 10.2
CMA / ARV
No comps found within radius.
Projected returns pro-forma
10.0% appreciation · 3.0% rent growth · sell at horizon
- IRR
- 24.5%
- Equity multiple
- 2.96×
- Total profit
- $57,640
- Equity at exit
- $94,592
- IRR
- 21.7%
- Equity multiple
- 6.76×
- Total profit
- $169,329
- Equity at exit
- $203,992
Cash invested: $29,400 (down + closing). Projections, not guarantees.
Landlord ↔ Tenant lean methodology
- Overall (STATE)
- 46 Balanced
- State Minnesota
- 46 Balanced · D+2
- County
- — inherits STATE
- City
- — inherits STATE
ZIP-level market 55329
- Home prices YoY
- 6.0%
- Active inventory
- 21
- Price-to-rent
- 10.2×
Monthly cashflow live
- Estimated rent
- $861 medium interval (Pro) →
- Mortgage (P&I)
- −$551
- Tax from tax record
- −$78 /mo · $938/yr
- Insurance
- −$44
- HOA
- −$0
- Vacancy / Maint / Mgmt
- −$181
- Net cashflow
- $7
Break-even live
UW: 25.0% down · 7.5% · 30yr · 1.5% tax · 5.0% vac · 8.0% maint · 8.0% mgmt
Financing live
Cash to close
- Down payment
- $26,250
- Closing costs
- $3,150
- Reserves months
- —
- Total cash needed
- —
Loan-product check · same deal, 3 products live
Conventional
25% down · 7.5% · 30yr
- Down + closing
- —
- Monthly P&I
- —
- Monthly cashflow
- —
- DSCR
- —
- Eligible?
- —
Personal DTI + credit; lowest rate.
DSCR
20% down · 8.5% · 30yr
- Down + closing
- —
- Monthly P&I
- —
- Monthly cashflow
- —
- DSCR
- —
- Eligible?
- —
No personal income docs; deal must DSCR.
Hard money
10% down · 12.0% · 12mo
- Down + closing
- —
- Monthly P&I
- —
- Monthly cashflow
- —
- DSCR
- —
- Eligible?
- —
Short-term bridge; refi at stabilization.
Listing history 13 events
-
2026-06-18days on market $105,000 Active 17 DOM
-
2026-06-17days on market $105,000 Active 16 DOM
-
2026-06-16days on market $105,000 Active 15 DOM
-
2026-06-15days on market $105,000 Active 14 DOM
-
2026-06-13days on market $105,000 Active 12 DOM
-
2026-06-12days on market $105,000 Active 11 DOM
-
2026-06-09days on market $105,000 Active 8 DOM
-
2026-06-08days on market $105,000 Active 7 DOM
-
2026-06-07days on market $105,000 Active 6 DOM
-
2026-06-05days on market $105,000 Active 4 DOM
-
2026-06-04days on market $105,000 Active 2 DOM
-
2026-06-01remarks 160-char remark
-
2026-06-01$105,000 Active 1 DOM
ⓘ Source: listings_history table (triggers on properties + properties_extension) + one-shot
backfill from property_details.listing_events for pre-trigger history.
Tax reassessment forecast MN · Partial reset (capped growth)
- Current annual tax
- $938 · $78/mo
- Projected year-2 tax
- $1,057 · $88/mo
- Expected delta
- +$119/yr (+$10/mo · 12.7%)
ⓘ Screening estimate from a state-policy table — verify with the county assessor before closing.
Climate risk First Street
- Flood 1/10 Low FEMA zone X (unshaded) · 0% chance over 30 yrs
- Wildfire 1/10 Low
- Heat 2/10 Low 7 d/yr ≥98°F today · 14 d/yr by 30 yrs out
- Wind 2/10 Low
- Air quality 2/10 Low 2 unhealthy d/yr today · 2 by 30 yrs out
Nearby sold comps map
Loading sold comps map…
Walkable amenities ~0.75 mi
Loading nearby amenities…
Taxation est. · year 1
- Rental income
- $10,329
- − Mortgage interest
- −$5,882
- − Property taxes
- −$938
- − Insurance
- −$525
- − Repairs & maintenance
- −$826
- − Management
- −$826
- − Depreciation
- −$3,055
- Taxable loss
- −$1,723
- Est. tax savings @ 24.0%
- +$413
- After-tax cash flow
- $503/yr
For passive investors: Depreciation is non-cash, so a rental often shows a tax loss while cash-flowing — sheltering income. Rental losses are passive: they offset passive income freely, and up to $25,000/yr can offset ordinary (W-2) income if you actively participate and your MAGI is under $100k (phasing out to $0 by $150k); unused losses carry forward. On sale, claimed depreciation is recaptured at up to 25%, and gains may owe capital-gains tax (a 1031 exchange can defer both). Figures are a year-1 estimate at your 24.0% rate — not tax advice; consult a CPA.
Schools (NCES district)
- District
- Eden Valley-Watkins School District
- NCES district ID
- 2711190
- Math proficiency
- 52% ▼ -19.00%
- Reading proficiency
- 55% ▼ -13.00%
- Median HH income
- $51,131
- Composite
- 45.79/100
- National rank
- #2560
- State rank
- #82 of 301 in MN
Livability — Eden Valley
- Score
- 79/100
- State rank
- #99
- US rank
- #2244
Category grades
Schools grade is shown separately in the Schools card above.
Census & demographics
- Census place
- Eden Valley, MN
- Population (ZIP)
- 2,252
Population outlook (Meeker County) Hauer SSP2
- Today (2025)
- 22,292 people
- By 2030
- 21,631 · -3.0%
- By 2040
- 20,070 · -10.0%
- By 2050
- 18,413 · -17.4%
- By 2075
- 15,145 · -32.1%
- By 2100
- 11,698 · -47.5%
Race, ethnicity, and origin ACS 2023
- Neighborhood character
- Predominantly White (94%)
- Race & ethnicity
- White 94% Hispanic / Latino 3% Two or more races 2%
- Common ancestry
- Portuguese 4% Romanian 2% Lithuanian 2%
- Foreign-born
- 1% · China
- Languages at home
- 99% English-only · Spanish 1%
Political lean MEDSL · Meeker
- 2024 margin
- Solid R (+42.8) · D 27.9% · R 70.7% · Other 1.5%
- 2008→2024 swing
- -32.0pp toward R · 2008: -10.8pp · 2024: -42.8pp
- All cycles
- 2024: R+42.8 2020: R+40.6 2016: R+40.3 2012: R+16.0 2008: R+10.8
Not yet ingested
- Civics
- —
Market trends
- HPI YoY
- ▲ 16.21%
- Current HPI
- 288.6957
- Rent YoY
- —
- Metro
- —
- State GDP YoY
- ▲ 2.41%
- F500 in state
- 34
Industry mix (Fortune 500 HQ in MN)
| Industry | F500 HQs | Revenue |
|---|---|---|
| Healthcare | 2 | $407B |
|
||
| Retail | 2 | $150B |
|
||
| Consumer Goods | 2 | $32B |
|
||
| Industrial Machinery | 2 | $6B |
|
||
| Agriculture | 1 | $40B |
|
||
| Healthcare / Medical Devices | 1 | $32B |
|
||
Price history
+57.9% since first listed24 events — show timeline
- 2026-06-01 Listed $105,000 NORTHSTARMLS as Distributed by MLS Grid
- 2020-04-24 Sold (Public Records) $120,000 Public Records
- 2020-04-24 Sold (MLS) $120,000 NORTHSTARMLS as Distributed by MLS Grid
- 2020-03-17 Pending — NORTHSTARMLS as Distributed by MLS Grid
- 2020-03-13 Listed $120,000 NORTHSTARMLS as Distributed by MLS Grid
- 2019-07-18 Listing Removed — NORTHSTARMLS as Distributed by MLS Grid
- 2019-06-03 Price Changed $130,000 NORTHSTARMLS as Distributed by MLS Grid
- 2019-05-14 Price Changed $135,000 NORTHSTARMLS as Distributed by MLS Grid
- 2019-05-03 Listed $140,000 NORTHSTARMLS as Distributed by MLS Grid
- 2015-08-28 Sold (Public Records) $63,000 Public Records
- 2015-08-07 Sold (MLS) $63,000 NORTHSTARMLS as Distributed by MLS Grid
- 2015-06-03 Pending — NORTHSTARMLS as Distributed by MLS Grid
- 2015-05-19 Contingent — NORTHSTARMLS as Distributed by MLS Grid
- 2015-04-30 Listed $59,900 NORTHSTARMLS as Distributed by MLS Grid
- 2014-04-03 Price Changed $52,900 NORTHSTARMLS as Distributed by MLS Grid
- 2014-04-03 Listing Removed — NORTHSTARMLS as Distributed by MLS Grid
- 2014-04-03 Price Changed $52,900 NORTHSTARMLS as Distributed by MLS Grid
- 2014-04-03 Listing Removed — NORTHSTARMLS as Distributed by MLS Grid
- 2013-11-26 Listed $59,900 NORTHSTARMLS as Distributed by MLS Grid
- 2013-11-26 Listed $59,900 NORTHSTARMLS as Distributed by MLS Grid
- 2010-10-05 Listing Removed — NORTHSTARMLS as Distributed by MLS Grid
- 2010-04-05 Listed $64,900 NORTHSTARMLS as Distributed by MLS Grid
- 2009-12-13 Listing Removed — NORTHSTARMLS as Distributed by MLS Grid
- 2009-06-13 Listed $66,500 NORTHSTARMLS as Distributed by MLS Grid
Property tax history
+4.0%/yrLatest (2025): $938 · -17.9% YoY. Source: county tax records.
Cash-flow waterfall
monthlySold comps — $/sqft
last 12 mo · ≤1 miLoading sold comps…