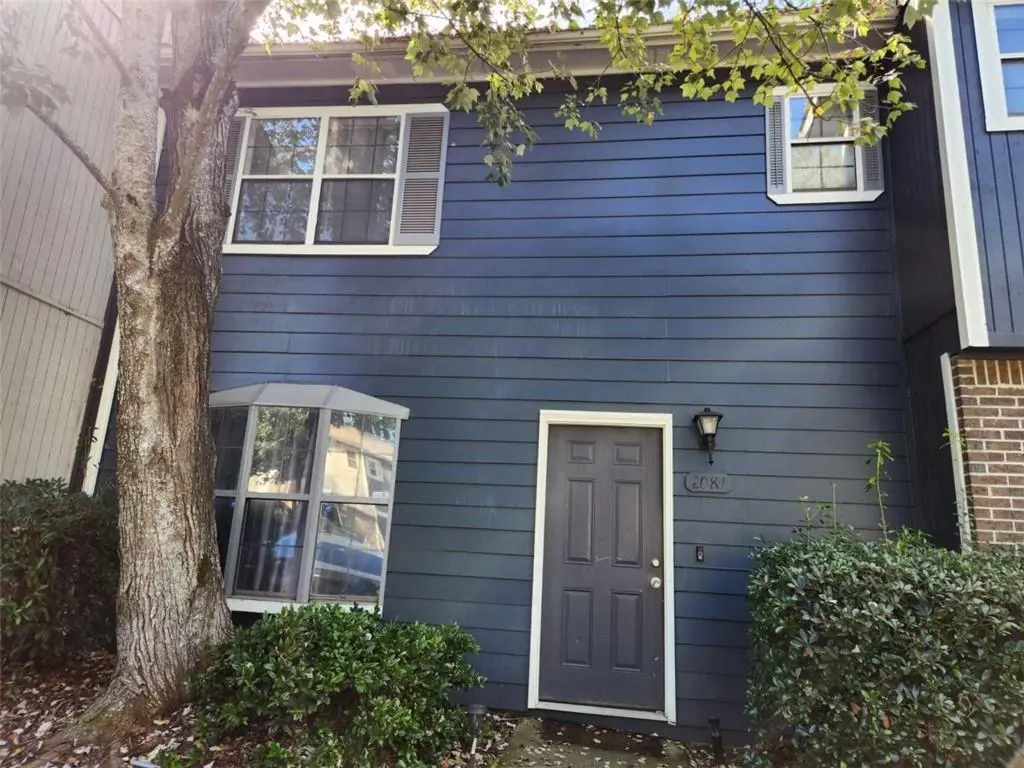
2081 Lenoa Ln · Austell, GA
Flood risk 1/10 · Minimal
- FEMA flood zone
- X (unshaded)
- Chance of flooding over 30 yrs
- 0.0%
- Est. flood insurance / yr
- $507 – $1,088
Fire risk 2/10 · Minimal
- Est. fire insurance / yr
- $963 – $1,789
Heat risk 5/10 · Moderate
- Hot days now (above 103°F)
- 7 days/yr
- Hot days in 30 yrs
- 18 days/yr
Wind risk 4/10 · Minor
- Chance of severe wind over 30 yrs
- 24.0%
Air-quality risk 4/10 · Minor
- Unhealthy air days now
- 4 days/yr
- Unhealthy air days in 30 yrs
- 5 days/yr
Risk factors via First Street. Map © Google.
Why this score? — see what drove the B- grade
The composite is a weighted blend of 9 inputs, each scored 0–100. Each bar is that input's sub-score; the figure is the points it added to the 100-point composite (weight × sub-score).
- Cash flow +25.5/30.0
- ARV discount +15.0/15.0
- DSCR +8.4/10.0
- 1% rule +6.4/10.0
- Schools +3.8/10.0
- Livability +3.4/5.0
- Rent growth +2.8/5.0
- Condition / age +2.5/5.0
- Appreciation +0.0/10.0
$150,000
🖨 Deal sheet 📄 Offer letter ✓ Due diligence
Listing remarks MLS
Turnkey Investment Opportunity in Cobb County! Tenant-occupied 2-bedroom, 2.5-bath end-unit townhome in a high-demand rental area. This well-maintained property already generates steady rental income, making it an excellent addition to any portfolio. Recent updates include freshly painted exterior and newer carpet on the first floor, minimizing immediate maintenance needs. Additional photos available upon request.
Key facts
- 1,785 sq ft lot
- 2 parking spots
- Built 1985
Neighborhood map
What this means for you Summary
Snapshot
- This is a 2-bed/1.5-bath townhouse listed at $150k.
Deal economics
- At list price, monthly cash flow is $350 ($4k/yr) — positive.
- The deal already cash-flows at list — no discount required.
- Meets the 1% rule at list price ($2k rent vs $150k).
- Recommended offer: $136k (9.0% below list) — sets the bar for market timing.
- Cap rate 9.1% vs local median 4.7% in Austell — top-decile yield for the area; either an underpriced asset or a hidden risk that comps aren't pricing in. Stress-test before assuming the spread holds.
Location & tenants
- Location reads 67/100 on livability (#175 in GA) — a middle-class / working-renter tenant base. Strengths: cost of living A+, housing A+; Watch: employment D+, schools D-, amenities F.
- Cobb County (suburban): math 39% / reading 45% proficiency, ranked #25 of 174 in GA (top 14%) — families likely to look elsewhere, expect single-tenant / working-renter base with shorter leases.
- Market conditions: Rents rising (+1.3%/yr); 184 active listings in the ZIP; 27 comparable units currently listed for rent nearby; rentals leasing fast (median 11d on market — plan ~1-2 weeks tenant-placement turnaround); 1,625 units permitted in Cobb County in 2024 (389 in 5+ unit buildings).
Forward outlook
- Local home prices are declining (-3.0%/yr); year-one equity from $1k of loan paydown is wiped out by about $4k of value loss. Plan a longer hold.
- Cobb County population projected at +33% by 2050 — long-run rental-demand tailwind backs the buy-and-hold thesis.
Negotiation context
- It's been on market 99 days — a 9% lower offer ($136k) is reasonable based on typical stale-listing flexibility.
- 5 sale attempts; this cycle's ask has dropped $20k (12%) from the opening price — seller is motivated, your offer sets the floor, not the list.
- Current owner paid $48k; list at $150k implies a 211% gain — meaningful room to come down on a strong offer.
Risks & watch-outs
- Climate carrying-cost: extreme-heat days projected 7→18/yr by 2055 (HVAC capex compounding) — expect insurance premiums to compound above CPI over the hold.
Questions for the listing agent
- It's been on market 99 days. Have you received any prior offers? Is the seller open to a 9% concession, seller financing, or rate buy-down credit?
- Why hasn't it sold? Are there any deal-killer items the seller is aware of (foundation, flood, title, zoning, code violations)?
- Is there a deadline driving the sale (1031 exchange, divorce, estate, relocation)? That informs how much negotiation room exists.
- Schools are D-rated, which usually means shorter tenancies and higher turnover. Who's the typical renter profile here, and what's been the actual vacancy rate?
- What's the average days-on-market for RENTAL listings here right now (not sales)? A rising rental-DOM trend means longer vacancies and softer asking-rent achievability than the comps imply.
- What's the recent tenant-quality profile in this submarket — average credit score on applications, eviction rate, late-payment / NSF rate, and stable-employment percentage? A property-management company in the area should have these aggregated.
- How much new for-sale + rental construction is in the pipeline within 1–3 miles? Heavy new supply typically softens prices + rents 12–24 months out; constrained supply supports both.
Investment metrics
- 1% rule
- 1.14% ✓
- Cap rate
- 9.09%
- Cash-on-cash
- 9.99%
- DSCR
- 1.44
- GRM
- 7.3
CMA / ARV
- ARV (on-the-fly)
- $183,260
- Comps found
- 7
Show comp detail 7 sales within ~0.75 mi
| Address | Dist | Beds/Ba | Sqft | Sold | Price | $/sf | Match |
|---|---|---|---|---|---|---|---|
| 2075 Lenoa Ln | 0.02mi | 2/2.5 | 1,078 (0%) | 1mo | $113,000 | $105 | 94 |
| 1984 Padgett Dr | 0.02mi | 2/2.5 | 1,084 (+1%) | 7mo | $139,000 | $128 | 89 |
| 2102 Lenoa Ln | 0.06mi | 2/2.5 | 1,078 (0%) | 11mo | $206,000 | $191 | 84 |
| 2012 Drennon Ave | 0.15mi | 2/2.5 | 1,056 (-2%) | 4mo | $179,000 | $170 | 82 |
| 2020 Drennon Ave | 0.13mi | 2/2.5 | 1,078 (0%) | 13mo | $205,000 | $190 | 79 |
| 2044 Lenoa Ln | 0.10mi | 2/2.5 | 1,078 (0%) | 15mo | $152,000 | $141 | 78 |
| 2070 Lenoa Ln | 0.05mi | 2/2.5 | 1,078 (0%) | 24mo | $205,000 | $190 | 74 |
Match score weights: distance 35% · size 25% · config 20% · recency 20%. Top-matched comps best support the ARV.
Projected returns pro-forma
-3.0% appreciation · 1.3% rent growth · sell at horizon
- IRR
- -3.2%
- Equity multiple
- 0.88×
- Total profit
- $-4,912
- Equity at exit
- $22,365
- IRR
- 4.6%
- Equity multiple
- 1.31×
- Total profit
- $13,003
- Equity at exit
- $12,969
Cash invested: $42,000 (down + closing). Projections, not guarantees.
Landlord ↔ Tenant lean methodology
- Overall (STATE)
- 90 Strongly Landlord-Friendly
- State Georgia
- 90 Strongly Landlord-Friendly · R+3
- County
- — inherits STATE
- City
- — inherits STATE
ZIP-level market 30106
- Home prices YoY
- -33.4%
- Rents YoY
- 1.3%
- Active inventory
- 184
- Price-to-rent
- 7.3×
Monthly cashflow live
- Estimated rent
- $1,711 high interval (Pro) →
- Mortgage (P&I)
- −$787
- Tax from tax record
- −$153 /mo · $1,833/yr
- Insurance
- −$62
- HOA
- −$0
- Vacancy / Maint / Mgmt
- −$359
- Net cashflow
- $350
Break-even live
UW: 25.0% down · 7.5% · 30yr · 1.5% tax · 5.0% vac · 8.0% maint · 8.0% mgmt
Financing live
Cash to close
- Down payment
- $37,500
- Closing costs
- $4,500
- Reserves months
- —
- Total cash needed
- —
Loan-product check · same deal, 3 products live
Conventional
25% down · 7.5% · 30yr
- Down + closing
- —
- Monthly P&I
- —
- Monthly cashflow
- —
- DSCR
- —
- Eligible?
- —
Personal DTI + credit; lowest rate.
DSCR
20% down · 8.5% · 30yr
- Down + closing
- —
- Monthly P&I
- —
- Monthly cashflow
- —
- DSCR
- —
- Eligible?
- —
No personal income docs; deal must DSCR.
Hard money
10% down · 12.0% · 12mo
- Down + closing
- —
- Monthly P&I
- —
- Monthly cashflow
- —
- DSCR
- —
- Eligible?
- —
Short-term bridge; refi at stabilization.
Rent comps 27 comps
| Address | Beds | Baths | Sqft | Rent | $/sqft | DOM | Units | Dist |
|---|---|---|---|---|---|---|---|---|
| 1975 Padgett Dr Unit 1 Austell, GA | 2.0 | 2.5 | 1200 | $1,449 | $1.21 | 22d | 1 | 0.05mi |
| 2051 Lenoa Ln Austell, GA | 2.0 | 2.5 | 1078 | $1,600 | $1.48 | 5d | 1 | 0.07mi |
| 4649 Danna Dr Austell, GA | 3.0 | 2.0 | 1438 | $1,765 | $1.23 | 24d | 1 | 0.30mi |
| 2105 Mesa Valley Way Austell, GA | 1.0–3.0 | 1.0–2.0 | 1102 | $1,672 | $1.52 | 1d | 35 | 0.43mi |
| 4236 Austell Rd Austell, GA | 1.0–2.0 | 1.0–2.0 | 1050 | $1,623 | $1.55 | 2d | 17 | 0.44mi |
| 2141 Sandalwood Ln SW Austell, GA | 3.0 | 2.0 | 1475 | $2,136 | $1.45 | 15d | 1 | 0.50mi |
| 1650 Anderson Mill Rd Austell, GA | 1.0–3.0 | 1.0–2.0 | 1026 | $1,492 | $1.45 | 1d | 22 | 0.61mi |
| 1899 Mulkey Rd Austell, GA | 1.0–3.0 | 1.0–2.0 | 990 | $1,416 | $1.43 | 3d | 7 | 0.88mi |
| 1707 Virginia Cir SW Mableton, GA | 3.0 | 2.0 | 1235 | $1,835 | $1.49 | 24d | 1 | 0.90mi |
| 3759 Mulkey Cir SW Marietta, GA | 3.0 | 1.5 | 1216 | $1,600 | $1.32 | 43d | 1 | 0.96mi |
| 1820 Mulkey Rd Austell, GA | 1.0–3.0 | 1.0–2.0 | 970 | $1,468 | $1.51 | 1d | 19 | 1.09mi |
| 2222 East-West Connector Austell, GA | 1.0–3.0 | 1.0–2.0 | 1143 | $1,450 | $1.27 | 43d | 30 | 1.09mi |
| 3730 Silver Leaf Ct SW Marietta, GA | 3.0 | 2.0 | 1248 | $2,250 | $1.80 | 43d | 1 | 1.21mi |
| 3755 Medical Park Dr Austell, GA | 1.0–2.0 | 1.0–2.0 | 979 | $1,636 | $1.67 | 5d | 13 | 1.26mi |
| 3561 Ashley Station Dr SW #3561 Marietta, GA | 2.0 | 2.5 | 1160 | $1,500 | $1.29 | 43d | 1 | 1.33mi |
| 2347 Glencairn Ln SW Marietta, GA | 3.0 | 2.0 | 1486 | $1,831 | $1.23 | 5d | 1 | 1.34mi |
| 5128 Lakeview Ct Austell, GA | 2.0 | 1.5 | 1080 | $1,605 | $1.49 | 12d | 1 | 1.37mi |
| 3890 Floyd Rd Unit B1 Austell, GA | 2.0 | 2.5 | 1461 | $2,801 | $1.92 | 43d | 1 | 1.38mi |
| 3753 Austell Rd SW Unit B2 Austell, GA | 2.0 | 2.0 | 1094 | $2,279 | $2.08 | 2d | 1 | 1.39mi |
| 3753 Austell Rd SW Unit C1 Austell, GA | 3.0 | 2.0 | 1391 | $2,375 | $1.71 | 2d | 1 | 1.39mi |
| 3753 Austell Rd SW Unit A1 Austell, GA | 1.0 | 1.0 | 718 | $1,884 | $2.62 | 2d | 1 | 1.39mi |
| 3753 Austell Rd Austell, GA | 1.0–3.0 | 1.0–2.0 | 1110 | $2,199 | $1.98 | 1d | 89 | 1.39mi |
| 3890 Floyd Rd Unit B2 Austell, GA | 2.0 | 2.0 | 1094 | $2,393 | $2.19 | 43d | 1 | 1.43mi |
| 3890 Floyd Rd Unit 2201 Austell, GA | 2.0 | 2.0 | 1128 | $2,147 | $1.90 | 24d | 1 | 1.43mi |
| 3890 Floyd Rd Unit A4 Austell, GA | 1.0 | 1.0 | 853 | $1,961 | $2.30 | 3d | 1 | 1.43mi |
| 3510 Ashley Station Dr SW Marietta, GA | 3.0 | 2.5 | 1408 | $1,845 | $1.31 | 11d | 1 | 1.45mi |
| 2020 Annette Ln Austell, GA | 3.0 | 2.0 | 1452 | $1,900 | $1.31 | 24d | 1 | 1.45mi |
Listing history 28 events
-
2026-06-18days on market $150,000 Active 99 DOM
-
2026-06-17days on market $150,000 Active 98 DOM
-
2026-06-16days on market $150,000 Active 97 DOM
-
2026-06-15days on market $150,000 Active 96 DOM
-
2026-06-13days on market $150,000 Active 94 DOM
-
2026-06-13days on market $150,000 Active 93 DOM
-
2026-06-09days on market $150,000 Active 90 DOM
-
2026-06-08days on market $150,000 Active 89 DOM
-
2026-06-07days on market $150,000 Active 88 DOM
-
2026-06-04days on market $150,000 Active 85 DOM
-
2026-06-03days on market $150,000 Active 84 DOM
-
2026-06-02days on market $150,000 Active 83 DOM
-
2026-06-01days on market $150,000 Active 82 DOM
-
2026-05-31days on market $150,000 Active 81 DOM
-
2026-04-20price $150,000 418-char remark
Show marketing remark (418 chars)
Turnkey Investment Opportunity in Cobb County! Tenant-occupied 2-bedroom, 2.5-bath end-unit townhome in a high-demand rental area. This well-maintained property already generates steady rental income, making it an excellent addition to any portfolio. Recent updates include freshly painted exterior and newer carpet on the first floor, minimizing immediate maintenance needs. Additional photos available upon request.
-
2026-03-11$169,900 New 418-char remark
Show marketing remark (418 chars)
Turnkey Investment Opportunity in Cobb County! Tenant-occupied 2-bedroom, 2.5-bath end-unit townhome in a high-demand rental area. This well-maintained property already generates steady rental income, making it an excellent addition to any portfolio. Recent updates include freshly painted exterior and newer carpet on the first floor, minimizing immediate maintenance needs. Additional photos available upon request.
-
2026-03-11$169,900 Active 418-char remark
Show marketing remark (418 chars)
Turnkey Investment Opportunity in Cobb County! Tenant-occupied 2-bedroom, 2.5-bath end-unit townhome in a high-demand rental area. This well-maintained property already generates steady rental income, making it an excellent addition to any portfolio. Recent updates include freshly painted exterior and newer carpet on the first floor, minimizing immediate maintenance needs. Additional photos available upon request.
-
2026-03-10historical
-
2026-03-10historical
-
2025-11-04$180,000 New
-
2025-11-03historical
-
2025-10-08price $180,000
-
2025-10-08price $180,000
-
2025-10-02$185,000 Active
-
2025-10-02$185,000 New
-
1991-10-22soldstatus $48,243
-
1985-10-31soldstatus $53,000
ⓘ Source: listings_history table (triggers on properties + properties_extension) + one-shot
backfill from property_details.listing_events for pre-trigger history.
Tax reassessment forecast GA · Resets to sale price
- Current annual tax
- $1,833 · $153/mo
- Projected year-2 tax
- $1,833 · $153/mo
- Expected delta
- $0/yr ($0/mo · 0.0%)
ⓘ Screening estimate from a state-policy table — verify with the county assessor before closing.
Climate risk First Street
- Flood 1/10 Low FEMA zone X (unshaded) · 0% chance over 30 yrs
- Wildfire 2/10 Low
- Heat 5/10 Major 7 d/yr ≥103°F today · 18 d/yr by 30 yrs out
- Wind 4/10 Moderate 24% chance of damaging wind over 30 yrs
- Air quality 4/10 Moderate 4 unhealthy d/yr today · 5 by 30 yrs out
Nearby sold comps map
Loading sold comps map…
Walkable amenities ~0.75 mi
Loading nearby amenities…
Taxation est. · year 1
- Rental income
- $20,528
- − Mortgage interest
- −$8,402
- − Property taxes
- −$1,833
- − Insurance
- −$750
- − Repairs & maintenance
- −$1,642
- − Management
- −$1,642
- − Depreciation
- −$4,364
- Taxable income
- $1,895
- Est. tax owed @ 24.0%
- −$455
- After-tax cash flow
- $3,741/yr
For passive investors: Depreciation is non-cash, so a rental often shows a tax loss while cash-flowing — sheltering income. Rental losses are passive: they offset passive income freely, and up to $25,000/yr can offset ordinary (W-2) income if you actively participate and your MAGI is under $100k (phasing out to $0 by $150k); unused losses carry forward. On sale, claimed depreciation is recaptured at up to 25%, and gains may owe capital-gains tax (a 1031 exchange can defer both). Figures are a year-1 estimate at your 24.0% rate — not tax advice; consult a CPA.
Schools (NCES district)
- District
- Cobb County
- NCES district ID
- 1301290
- Math proficiency
- 39% ▼ -15.00%
- Reading proficiency
- 45% ▼ -10.00%
- Median HH income
- $68,845
- Composite
- 37.93/100
- National rank
- #4308
- State rank
- #25 of 174 in GA
Livability — Austell
- Score
- 67/100
- State rank
- #175
- US rank
- #11059
Category grades
Schools grade is shown separately in the Schools card above.
Census & demographics
- County
- Cobb County · 777,758 people
- City population
- 49,719
- Metro
- Atlanta-Sandy Springs-Alpharetta, GA
- Population (ZIP)
- 23,107
- Household income
- $68,881
- Rent vs Own
- Severe rent burden
- 907.0
Population outlook (Cobb County) Hauer SSP2
- Today (2025)
- 868,385 people
- By 2030
- 929,614 · +7.1%
- By 2040
- 1,047,533 · +20.6%
- By 2050
- 1,155,537 · +33.1%
- By 2075
- 1,405,030 · +61.8%
- By 2100
- 1,555,058 · +79.1%
Race, ethnicity, and origin ACS 2023
- Neighborhood character
- Diverse neighborhood (Simpson 0.62)
- Race & ethnicity
- Black 54% White 22% Hispanic / Latino 20% Two or more races 8% Asian 1%
- Hispanic origin (detail)
- Mexican 9% Puerto Rican 6%
- Common ancestry
- Italian 2% Hispanic 1% Romanian 1%
- Foreign-born
- 14% · Canada, Jamaica, Vietnam
- Languages at home
- 79% English-only · Spanish 16% Other Indo-European 1% French/Haitian/Cajun 1%
Political lean MEDSL · Cobb
- 2024 margin
- D (+14.9) · D 56.9% · R 42.0% · Other 1.1%
- 2008→2024 swing
- +24.3pp toward D · 2008: -9.4pp · 2024: 14.9pp
- All cycles
- 2024: D+14.9 2020: D+14.3 2016: D+2.1 2012: R+12.6 2008: R+9.4
Not yet ingested
- Civics
- —
Market trends
- HPI YoY
- ▼ -128.55%
- Current HPI
- 256.6988
- Rent YoY
- ▲ 1.30%
- Metro
- Atlanta-Sandy Springs-Alpharetta, GA
- State GDP YoY
- ▲ 2.66%
- F500 in state
- 28
Industry mix (Fortune 500 HQ in GA)
| Industry | F500 HQs | Revenue |
|---|---|---|
| Paper / Packaging | 2 | $29B |
|
||
| Retail | 1 | $160B |
|
||
| Transportation / Logistics | 1 | $91B |
|
||
| Airlines | 1 | $62B |
|
||
| Consumer Goods | 1 | $47B |
|
||
| Utilities | 1 | $25B |
|
||
Price history
+183.0% since first listed14 events — show timeline
- 2026-04-20 Price Changed $150,000 GAMLS
- 2026-04-20 Price Changed $150,000 FMLS
- 2026-03-11 Listed $169,900 FMLS
- 2026-03-11 Listed $169,900 GAMLS
- 2026-03-10 Listing Removed — GAMLS
- 2026-03-10 Listing Removed — FMLS
- 2025-11-04 Listed $180,000 GAMLS
- 2025-11-03 Listing Removed — GAMLS
- 2025-10-08 Price Changed $180,000 GAMLS
- 2025-10-08 Price Changed $180,000 FMLS
- 2025-10-02 Listed $185,000 GAMLS
- 2025-10-02 Listed $185,000 FMLS
- 1991-10-22 Sold (Public Records) $48,243 Public Records
- 1985-10-31 Sold (Public Records) $53,000 Public Records
Property tax history
+5.8%/yrLatest (2025): $1,833 · -0.1% YoY. Source: county tax records.
Cash-flow waterfall
monthlySold comps — $/sqft
last 12 mo · ≤1 miLoading sold comps…