2681 Cameron Park Dr #170 · Cameron Park, CA
Flood risk 1/10 · Minimal
- FEMA flood zone
- X (unshaded)
- Chance of flooding over 30 yrs
- 0.0%
- Est. flood insurance / yr
- $507 – $1,088
Fire risk 10/10 · Severe
- Est. fire insurance / yr
- $659 – $1,223
Heat risk 6/10 · Moderate
- Hot days now (above 100°F)
- 7 days/yr
- Hot days in 30 yrs
- 15 days/yr
Wind risk 1/10 · Minimal
- Chance of severe wind over 30 yrs
- —
Air-quality risk 10/10 · Severe
- Unhealthy air days now
- 26 days/yr
- Unhealthy air days in 30 yrs
- 31 days/yr
Risk factors via First Street. Map © Google.
Why this score? — see what drove the B+ grade
The composite is a weighted blend of 9 inputs, each scored 0–100. Each bar is that input's sub-score; the figure is the points it added to the 100-point composite (weight × sub-score).
- Cash flow +30.0/30.0
- ARV discount +15.0/15.0
- 1% rule +10.0/10.0
- DSCR +10.0/10.0
- Schools +6.0/10.0
- Rent growth +3.2/5.0
- Livability +2.8/5.0
- Condition / age +2.5/5.0
- Appreciation +0.0/10.0
$124,900
🖨 Deal sheet 📄 Offer letter ✓ Due diligence
Listing remarks
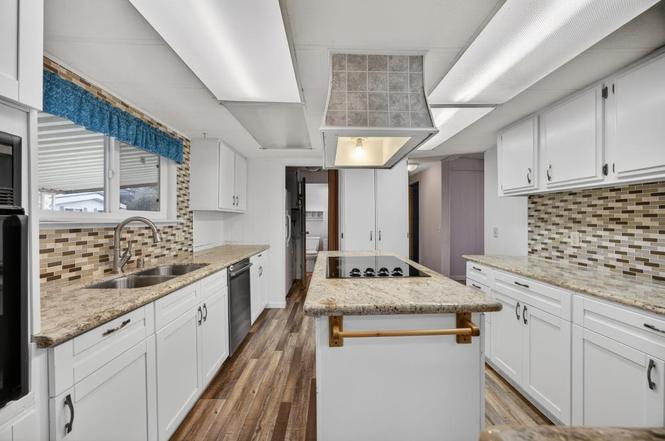
Huge price adjustment!! Welcome to this beautifully updated and move-in ready manufactured home, offering modern style, great natural light and a layout designed for comfort. The split-bedroom floor plan places the primary suite on one side of the home, offering privacy and a quiet retreat, while the two additional bedrooms and guest bath sit on the opposite side perfect for family, guests or a home office. The spacious kitchen features granite counters, a large island, updated cabinetry and plenty of room for cooking and gathering. It opens to a bright and generous living area with a wood burning stove that creates a warm, inviting atmosphere. Newer laminate flooring runs through the main
Key facts
- Spacious kitchen
- Large island
- Updated bathrooms
Tags
Property features AI
Finance
- Financial info: Not a land lease (land lease: No); There is a listed land lease amount of $850
- HOA & community: No HOA/association
Exterior
- Parking: Attached covered parking; Guest parking available
- Utilities: Public water; Public sewer; 220 volts available in laundry
- Home design: Manufactured home in a park; Double-wide unit; Built in 1974; Updated/remodeled; Located in a senior community
- Construction: Fleetwood make; Metal skirting; Other roof type
- Exterior features: Fenced yard; Backyard and front yard; Corner lot with irregular shape; Carport awning; Storage area and shed(s)
Interior
- Kitchen: Dishwasher; Electric cook top; Kitchen island
- Bedrooms: 3 bedrooms
- Flooring: Carpet; Laminate
- Bathrooms: 2 full bathrooms; Bathrooms include tub with shower over and separate shower stall(s)
- Heating & cooling: Central heating; Fireplace and wood stove heat; Central cooling; Ceiling fans
- Interior features: Updated/remodeled interior; Covered patio and porch; Great room living area; Formal dining area; Island in the kitchen; One fireplace with a wood stove insert in the living room
- Laundry & utility: Laundry room inside the home; 220V outlet in laundry area
Neighborhood map
What this means for you Summary
Snapshot
- This is a 3-bed/2.0-bath manufactured listed at $125k.
Deal economics
- At list price, monthly cash flow is $1k ($12k/yr) — positive.
- The deal already cash-flows at list — no discount required.
- Meets the 1% rule at list price ($2k rent vs $125k).
- Recommended offer: $110k (12.0% below list) — sets the bar for market timing.
- Cap rate 16.0% vs local median 2.7% in Cameron Park — top-decile yield for the area; either an underpriced asset or a hidden risk that comps aren't pricing in. Stress-test before assuming the spread holds.
Location & tenants
- Location reads 55/100 on livability (#832 in CA) — a working-class tenant base; expect higher turnover. Strengths: employment A+, housing B+; Watch: crime D+, amenities F, commute F.
- Rescue Union Elementary (suburban): math 61% / reading 69% proficiency, ranked #56 of 517 in CA (top 11%) — acceptable for families but not a draw, mixed tenant base, ~2y average lease; only 11% free/reduced lunch — higher-income household profile.
- Market conditions: Rents rising (+2.9%/yr); 236 active listings in the ZIP; 8 comparable units currently listed for rent nearby; rentals leasing fast (median 2d on market — plan ~1-2 weeks tenant-placement turnaround); high-income renter base; 437 units permitted in El Dorado County in 2024 (0 in 5+ unit buildings).
Forward outlook
- Local home prices are declining (-3.0%/yr); year-one equity from $864 of loan paydown is wiped out by about $4k of value loss. Plan a longer hold.
- El Dorado County population projected to shrink 3% by 2050 — rents likely to lag national; underwrite the cash flow, not the appreciation.
- At projected returns (-3.0% appreciation + 2.9% rent growth), your $35k cash investment doubles in ~4 years — after that, you're playing with house money.
Negotiation context
- It's been on market 195 days — a 12% lower offer ($110k) is reasonable based on typical stale-listing flexibility.
Risks & watch-outs
- Climate carrying-cost: severe wildfire risk; extreme-heat days projected 7→15/yr by 2055 (HVAC capex compounding) — expect insurance premiums to compound above CPI over the hold.
Questions for the listing agent
- It's been on market 195 days. Have you received any prior offers? Is the seller open to a 12% concession, seller financing, or rate buy-down credit?
- Built in 1974 — when were the roof, HVAC, electrical panel, plumbing, and water heater last replaced?
- Why hasn't it sold? Are there any deal-killer items the seller is aware of (foundation, flood, title, zoning, code violations)?
- Is there a deadline driving the sale (1031 exchange, divorce, estate, relocation)? That informs how much negotiation room exists.
- Schools are B-rated — typically a magnet for longer-tenancy family renters. What's the average tenant stay here, and is there a school-zone premium baked into asking?
- Crime grade is D in this area — have there been break-ins, vandalism, or insurance claims at this property in the last 3 years? What carrier currently insures it and at what premium?
- What's the average days-on-market for RENTAL listings here right now (not sales)? A rising rental-DOM trend means longer vacancies and softer asking-rent achievability than the comps imply.
- What's the recent tenant-quality profile in this submarket — average credit score on applications, eviction rate, late-payment / NSF rate, and stable-employment percentage? A property-management company in the area should have these aggregated.
- How much new for-sale + rental construction is in the pipeline within 1–3 miles? Heavy new supply typically softens prices + rents 12–24 months out; constrained supply supports both.
Investment metrics
- 1% rule
- 1.89% ✓
- Cap rate
- 15.96%
- Cash-on-cash
- 34.52%
- DSCR
- 2.54
- GRM
- 4.4
CMA / ARV
- ARV (on-the-fly)
- $188,640
- Comps found
- 11
Show comp detail 11 sales within ~0.75 mi
| Address | Dist | Beds/Ba | Sqft | Sold | Price | $/sf | Match |
|---|---|---|---|---|---|---|---|
| 2681 Cameron Park Dr #91 | 0.12mi | 2/2.0 (-1) | 1,440 (0%) | 6mo | $207,500 | $144 | 85 |
| 2681 Cameron Park Dr #107 | 0.07mi | 2/2.0 (-1) | 1,440 (0%) | 15mo | $285,000 | $198 | 79 |
| 2681 Cameron Park Dr #17 | 0.02mi | 2/2.0 (-1) | 1,440 (0%) | 19mo | $188,000 | $131 | 79 |
| 2681 Cameron Park Dr #64 | 0.12mi | 3/2.0 | 1,352 (-6%) | 9mo | $160,000 | $118 | 76 |
| 2681 Cameron Park Dr #5 | 0.13mi | 2/2.0 (-1) | 1,440 (0%) | 15mo | $140,000 | $97 | 76 |
| 2681 Cameron Park Dr #155 | 0.12mi | 2/2.0 (-1) | 1,344 (-7%) | 4mo | $320,000 | $238 | 75 |
| 2681 Cameron Park Dr #37 | 0.14mi | 3/2.0 | 1,440 (0%) | 23mo | $160,000 | $111 | 74 |
| 2681 Cameron Park Dr #139 | 0.16mi | 2/2.0 (-1) | 1,440 (0%) | 16mo | $185,000 | $128 | 74 |
| 2681 Cameron Park Dr #21 | 0.12mi | 2/2.0 (-1) | 1,440 (0%) | 22mo | $250,000 | $174 | 72 |
| 2681 Cameron Park Dr #156 | 0.11mi | 3/2.0 | 1,610 (+12%) | 12mo | $270,000 | $168 | 66 |
| 2681 Cameron Park Dr #117 | 0.09mi | 2/2.0 (-1) | 1,648 (+14%) | 22mo | $205,000 | $124 | 48 |
Match score weights: distance 35% · size 25% · config 20% · recency 20%. Top-matched comps best support the ARV.
Projected returns pro-forma
-3.0% appreciation · 2.86% rent growth · sell at horizon
- IRR
- 29.8%
- Equity multiple
- 2.24×
- Total profit
- $43,531
- Equity at exit
- $18,623
- IRR
- 37.0%
- Equity multiple
- 4.41×
- Total profit
- $119,187
- Equity at exit
- $10,799
Cash invested: $34,972 (down + closing). Projections, not guarantees.
Landlord ↔ Tenant lean methodology
- Overall (STATE)
- 18 Strongly Tenant-Friendly
- State California
- 18 Strongly Tenant-Friendly · D+13
- County
- — inherits STATE
- City
- — inherits STATE
ZIP-level market 95682
- Rents YoY
- 2.9%
- Active inventory
- 236
- Price-to-rent
- 4.4×
Monthly cashflow live
- Estimated rent
- $2,366 high interval (Pro) →
- Mortgage (P&I)
- −$655
- Tax est. 1.5%
- −$156 /mo · $1,874/yr
- Insurance
- −$52
- HOA
- −$0
- Vacancy / Maint / Mgmt
- −$497
- Net cashflow
- $1,006
Break-even live
UW: 25.0% down · 7.5% · 30yr · 1.5% tax · 5.0% vac · 8.0% maint · 8.0% mgmt
Financing live
Cash to close
- Down payment
- $31,225
- Closing costs
- $3,747
- Reserves months
- —
- Total cash needed
- —
Loan-product check · same deal, 3 products live
Conventional
25% down · 7.5% · 30yr
- Down + closing
- —
- Monthly P&I
- —
- Monthly cashflow
- —
- DSCR
- —
- Eligible?
- —
Personal DTI + credit; lowest rate.
DSCR
20% down · 8.5% · 30yr
- Down + closing
- —
- Monthly P&I
- —
- Monthly cashflow
- —
- DSCR
- —
- Eligible?
- —
No personal income docs; deal must DSCR.
Hard money
10% down · 12.0% · 12mo
- Down + closing
- —
- Monthly P&I
- —
- Monthly cashflow
- —
- DSCR
- —
- Eligible?
- —
Short-term bridge; refi at stabilization.
Rent comps 8 comps
| Address | Beds | Baths | Sqft | Rent | $/sqft | DOM | Units | Dist |
|---|---|---|---|---|---|---|---|---|
| 2641 La Crescenta Dr Unit 02 Cameron Park, CA | 2.0 | 1.5 | 1150 | $1,950 | $1.70 | 1d | 1 | 0.23mi |
| 3397 Cimmarron Ct #4 Cameron Park, CA | 2.0 | 1.5 | 912 | $1,695 | $1.86 | 1d | 1 | 0.25mi |
| 2545 Chesapeake Bay Cir Cameron Park, CA | 3.0 | 2.5 | 1358 | $2,700 | $1.99 | 1d | 1 | 0.27mi |
| 3337 La Canada Dr Unit 3339 A Cameron Park, CA | 2.0 | 1.5 | 875 | $1,925 | $2.20 | 7d | 1 | 0.34mi |
| 3261 La Canada Dr #1 Cameron Park, CA | 2.0 | 1.5 | 900 | $1,600 | $1.78 | 14d | 1 | 0.52mi |
| 2640 Cambridge Rd Cameron Park, CA | 2.0 | 2.0 | 966 | $2,432 | $2.52 | 1d | 6 | 0.68mi |
| 2361 Bass Lake Rd Apt 1221 Cameron Park, CA | 2.0 | 2.0 | 877 | $1,632 | $1.86 | 1d | 1 | 0.83mi |
| 3104 Cambridge Rd Unit 4C Cameron Park, CA | 2.0 | 2.0 | 1005 | $2,000 | $1.99 | 1d | 1 | 1.06mi |
Listing history 12 events
-
2026-06-17status $124,900 Pending 195 DOM
-
2026-06-16days on market $124,900 Active 195 DOM
-
2026-06-15days on market $124,900 Active 194 DOM
-
2026-06-13days on market $124,900 Active 192 DOM
-
2026-06-13days on market $124,900 Active 191 DOM
-
2026-06-09days on market $124,900 Active 188 DOM
-
2026-06-08days on market $124,900 Active 187 DOM
-
2026-06-07days on market $124,900 Active 186 DOM
-
2026-06-03days on market $124,900 Active 182 DOM
-
2026-06-02days on market $124,900 Active 181 DOM
-
2026-06-01days on market $124,900 Active 180 DOM
-
2026-05-31days on market $124,900 Active 179 DOM
ⓘ Source: listings_history table (triggers on properties + properties_extension) + one-shot
backfill from property_details.listing_events for pre-trigger history.
Climate risk First Street
- Flood 1/10 Low FEMA zone X (unshaded) · 0% chance over 30 yrs
- Wildfire 10/10 Extreme
- Heat 6/10 Major 7 d/yr ≥100°F today · 15 d/yr by 30 yrs out
- Wind 1/10 Low
- Air quality 10/10 Extreme 26 unhealthy d/yr today · 31 by 30 yrs out
Nearby sold comps map
Loading sold comps map…
Walkable amenities ~0.75 mi
Loading nearby amenities…
Taxation est. · year 1
- Rental income
- $28,391
- − Mortgage interest
- −$6,996
- − Property taxes
- −$1,874
- − Insurance
- −$624
- − Repairs & maintenance
- −$2,271
- − Management
- −$2,271
- − Depreciation
- −$3,633
- Taxable income
- $10,721
- Est. tax owed @ 24.0%
- −$2,573
- After-tax cash flow
- $9,498/yr
For passive investors: Depreciation is non-cash, so a rental often shows a tax loss while cash-flowing — sheltering income. Rental losses are passive: they offset passive income freely, and up to $25,000/yr can offset ordinary (W-2) income if you actively participate and your MAGI is under $100k (phasing out to $0 by $150k); unused losses carry forward. On sale, claimed depreciation is recaptured at up to 25%, and gains may owe capital-gains tax (a 1031 exchange can defer both). Figures are a year-1 estimate at your 24.0% rate — not tax advice; consult a CPA.
Schools (NCES district)
- District
- Rescue Union Elementary
- NCES district ID
- 0632310
- Math proficiency
- 61% ▼ -4.00%
- Reading proficiency
- 69% ▼ -5.00%
- Median HH income
- $98,351
- Composite
- 59.82/100
- National rank
- #895
- State rank
- #56 of 517 in CA
Livability — Cameron Park
- Score
- 55/100
- State rank
- #832
- US rank
- #23166
Category grades
Schools grade is shown separately in the Schools card above.
Census & demographics
- Census place
- Cameron Park, CA
- County
- El Dorado County · 144,198 people
- Metro
- Sacramento-Roseville-Folsom, CA
- Population (ZIP)
- 30,065
- Household income
- $122,436
- Rent vs Own
- Severe rent burden
- 634.0
Population outlook (El Dorado County) Hauer SSP2
- Today (2025)
- 191,666 people
- By 2030
- 193,662 · +1.0%
- By 2040
- 192,583 · +0.5%
- By 2050
- 185,904 · -3.0%
- By 2075
- 169,543 · -11.5%
- By 2100
- 139,623 · -27.2%
Race, ethnicity, and origin ACS 2023
- Neighborhood character
- Predominantly White (80%)
- Race & ethnicity
- White 80% Hispanic / Latino 13% Two or more races 8% Asian 2%
- Hispanic origin (detail)
- Mexican 9%
- Common ancestry
- Lithuanian 3% Portuguese 3% Italian 3%
- Foreign-born
- 5% · Canada, China
- Languages at home
- 93% English-only · Spanish 3% German/W. Germanic 1% Chinese 1%
Political lean MEDSL · El Dorado
- 2024 margin
- R (+12.0) · D 42.6% · R 54.6% · Other 2.8%
- 2008→2024 swing
- -1.5pp toward R · 2008: -10.5pp · 2024: -12.0pp
- All cycles
- 2024: R+12.0 2020: R+8.8 2016: R+13.9 2012: R+18.2 2008: R+10.5
Not yet ingested
- Civics
- —
Market trends
- HPI YoY
- ▼ -417.68%
- Current HPI
- 279.3817
- Rent YoY
- ▲ 2.86%
- Metro
- Sacramento-Roseville-Folsom, CA
- State GDP YoY
- ▲ 3.21%
- F500 in state
- 116
Industry mix (Fortune 500 HQ in CA)
| Industry | F500 HQs | Revenue |
|---|---|---|
| Technology | 27 | $1,492B |
|
||
| Financial Services | 3 | $174B |
|
||
| Retail | 3 | $44B |
|
||
| Insurance | 3 | $26B |
|
||
| Media / Entertainment | 2 | $115B |
|
||
| Pharmaceuticals / Biotech | 2 | $62B |
|
||
Cash-flow waterfall
monthlySold comps — $/sqft
last 12 mo · ≤1 miLoading sold comps…