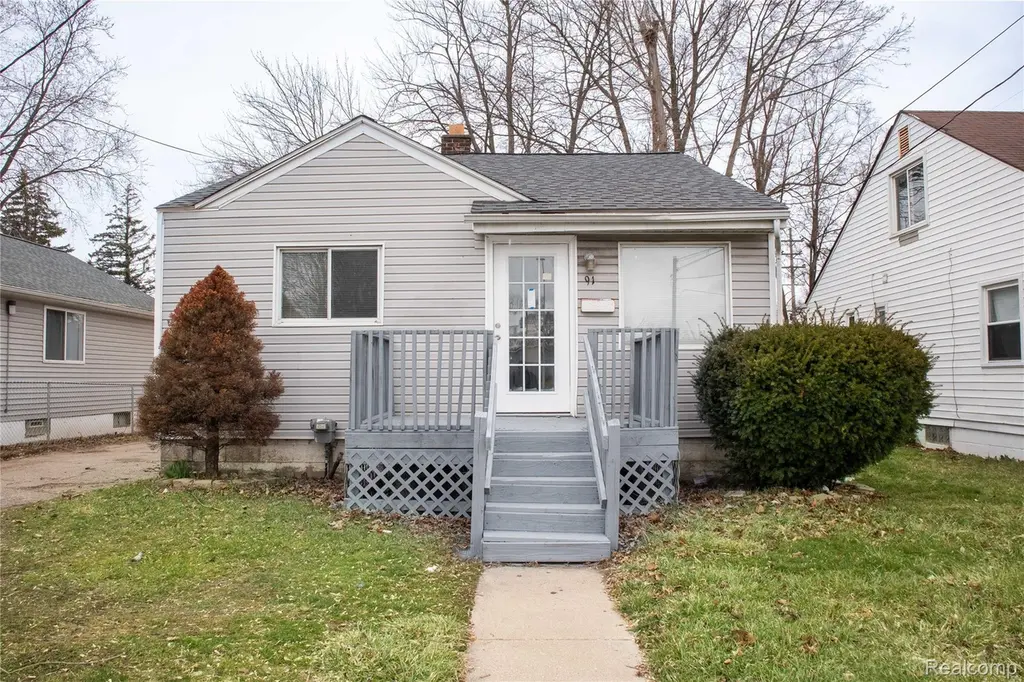
91 Martin Luther King Jr Blvd N · Pontiac, MI
Flood risk 1/10 · Minimal
- FEMA flood zone
- X (unshaded)
- Chance of flooding over 30 yrs
- 0.0%
- Est. flood insurance / yr
- $473 – $860
Fire risk 1/10 · Minimal
- Est. fire insurance / yr
- $784 – $1,456
Heat risk 2/10 · Minimal
- Hot days now (above 96°F)
- 7 days/yr
- Hot days in 30 yrs
- 15 days/yr
Wind risk 2/10 · Minimal
- Chance of severe wind over 30 yrs
- —
Air-quality risk 3/10 · Minor
- Unhealthy air days now
- 2 days/yr
- Unhealthy air days in 30 yrs
- 4 days/yr
Risk factors via First Street. Map © Google.
Why this score? — see what drove the F grade
The composite is a weighted blend of 9 inputs, each scored 0–100. Each bar is that input's sub-score; the figure is the points it added to the 100-point composite (weight × sub-score).
- Cash flow +15.1/30.0
- DSCR +4.6/10.0
- 1% rule +3.2/10.0
- Livability +3.2/5.0
- Rent growth +2.5/5.0
- Condition / age +2.5/5.0
- Schools +1.0/10.0
- ARV discount +0.0/15.0
- Appreciation +0.0/10.0
$169,900
🖨 Deal sheet (PDF) 📄 Offer letter ✓ Due diligence
Listing remarks MLS
LAND CONTRACT AVAILABLE. Beautifully renovated home in Pontiac featuring 2 bedrooms and 1 full bath on the main level, plus an additional 2 bedrooms and 1 full bath in the finished basement. This home has been completely updated with new flooring, recessed lighting throughout, and a stunning electric fireplace with floor-to-ceiling tile feature wall. The brand new kitchen offers modern cabinetry, quartz countertops, and new appliances. Bathrooms are updated with ceramic tile and stylish stand-up showers. The finished basement features epoxy flooring and a painted ceiling, adding extra living space and flexibility. Enjoy the large backyard, perfect for outdoor activities. Conveniently located near I-75 and M-59 for easy commuting.
Key facts
- Quartz countertops
- Renovated home
- Modern cabinetry
Tags
Property features AI
Exterior
- Parking: No garage
- Utilities: Public sewer; Other water source
- Home design: Single-family residence; One level; Ground-level entry; Aluminum siding
- Construction: Built with aluminum siding; Brick/mortar foundation
- Exterior features: Paved road access; Lot approximately 0.11 acres (44 x 109.47)
Interior
- Kitchen: Gas cooktop; Disposal; Free-standing refrigerator
- Bathrooms: 2 full bathrooms
- Heating & cooling: Forced air heating (natural gas); No central cooling
- Interior features: Finished basement; Fireplace in the living room; 6 total rooms
- Laundry & utility: Washer; Dryer
Neighborhood map
What this means for you Summary
Snapshot
- This is a 2-bed/1.0-bath single-family listed at $170k.
Deal economics
- At list price, monthly cash flow is $56 ($666/yr) — positive.
- The deal already cash-flows at list — no discount required.
- To meet the 1% rule (rent ≥ 1% of price), the offer needs to be $139k (18.4% below list).
- Recommended offer: $139k (18.4% below list) — sets the bar for 1% rule.
- Cap rate 6.7% vs local median 5.4% in Pontiac — meaningfully above typical; check what's discounted (condition, days-on-market, listing class) to confirm the premium yield is real.
Location & tenants
- Location reads 64/100 on livability (#499 in MI) — a middle-class / working-renter tenant base. Strengths: commute A+, cost of living A+, housing A+; Watch: health & safety D, crime F, amenities F.
- Pontiac City School District (urban): math 8% / reading 17% proficiency, ranked #514 of 540 in MI (top 95%) — low school quality limits family demand, transient renter base, plan for 1-2y turnover; 81% free/reduced lunch — lower-income household profile, screen leases tightly.
- Zoned schools: Whitman Elementary School (math 8% / reading 8%, grade F, #1,300 of 1,397 statewide, top 94%, 601 students, 81% FRL); Pontiac Middle School (math 8% / reading 23%, grade F, #450 of 493 statewide, top 91%, 729 students, 81% FRL); Pontiac High School (math 12% / reading 27%, grade F, #622 of 713 statewide, top 88%, 935 students, 75% FRL) — zoned schools at 79% FRL track the district average.
- Market conditions: 90 active listings in the ZIP; 11 comparable units currently listed for rent nearby; rentals at typical pace (median 26d on market — plan ~3-4 weeks tenant-placement turnaround); 2,614 units permitted in Oakland County in 2024 (721 in 5+ unit buildings).
Forward outlook
- Local home prices are declining (-3.0%/yr); year-one equity from $1k of loan paydown is wiped out by about $5k of value loss. Plan a longer hold.
- Oakland County population projected at +10% by 2050 — modest demand growth; plan on rents tracking national, not racing it.
Negotiation context
- It's been on market 19 days — a 2% lower offer ($167k) is reasonable based on typical stale-listing flexibility.
- 6 sale attempts with the ask held roughly flat each time — persistent listings suggest the price (not the market) is what's stuck; bring a comps-based counter.
- Current owner paid $45k; list at $170k implies a 278% gain — meaningful room to come down on a strong offer.
Risks & watch-outs
- Watch-outs: built in 1951 — expect roof / HVAC / electrical / plumbing capex.
Questions for the listing agent
- Built in 1951 — when were the roof, HVAC, electrical panel, plumbing, and water heater last replaced?
- Is there a deadline driving the sale (1031 exchange, divorce, estate, relocation)? That informs how much negotiation room exists.
- Schools are F-rated, which usually means shorter tenancies and higher turnover. Who's the typical renter profile here, and what's been the actual vacancy rate?
- Crime grade is F in this area — have there been break-ins, vandalism, or insurance claims at this property in the last 3 years? What carrier currently insures it and at what premium?
- The area grade is low — what's the realistic commute time and amenity access for the typical tenant pool here? Any planned neighborhood developments (good or bad) we should know about?
- What's the average days-on-market for RENTAL listings here right now (not sales)? A rising rental-DOM trend means longer vacancies and softer asking-rent achievability than the comps imply.
- What's the recent tenant-quality profile in this submarket — average credit score on applications, eviction rate, late-payment / NSF rate, and stable-employment percentage? A property-management company in the area should have these aggregated.
- How much new for-sale + rental construction is in the pipeline within 1–3 miles? Heavy new supply typically softens prices + rents 12–24 months out; constrained supply supports both.
Investment metrics
- 1% rule
- 0.82% ✗
- Cap rate
- 6.68%
- Cash-on-cash
- 1.40%
- DSCR
- 1.06
- GRM
- 10.2
CMA / ARV
- ARV (median comp)
- $140,646
- List price
- $169,900
- Delta
- 33.60%
- Verdict
- OVERPRICED
- Comps
- 20 within 1.0 mi
Show comp detail 11 sales within ~0.75 mi
| Address | Dist | Beds/Ba | Sqft | Sold | Price | $/sf | Match |
|---|---|---|---|---|---|---|---|
| 116 Raymond St | 0.26mi | 3/1.5 (+1) | 1,511 (-8%) | 9mo | $225,000 | $149 | 59 |
| 32 S Marshall St | 0.25mi | 3/1.0 (+1) | 1,491 (-10%) | 11mo | $81,000 | $54 | 58 |
| 61 N Tasmania St | 0.38mi | 3/1.5 (+1) | 1,800 (+9%) | 7mo | $122,000 | $68 | 54 |
| 15 N Edith St NE | 0.21mi | 2/2.5 | 1,755 (+6%) | 24mo | $165,000 | $94 | 54 |
| 23 Martin Luther King JR Blvd N | 0.13mi | 3/1.5 (+1) | 1,412 (-14%) | 13mo | $205,000 | $145 | 52 |
| 451 Martin Luther King Jr Blvd N | 0.67mi | 3/1.5 (+1) | 1,677 (+2%) | 10mo | $170,000 | $101 | 50 |
| 228 S Marshall St | 0.62mi | 3/1.0 (+1) | 1,606 (-3%) | 16mo | $135,500 | $84 | 48 |
| 103 N Roselawn St | 0.48mi | 3/2.0 (+1) | 1,487 (-10%) | 10mo | $105,000 | $71 | 44 |
| 127 Victory Dr | 0.72mi | 3/2.0 (+1) | 1,610 (-2%) | 13mo | $153,000 | $95 | 43 |
| 434 Maxwell Rd | 0.68mi | 3/1.0 (+1) | 1,500 (-9%) | 21mo | $150,000 | $100 | 31 |
| 427 Valencia Dr | 0.66mi | 3/1.5 (+1) | 1,449 (-12%) | 16mo | $185,000 | $128 | 29 |
Match score weights: distance 35% · size 25% · config 20% · recency 20%. Top-matched comps best support the ARV.
Projected returns pro-forma
-3.0% appreciation · 3.0% rent growth · sell at horizon
- IRR
- -14.1%
- Equity multiple
- 0.49×
- Total profit
- $-24,057
- Equity at exit
- $25,333
- IRR
- -5.4%
- Equity multiple
- 0.65×
- Total profit
- $-16,645
- Equity at exit
- $14,690
Cash invested: $47,572 (down + closing). Projections, not guarantees.
Landlord ↔ Tenant lean methodology
- Overall (STATE)
- 62 Landlord-Friendly
- State Michigan
- 62 Landlord-Friendly · EVEN
- County
- — inherits STATE
- City
- — inherits STATE
ZIP-level market 48342
- Home prices YoY
- -33.8%
- Active inventory
- 90
- Price-to-rent
- 10.2×
Monthly cashflow live
- Estimated rent
- $1,387 high interval (Pro) →
- Mortgage (P&I)
- −$891
- Tax from tax record
- −$79 /mo · $943/yr
- Insurance
- −$71
- HOA
- −$0
- Vacancy / Maint / Mgmt
- −$291
- Net cashflow
- $56
Break-even live
Sensitivity live
| Price | -10% $152 | -5% $104 | +0% $56 | +5% $7 | +10% $-41 |
|---|---|---|---|---|---|
| Rent | -10% $-54 | -5% $1 | +0% $56 | +5% $110 | +10% $165 |
| Rate | -1.0pp $141 | -0.5pp $99 | base $56 | +0.5pp $11 | +1.0pp $-33 |
UW: 25.0% down · 7.5% · 30yr · 1.5% tax · 5.0% vac · 8.0% maint · 8.0% mgmt
Financing live
Cash to close
- Down payment
- $42,475
- Closing costs
- $5,097
- Reserves months
- —
- Total cash needed
- —
Loan-product check · same deal, 3 products live
Conventional
25% down · 7.5% · 30yr
- Down + closing
- —
- Monthly P&I
- —
- Monthly cashflow
- —
- DSCR
- —
- Eligible?
- —
Personal DTI + credit; lowest rate.
DSCR
20% down · 8.5% · 30yr
- Down + closing
- —
- Monthly P&I
- —
- Monthly cashflow
- —
- DSCR
- —
- Eligible?
- —
No personal income docs; deal must DSCR.
Hard money
10% down · 12.0% · 12mo
- Down + closing
- —
- Monthly P&I
- —
- Monthly cashflow
- —
- DSCR
- —
- Eligible?
- —
Short-term bridge; refi at stabilization.
Rent comps 11 comps
| Address | Beds | Baths | Sqft | Rent | $/sqft | DOM | Units | Dist |
|---|---|---|---|---|---|---|---|---|
| 38 N Shirley St Pontiac, MI | 3.0 | 1.0 | 1174 | $1,425 | $1.21 | 45d | 1 | 0.44mi |
| 128 S Edith St Pontiac, MI | 2.0–3.0 | 2.0 | 1155 | $1,384 | $1.20 | 19d | 1 | 0.50mi |
| 16 Victory Dr Unit 18 Pontiac, MI | 2.0 | 1.0 | 1114 | $1,150 | $1.03 | 26d | 1 | 0.52mi |
| 16 Victory Dr Unit 18 Pontiac, MI | 2.0 | 1.0 | 1118 | $1,150 | $1.03 | 45d | 1 | 0.52mi |
| 188 Vernon Dr Pontiac, MI | 3.0 | 1.0 | 1100 | $1,500 | $1.36 | 26d | 1 | 0.83mi |
| 49 Oakhill St Pontiac, MI | 3.0 | 1.0 | 1200 | $1,575 | $1.31 | 26d | 1 | 0.99mi |
| 264 Nelson St Pontiac, MI | 3.0 | 1.0 | 1478 | $1,590 | $1.08 | 45d | 1 | 1.14mi |
| 90 Marquette St Pontiac, MI | 3.0 | 1.0 | 1886 | $1,800 | $0.95 | 45d | 1 | 1.26mi |
| 489 Central Ave Pontiac, MI | 2.0 | 1.0 | 1140 | $1,195 | $1.05 | 7d | 1 | 1.32mi |
| 442 Central Ave Unit 1 Pontiac, MI | 2.0 | 1.0 | 1500 | $1,500 | $1.00 | 7d | 1 | 1.35mi |
| 442 Central Ave Pontiac, MI | 2.0 | 1.0 | 1500 | $1,250 | $0.83 | 18d | 1 | 1.35mi |
Listing history 31 events
-
2026-06-21days on market $169,900 Active 19 DOM
-
2026-06-18days on market $169,900 Active 16 DOM
-
2026-06-17days on market $169,900 Active 15 DOM
-
2026-06-16days on market $169,900 Active 14 DOM
-
2026-06-15days on market $169,900 Active 13 DOM
-
2026-06-13days on market $169,900 Active 11 DOM
-
2026-06-13days on market $169,900 Active 10 DOM
-
2026-06-09days on market $169,900 Active 7 DOM
-
2026-06-08days on market $169,900 Active 6 DOM
-
2026-06-07days on market $169,900 Active 5 DOM
-
2026-06-04days on market $169,900 Active 2 DOM
-
2026-06-02pricedays on market $169,900 Active 1 DOM
Show marketing remark (739 chars)
LAND CONTRACT AVAILABLE. Beautifully renovated home in Pontiac featuring 2 bedrooms and 1 full bath on the main level, plus an additional 2 bedrooms and 1 full bath in the finished basement. This home has been completely updated with new flooring, recessed lighting throughout, and a stunning electric fireplace with floor-to-ceiling tile feature wall. The brand new kitchen offers modern cabinetry, quartz countertops, and new appliances. Bathrooms are updated with ceramic tile and stylish stand-up showers. The finished basement features epoxy flooring and a painted ceiling, adding extra living space and flexibility. Enjoy the large backyard, perfect for outdoor activities. Conveniently located near I-75 and M-59 for easy commuting.
-
2026-06-01days on market $187,900 Active 61 DOM
-
2026-05-31days on market $187,900 Active 60 DOM
-
2026-05-16price $187,900 714-char remark
-
2026-05-16price $187,900 714-char remark
-
2026-05-02price $188,900 714-char remark
-
2026-05-01price $188,900 714-char remark
-
2026-04-20price $189,900 714-char remark
-
2026-04-20price $189,900 714-char remark
-
2026-04-16price $197,900 714-char remark
-
2026-04-15price $197,900 714-char remark
-
2026-04-01historical
-
2026-04-01historical
-
2026-03-26$199,900 Active
-
2026-03-26$199,900 Active
-
2026-03-24historical
-
2026-03-24$199,900 Active 714-char remark
-
2026-03-24$199,900 Active 714-char remark
-
2025-12-08soldstatus $45,000
-
2005-01-13soldstatus $67,000
ⓘ Source: listings_history table (triggers on properties + properties_extension) + one-shot
backfill from property_details.listing_events for pre-trigger history.
Tax reassessment forecast MI · Partial reset (capped growth)
- Current annual tax
- $943 · $79/mo
- Projected year-2 tax
- $1,780 · $148/mo
- Expected delta
- +$837/yr (+$70/mo · 88.8%)
ⓘ Screening estimate from a state-policy table — verify with the county assessor before closing.
Climate risk First Street
- Flood 1/10 Low FEMA zone X (unshaded) · 0% chance over 30 yrs
- Wildfire 1/10 Low
- Heat 2/10 Low 7 d/yr ≥96°F today · 15 d/yr by 30 yrs out
- Wind 2/10 Low
- Air quality 3/10 Moderate 2 unhealthy d/yr today · 4 by 30 yrs out
Nearby sold comps map
Loading sold comps map…
Walkable amenities ~0.75 mi
Loading nearby amenities…
Taxation est. · year 1
- Rental income
- $16,645
- − Mortgage interest
- −$9,517
- − Property taxes
- −$943
- − Insurance
- −$850
- − Repairs & maintenance
- −$1,332
- − Management
- −$1,332
- − Depreciation
- −$4,943
- Taxable loss
- −$2,270
- Est. tax savings @ 24.0%
- +$545
- After-tax cash flow
- $1,211/yr
For passive investors: Depreciation is non-cash, so a rental often shows a tax loss while cash-flowing — sheltering income. Rental losses are passive: they offset passive income freely, and up to $25,000/yr can offset ordinary (W-2) income if you actively participate and your MAGI is under $100k (phasing out to $0 by $150k); unused losses carry forward. On sale, claimed depreciation is recaptured at up to 25%, and gains may owe capital-gains tax (a 1031 exchange can defer both). Figures are a year-1 estimate at your 24.0% rate — not tax advice; consult a CPA.
Schools (NCES district)
- District
- Pontiac City School District
- NCES district ID
- 2628740
- Math proficiency
- 8% ▼ -5.00%
- Reading proficiency
- 17% ▼ -3.00%
- Median HH income
- $33,888
- Composite
- 10.12/100
- National rank
- #9802
- State rank
- #514 of 540 in MI
Livability — Pontiac
- Score
- 64/100
- State rank
- #499
- US rank
- #14703
Category grades
Schools grade is shown separately in the Schools card above.
Census & demographics
- Census place
- Pontiac, MI
- City population
- 44,593
- Population (ZIP)
- 17,227
Population outlook (Oakland County) Hauer SSP2
- Today (2025)
- 1,335,747 people
- By 2030
- 1,375,100 · +2.9%
- By 2040
- 1,435,385 · +7.5%
- By 2050
- 1,469,250 · +10.0%
- By 2075
- 1,531,946 · +14.7%
- By 2100
- 1,450,485 · +8.6%
Race, ethnicity, and origin ACS 2023
- Neighborhood character
- Diverse neighborhood (Simpson 0.62)
- Race & ethnicity
- Black 57% Hispanic / Latino 19% White 13% Two or more races 13% Asian 4%
- Hispanic origin (detail)
- Mexican 11% Puerto Rican 2%
- Common ancestry
- Romanian 1% Lithuanian 1% Italian 1%
- Foreign-born
- 10% · Canada, Vietnam
- Languages at home
- 79% English-only · Spanish 15% Other Asian/Pacific 4% Other Indo-European 1%
Political lean MEDSL · Oakland
- 2024 margin
- D (+10.6) · D 54.4% · R 43.8% · Other 1.9%
- 2008→2024 swing
- -3.9pp toward R · 2008: 14.5pp · 2024: 10.6pp
- All cycles
- 2024: D+10.6 2020: D+14.1 2016: D+8.1 2012: D+8.1 2008: D+14.5
Not yet ingested
- Civics
- —
Market trends
- HPI YoY
- ▼ -109.18%
- Current HPI
- 214.3258
- Rent YoY
- —
- Metro
- —
- State GDP YoY
- ▲ 1.37%
- F500 in state
- 28
Industry mix (Fortune 500 HQ in MI)
| Industry | F500 HQs | Revenue |
|---|---|---|
| Automotive Parts | 3 | $48B |
|
||
| Automotive | 2 | $372B |
|
||
| Chemicals | 1 | $45B |
|
||
| Automotive Retail | 1 | $29B |
|
||
| Healthcare / Medical Devices | 1 | $23B |
|
||
| Automotive Technology | 1 | $20B |
|
||
Price history
+153.6% since first listed21 events — show timeline
- 2026-06-02 Listed $169,900 REALCOMP
- 2026-06-02 Listed $169,900 MiRealSource-MiMLS
- 2026-06-01 Listing Removed — MiRealSource-MiMLS
- 2026-06-01 Listing Removed — REALCOMP
- 2026-05-16 Price Changed $187,900 MiRealSource-MiMLS
- 2026-05-16 Price Changed $187,900 REALCOMP
- 2026-05-02 Price Changed $188,900 MiRealSource-MiMLS
- 2026-05-01 Price Changed $188,900 REALCOMP
- 2026-04-20 Price Changed $189,900 MiRealSource-MiMLS
- 2026-04-20 Price Changed $189,900 REALCOMP
- 2026-04-16 Price Changed $197,900 MiRealSource-MiMLS
- 2026-04-15 Price Changed $197,900 REALCOMP
- 2026-04-01 Listing Removed — MiRealSource-MiMLS
- 2026-04-01 Listing Removed — REALCOMP
- 2026-03-26 Listed $199,900 MiRealSource-MiMLS
- 2026-03-26 Listed $199,900 REALCOMP
- 2026-03-24 Coming Soon — MiRealSource-MiMLS
- 2026-03-24 Listed $199,900 MiRealSource-MiMLS
- 2026-03-24 Listed $199,900 REALCOMP
- 2025-12-08 Sold (Public Records) $45,000 Public Records
- 2005-01-13 Sold (Public Records) $67,000 Public Records
Property tax history
+1.9%/yrLatest (2025): $943 · +2.7% YoY. Source: county tax records.
Cash-flow waterfall
monthlySold comps — $/sqft
last 12 mo · ≤1 miLoading sold comps…