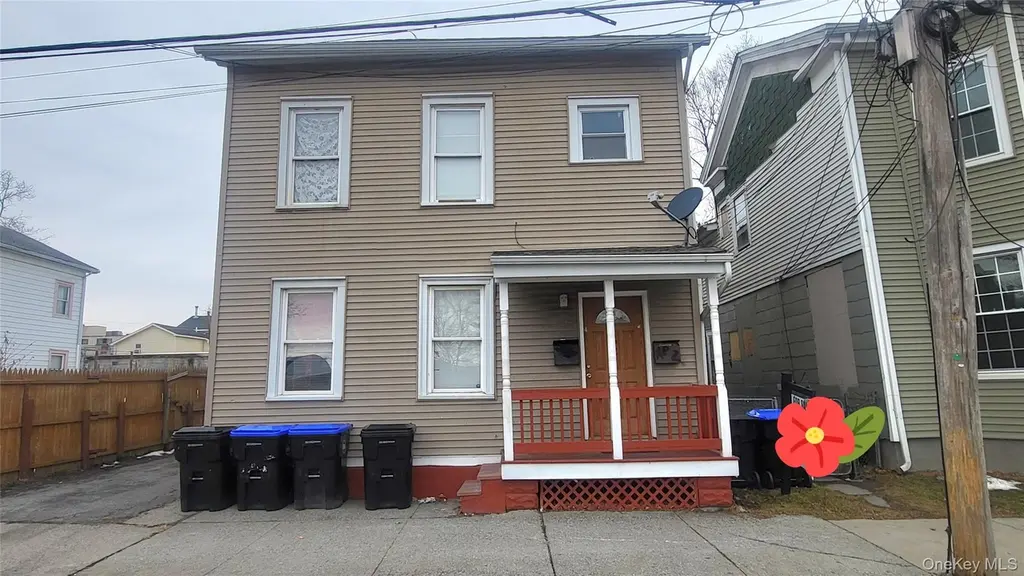
 Duplex
52 Catharine St · Poughkeepsie, NY
Flood risk 1/10 · Minimal
- FEMA flood zone
- X (unshaded)
- Chance of flooding over 30 yrs
- 0.0%
- Est. flood insurance / yr
- $507 – $1,088
Fire risk 1/10 · Minimal
- Est. fire insurance / yr
- $691 – $1,283
Heat risk 5/10 · Moderate
- Hot days now (above 99°F)
- 7 days/yr
- Hot days in 30 yrs
- 16 days/yr
Wind risk 4/10 · Minor
- Chance of severe wind over 30 yrs
- 11.0%
Air-quality risk 2/10 · Minimal
- Unhealthy air days now
- 1 days/yr
- Unhealthy air days in 30 yrs
- 3 days/yr
Risk factors via First Street. Map © Google.
Why this score? — see what drove the C- grade
The composite is a weighted blend of 9 inputs, each scored 0–100. Each bar is that input's sub-score; the figure is the points it added to the 100-point composite (weight × sub-score).
- Cash flow +15.3/30.0
- ARV discount +15.0/15.0
- 1% rule +5.4/10.0
- DSCR +4.7/10.0
- Livability +3.9/5.0
- Rent growth +3.4/5.0
- Schools +3.0/10.0
- Condition / age +2.5/5.0
- Appreciation +0.0/10.0
$419,000
🖨 Deal sheet 📄 Offer letter ✓ Due diligence
Multi-family units
County records classify this as Multi-Family (2-4 Unit). Listing-text estimate: 2 units. confirmed
Listing remarks MLS
Two Family Home Consisting Of (2) Three Bedroom, One Bath Apartments With Separate Utilities (Gas And Electric.) And Driveway For Parking Convenience. Each Unit Has A Combination Of Ceramic Tiled And Laminate Floors. Updates Include New Electric, New Furnaces, New Plumbing, New Roof And Updated Windows Throughout. There Is A Walkup Attic Plus An Unfinished Basement With Interior And Exterior Access. A City Parking Lot Is Directly Across The Road From This Bldg For Permit Parking. We Will Need Prior's Day Notice To Show. This Is An As Is Sale. Home Will Be Delivered With The Certificate Of Occupancy Presently On File.***Showings Between 11AM and 4PM Anyday WITH At Least Prior's Day Notice***Agents, Please See Other Remarks For More Information.
Key facts
- Separate utilities
- Driveway for parking
- Two family home
Tags
Neighborhood map
What this means for you Summary
Snapshot
- This is a 2 × 3-bed/1.0-bath units multifamily listed at $419k.
Deal economics
- At list price, monthly cash flow is $152 ($2k/yr) — positive. Per door: $76/mo.
- The deal already cash-flows at list — no discount required.
- Meets the 1% rule at list price ($4k rent vs $419k).
- Recommended offer: $381k (9.0% below list) — sets the bar for market timing.
- Cap rate 6.7% vs local median 3.4% in Poughkeepsie — top-decile yield for the area; either an underpriced asset or a hidden risk that comps aren't pricing in. Stress-test before assuming the spread holds.
Location & tenants
- Location reads 78/100 on livability (#165 in NY, #2,577 nationally) — a middle-class / working-renter tenant base. Strengths: commute A+, health & safety A+, housing A-; Watch: employment D+, crime F.
- Poughkeepsie City School District (suburban): math 29% / reading 42% proficiency, ranked #559 of 590 in NY (top 95%) — families likely to look elsewhere, expect single-tenant / working-renter base with shorter leases; 73% free/reduced lunch — lower-income household profile, screen leases tightly.
- Market conditions: Rents rising (+3.7%/yr); 189 active listings in the ZIP; 6 comparable units currently listed for rent nearby; rentals at typical pace (median 21d on market — plan ~3-4 weeks tenant-placement turnaround); 620 units permitted in Dutchess County in 2024 (242 in 5+ unit buildings).
- At $4,378/mo this rent would consume 83% of the median local household income ($64k/yr) (locally 2891% of renters already pay >50% of income on rent) — very limited rent-growth headroom before tenants either downsize or default.
Forward outlook
- Local home prices are declining (-3.0%/yr); year-one equity from $3k of loan paydown is wiped out by about $13k of value loss. Plan a longer hold.
- Dutchess County population projected at -11% by 2050 — secular population decline; favor cash flow + early exit over multi-decade hold.
Negotiation context
- It's been on market 116 days — a 9% lower offer ($381k) is reasonable based on typical stale-listing flexibility.
- 3 sale attempts since 18y ago with the ask held roughly flat each time — persistent listings suggest the price (not the market) is what's stuck; bring a comps-based counter.
- Current owner paid $35k; list at $419k implies a 1097% gain — meaningful room to come down on a strong offer.
Risks & watch-outs
- Watch-outs: property tax is 2.7% of price; built in 1910 — expect roof / HVAC / electrical / plumbing capex.
- Climate carrying-cost: extreme-heat days projected 7→16/yr by 2055 (HVAC capex compounding) — expect insurance premiums to compound above CPI over the hold.
Questions for the listing agent
- It's been on market 116 days. Have you received any prior offers? Is the seller open to a 9% concession, seller financing, or rate buy-down credit?
- Can we see the unit-by-unit rent roll, current vacancy, and any below-market leases? What's the average tenancy length?
- What capital expenditures (roof, boiler, parking lot, exteriors) have been made in the last 5 years, and what's planned in the next 2?
- Built in 1910 — when were the roof, HVAC, electrical panel, plumbing, and water heater last replaced?
- Property tax is high relative to price — has the assessment been appealed recently, and will the sale trigger a re-assessment?
- Why hasn't it sold? Are there any deal-killer items the seller is aware of (foundation, flood, title, zoning, code violations)?
- Is there a deadline driving the sale (1031 exchange, divorce, estate, relocation)? That informs how much negotiation room exists.
- Crime grade is F in this area — have there been break-ins, vandalism, or insurance claims at this property in the last 3 years? What carrier currently insures it and at what premium?
- What's the average days-on-market for RENTAL listings here right now (not sales)? A rising rental-DOM trend means longer vacancies and softer asking-rent achievability than the comps imply.
- What's the recent tenant-quality profile in this submarket — average credit score on applications, eviction rate, late-payment / NSF rate, and stable-employment percentage? A property-management company in the area should have these aggregated.
- How much new apartment / multifamily construction is in the pipeline within 1–3 miles? Heavy new supply (>2% of stock underway) typically softens rents 12–24 months out; light construction supports rent growth.
Investment metrics
- 1% rule
- 1.04% ✓
- Cap rate
- 6.73%
- Cash-on-cash
- 1.56%
- DSCR
- 1.07
- GRM
- 8.0
CMA / ARV
- ARV (median comp)
- $633,398
- List price
- $419,000
- Delta
- -33.85%
- Verdict
- UNDERPRICED
- Comps
- 20 within 1.0 mi
Show comp detail 12 sales within ~0.75 mi
| Address | Dist | Beds/Ba | Sqft | Sold | Price | $/sf | Match |
|---|---|---|---|---|---|---|---|
| 32 Balding Ave | 0.27mi | 4/2.0 | 2,452 (+2%) | 5mo | $405,000 | $165 | 80 |
| 228 Mansion St | 0.30mi | 4/2.0 | 2,200 (-8%) | 3mo | $465,000 | $211 | 70 |
| 13 Grand St | 0.38mi | 5/3.0 (+1) | 2,400 (+0%) | 6mo | $489,250 | $204 | 68 |
| 2-4 Elm Pl | 0.30mi | 4/4.0 | 2,309 (-4%) | 6mo | $357,000 | $155 | 67 |
| 150 Franklin St | 0.66mi | 4/2.0 | 2,380 (-1%) | 10mo | $325,000 | $137 | 60 |
| 164 Winnikee Ave | 0.58mi | 4/2.0 | 2,296 (-4%) | 10mo | $355,000 | $155 | 58 |
| 328 Church St | 0.60mi | 5/2.0 (+1) | 2,473 (+3%) | 8mo | $340,000 | $137 | 55 |
| 190 Union St | 0.41mi | 4/2.0 | 2,080 (-13%) | 5mo | $425,000 | $204 | 54 |
| 69 Delafield St | 0.71mi | 4/2.0 | 2,200 (-8%) | 6mo | $377,500 | $172 | 48 |
| 61 Delafield St | 0.70mi | 4/2.0 | 2,659 (+11%) | 4mo | $318,000 | $120 | 46 |
| 93 Delafield St | 0.75mi | 4/2.0 | 2,750 (+15%) | 1mo | $385,000 | $140 | 40 |
| 30 S White St | 0.65mi | 5/2.0 (+1) | 2,100 (-12%) | 8mo | $380,000 | $181 | 38 |
Match score weights: distance 35% · size 25% · config 20% · recency 20%. Top-matched comps best support the ARV.
Projected returns pro-forma
-3.0% appreciation · 3.67% rent growth · sell at horizon
- IRR
- -12.9%
- Equity multiple
- 0.53×
- Total profit
- $-54,896
- Equity at exit
- $62,474
- IRR
- -2.6%
- Equity multiple
- 0.82×
- Total profit
- $-21,648
- Equity at exit
- $36,227
Cash invested: $117,320 (down + closing). Projections, not guarantees.
Landlord ↔ Tenant lean methodology
- Overall (STATE)
- 15 Strongly Tenant-Friendly
- State New York
- 15 Strongly Tenant-Friendly · D+10
- County
- — inherits STATE
- City
- — inherits STATE
ZIP-level market 12601
- Rents YoY
- 3.7%
- Active inventory
- 189
- Price-to-rent
- 16.0×
Monthly cashflow live
- Estimated rent
- $4,378 high interval (Pro) →
- Mortgage (P&I)
- −$2,197
- Tax from tax record
- −$934 /mo · $11,212/yr
- Insurance
- −$175
- HOA
- −$0
- Vacancy / Maint / Mgmt
- −$919
- Net cashflow
- $152
Break-even live
2-unit breakdown (identical units grouped — click to expand)
| Units | Beds | Baths | Est. rent |
|---|---|---|---|
| 2× units | 3 | 1 | $4,378 |
| #1 | 3 | 1 | $2,189 |
| #2 | 3 | 1 | $2,189 |
| Total (2 units) | $4,378 | ||
UW: 25.0% down · 7.5% · 30yr · 1.5% tax · 5.0% vac · 8.0% maint · 8.0% mgmt
Financing live
Cash to close
- Down payment
- $104,750
- Closing costs
- $12,570
- Reserves months
- —
- Total cash needed
- —
Loan-product check · same deal, 3 products live
Conventional
25% down · 7.5% · 30yr
- Down + closing
- —
- Monthly P&I
- —
- Monthly cashflow
- —
- DSCR
- —
- Eligible?
- —
Personal DTI + credit; lowest rate.
DSCR
20% down · 8.5% · 30yr
- Down + closing
- —
- Monthly P&I
- —
- Monthly cashflow
- —
- DSCR
- —
- Eligible?
- —
No personal income docs; deal must DSCR.
Hard money
10% down · 12.0% · 12mo
- Down + closing
- —
- Monthly P&I
- —
- Monthly cashflow
- —
- DSCR
- —
- Eligible?
- —
Short-term bridge; refi at stabilization.
Rent comps 6 comps
| Address | Beds | Baths | Sqft | Rent | $/sqft | DOM | Units | Dist |
|---|---|---|---|---|---|---|---|---|
| 236 Mansion St #2 Poughkeepsie, NY | 3.0 | 1.0 | 2076 | $2,600 | $1.25 | 43d | 1 | 0.31mi |
| 15 Forbus St Poughkeepsie, NY | 3.0 | 1.0 | 2140 | $2,500 | $1.17 | 23d | 1 | 0.64mi |
| 1 Dean Pl Poughkeepsie, NY | 3.0 | 2.5 | 1700 | $4,000 | $2.35 | 14d | 1 | 0.84mi |
| 212 S Cherry St Unit 2 Poughkeepsie, NY | 4.0 | 1.5 | 3100 | $2,950 | $0.95 | 14d | 1 | 0.90mi |
| 32 Salt Point Tpke Poughkeepsie, NY | 3.0 | 2.5 | 1761 | $3,000 | $1.70 | 21d | 1 | 1.13mi |
| 50 Crestwood Blvd Poughkeepsie, NY | 3.0 | 2.0 | 1600 | $2,595 | $1.62 | 14d | 1 | 1.30mi |
Listing history 8 events
-
2026-05-06status Pending 755-char remark
Show marketing remark (755 chars)
Two Family Home Consisting Of (2) Three Bedroom, One Bath Apartments With Separate Utilities (Gas And Electric.) And Driveway For Parking Convenience. Each Unit Has A Combination Of Ceramic Tiled And Laminate Floors. Updates Include New Electric, New Furnaces, New Plumbing, New Roof And Updated Windows Throughout. There Is A Walkup Attic Plus An Unfinished Basement With Interior And Exterior Access. A City Parking Lot Is Directly Across The Road From This Bldg For Permit Parking. We Will Need Prior's Day Notice To Show. This Is An As Is Sale. Home Will Be Delivered With The Certificate Of Occupancy Presently On File.***Showings Between 11AM and 4PM Anyday WITH At Least Prior's Day Notice***Agents, Please See Other Remarks For More Information.
-
2026-02-02price $419,000 755-char remark
Show marketing remark (755 chars)
Two Family Home Consisting Of (2) Three Bedroom, One Bath Apartments With Separate Utilities (Gas And Electric.) And Driveway For Parking Convenience. Each Unit Has A Combination Of Ceramic Tiled And Laminate Floors. Updates Include New Electric, New Furnaces, New Plumbing, New Roof And Updated Windows Throughout. There Is A Walkup Attic Plus An Unfinished Basement With Interior And Exterior Access. A City Parking Lot Is Directly Across The Road From This Bldg For Permit Parking. We Will Need Prior's Day Notice To Show. This Is An As Is Sale. Home Will Be Delivered With The Certificate Of Occupancy Presently On File.***Showings Between 11AM and 4PM Anyday WITH At Least Prior's Day Notice***Agents, Please See Other Remarks For More Information.
-
2026-01-09$429,000 Active 755-char remark
Show marketing remark (755 chars)
Two Family Home Consisting Of (2) Three Bedroom, One Bath Apartments With Separate Utilities (Gas And Electric.) And Driveway For Parking Convenience. Each Unit Has A Combination Of Ceramic Tiled And Laminate Floors. Updates Include New Electric, New Furnaces, New Plumbing, New Roof And Updated Windows Throughout. There Is A Walkup Attic Plus An Unfinished Basement With Interior And Exterior Access. A City Parking Lot Is Directly Across The Road From This Bldg For Permit Parking. We Will Need Prior's Day Notice To Show. This Is An As Is Sale. Home Will Be Delivered With The Certificate Of Occupancy Presently On File.***Showings Between 11AM and 4PM Anyday WITH At Least Prior's Day Notice***Agents, Please See Other Remarks For More Information.
-
2025-08-07historical
-
2025-05-12$424,000 Active
-
2009-05-08soldstatus $35,000
-
2009-05-01historical
-
2008-12-02
ⓘ Source: listings_history table (triggers on properties + properties_extension) + one-shot
backfill from property_details.listing_events for pre-trigger history.
Tax reassessment forecast NY · Partial reset (capped growth)
- Current annual tax
- $11,212 · $934/mo
- Projected year-2 tax
- $11,212 · $934/mo
- Expected delta
- $0/yr ($0/mo · 0.0%)
ⓘ Screening estimate from a state-policy table — verify with the county assessor before closing.
Climate risk First Street
- Flood 1/10 Low FEMA zone X (unshaded) · 0% chance over 30 yrs
- Wildfire 1/10 Low
- Heat 5/10 Major 7 d/yr ≥99°F today · 16 d/yr by 30 yrs out
- Wind 4/10 Moderate 11% chance of damaging wind over 30 yrs
- Air quality 2/10 Low 1 unhealthy d/yr today · 3 by 30 yrs out
Nearby sold comps map
Loading sold comps map…
Walkable amenities ~0.75 mi
Loading nearby amenities…
Taxation est. · year 1
- Rental income
- $52,536
- − Mortgage interest
- −$23,471
- − Property taxes
- −$11,212
- − Insurance
- −$2,095
- − Repairs & maintenance
- −$4,203
- − Management
- −$4,203
- − Depreciation
- −$12,189
- Taxable loss
- −$4,836
- Est. tax savings @ 24.0%
- +$1,161
- After-tax cash flow
- $2,990/yr
For passive investors: Depreciation is non-cash, so a rental often shows a tax loss while cash-flowing — sheltering income. Rental losses are passive: they offset passive income freely, and up to $25,000/yr can offset ordinary (W-2) income if you actively participate and your MAGI is under $100k (phasing out to $0 by $150k); unused losses carry forward. On sale, claimed depreciation is recaptured at up to 25%, and gains may owe capital-gains tax (a 1031 exchange can defer both). Figures are a year-1 estimate at your 24.0% rate — not tax advice; consult a CPA.
Schools (NCES district)
- District
- Poughkeepsie City School District
- NCES district ID
- 3623760
- Math proficiency
- 29% ▲ 5.00%
- Reading proficiency
- 42% ▲ 12.00%
- Median HH income
- $39,159
- Composite
- 29.68/100
- National rank
- #6459
- State rank
- #559 of 590 in NY
Livability — Poughkeepsie
- Score
- 78/100
- State rank
- #165
- US rank
- #2577
Category grades
Schools grade is shown separately in the Schools card above.
Census & demographics
- Census place
- Poughkeepsie, NY
- County
- Dutchess County · 188,048 people
- City population
- 86,468
- Metro
- Poughkeepsie-Newburgh-Middletown, NY
- Population (ZIP)
- 44,164
- Household income
- $63,652
- Rent vs Own
- Severe rent burden
- 2891.0
Population outlook (Dutchess County) Hauer SSP2
- Today (2025)
- 291,768 people
- By 2030
- 287,131 · -1.6%
- By 2040
- 274,881 · -5.8%
- By 2050
- 259,971 · -10.9%
- By 2075
- 235,366 · -19.3%
- By 2100
- 208,786 · -28.4%
Race, ethnicity, and origin ACS 2023
- Neighborhood character
- Highly diverse neighborhood (Simpson 0.70)
- Race & ethnicity
- White 44% Black 24% Hispanic / Latino 22% Two or more races 17% Asian 3%
- Hispanic origin (detail)
- Mexican 8% Puerto Rican 5% Dominican 1%
- Common ancestry
- Romanian 3% Iranian 1% Lithuanian 1%
- Foreign-born
- 19% · Canada, China
- Languages at home
- 79% English-only · Spanish 15% Other Indo-European 1% Chinese 1%
Political lean MEDSL · Dutchess
- 2024 margin
- Lean D (+5.4) · D 52.7% · R 47.3%
- 2008→2024 swing
- -3.2pp toward R · 2008: 8.6pp · 2024: 5.4pp
- All cycles
- 2024: D+5.4 2020: D+9.6 2016: R+1.1 2012: D+6.6 2008: D+8.6
Not yet ingested
- Civics
- —
Market trends
- HPI YoY
- ▼ -210.62%
- Current HPI
- 293.9789
- Rent YoY
- ▲ 3.67%
- Metro
- Poughkeepsie-Newburgh-Middletown, NY
- State GDP YoY
- ▲ 2.60%
- F500 in state
- 92
Industry mix (Fortune 500 HQ in NY)
| Industry | F500 HQs | Revenue |
|---|---|---|
| Financial Services | 10 | $950B |
|
||
| Consumer Goods | 9 | $162B |
|
||
| Insurance | 4 | $225B |
|
||
| Telecommunications | 2 | $144B |
|
||
| Pharmaceuticals | 2 | $112B |
|
||
| Media / Entertainment | 2 | $69B |
|
||
Price history
+1097.1% since first listed8 events — show timeline
- 2026-05-06 Pending — OneKey® MLS as Distributed by MLS Grid
- 2026-02-02 Price Changed $419,000 OneKey® MLS as Distributed by MLS Grid
- 2026-01-09 Listed $429,000 OneKey® MLS as Distributed by MLS Grid
- 2025-08-07 Listing Removed — OneKey® MLS as Distributed by MLS Grid
- 2025-05-12 Listed $424,000 OneKey® MLS as Distributed by MLS Grid
- 2009-05-08 Sold (Public Records) $35,000 Public Records
- 2009-05-01 Delisted — HGMLS
- 2008-12-02 Listed — HGMLS
Property tax history
+6.8%/yrLatest (2025): $11,212 · +54.4% YoY. Source: county tax records.
Cash-flow waterfall
monthlySold comps — $/sqft
last 12 mo · ≤1 miLoading sold comps…