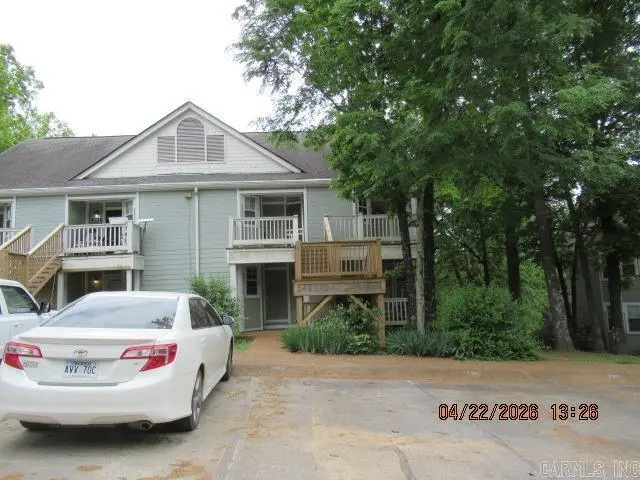
3015 Summer Hill Pl · Fairfield Bay, AR
Flood risk No data
- FEMA flood zone
- —
- Chance of flooding over 30 yrs
- —
- Est. flood insurance / yr
- —
Fire risk No data
- Est. fire insurance / yr
- —
Heat risk No data
- Hot days now (above threshold)
- —
- Hot days in 30 yrs
- —
Wind risk No data
- Chance of severe wind over 30 yrs
- —
Air-quality risk No data
- Unhealthy air days now
- —
- Unhealthy air days in 30 yrs
- —
Risk factors via First Street. Map © Google.
Why this score? — see what drove the C grade
The composite is a weighted blend of 9 inputs, each scored 0–100. Each bar is that input's sub-score; the figure is the points it added to the 100-point composite (weight × sub-score).
- Cash flow +15.0/30.0
- ARV discount +15.0/15.0
- 1% rule +5.0/10.0
- DSCR +5.0/10.0
- Appreciation +4.8/10.0
- Schools +3.8/10.0
- Livability +3.1/5.0
- Rent growth +2.5/5.0
- Condition / age +2.5/5.0
$30,000
🖨 Deal sheet 📄 Offer letter ✓ Due diligence
Listing remarks
This studio is perfect for enjoying relaxing trips to Fairfield Bay! It's priced to sell and waiting for your decorating touches. VRBO and long term rental possibilities, too! AGENTS, please see remarks.
Key facts
- $300 HOA
- Parking
- Community pool
Property features AI
Finance
- Financial info: Cash financing preferred
- HOA & community: Monthly association fees cover building exterior, termite contract, and grounds; Association fee amounts listed separately
Exterior
- Parking: Parking pad for 1 car
- Utilities: Public water; Community sewer; Electric service via cooperative
- Home design: Frame and Masonite exterior
- Construction: Crawl space foundation; Architectural shingle roof
- Exterior features: Deck; Guttering; Paved road access; Sloped lot; Wooded lot; Located in a subdivision; Community amenities include swimming pool(s), tennis court(s), playground, picnic area, and fitness/bike trail
Interior
- Kitchen: Other kitchen equipment (see remarks)
- Flooring: Vinyl flooring; Tile flooring
- Bathrooms: 1 full bathroom
- Heating & cooling: Central electric cooling; Central electric heat; Heat pump
- Interior features: Washer connection, washer included; Dryer connection (electric), dryer included; Insulated windows; Insulated doors
- Laundry & utility: Washer and dryer included; Washer and dryer connections
Neighborhood map
What this means for you Summary
Snapshot
- This is a 1-bed/1.0-bath condo listed at $30k.
Deal economics
- At list price, monthly cash flow is $630 ($8k/yr) — positive.
- The deal already cash-flows at list — no discount required.
- Meets the 1% rule at list price ($1k rent vs $30k).
- Recommended offer: $29k (3.0% below list) — sets the bar for market timing.
- Cap rate 31.5% vs local median 5.3% in Fairfield Bay — top-decile yield for the area; either an underpriced asset or a hidden risk that comps aren't pricing in. Stress-test before assuming the spread holds.
Location & tenants
- Location reads 62/100 on livability (#220 in AR) — a middle-class / working-renter tenant base. Strengths: cost of living A+, housing A+, crime B; Watch: employment D+, schools F, amenities F.
- Shirley School District (rural): math 44% / reading 42% proficiency, ranked #132 of 245 in AR (top 54%) — families likely to look elsewhere, expect single-tenant / working-renter base with shorter leases; 73% free/reduced lunch — lower-income household profile, screen leases tightly.
- Market conditions: 259 active listings in the ZIP; 16 units permitted in Van Buren County in 2024 (0 in 5+ unit buildings).
Forward outlook
- In year one you build about $64 of equity ($207 loan paydown + $-143 appreciation (-0.5% local appreciation)).
- Van Buren County population projected at -27% by 2050 — secular population decline; favor cash flow + early exit over multi-decade hold.
- At projected returns (-0.5% appreciation + 3.0% rent growth), your $8k cash investment doubles in ~2 years — after that, you're playing with house money.
Negotiation context
- It's been on market 57 days — a 3% lower offer ($29k) is reasonable based on typical stale-listing flexibility.
- 2 sale attempts with the ask held roughly flat each time — persistent listings suggest the price (not the market) is what's stuck; bring a comps-based counter.
- Current owner paid $13k; list at $30k implies a 131% gain — meaningful room to come down on a strong offer.
Risks & watch-outs
- Watch-outs: HOA is 21% of rent.
Questions for the listing agent
- It's been on market 57 days. Have you received any prior offers? Is the seller open to a 3% concession, seller financing, or rate buy-down credit?
- What does the HOA fee cover, when was the last increase, and are there any pending special assessments or reserve-fund shortfalls?
- Any open or pending special assessments — roof, HVAC, plumbing, elevator, façade? What's the per-unit balance and payoff schedule, and is the seller paying it off at close or rolling it to the buyer?
- Is there a deadline driving the sale (1031 exchange, divorce, estate, relocation)? That informs how much negotiation room exists.
- Schools are F-rated, which usually means shorter tenancies and higher turnover. Who's the typical renter profile here, and what's been the actual vacancy rate?
- What's the average days-on-market for RENTAL listings here right now (not sales)? A rising rental-DOM trend means longer vacancies and softer asking-rent achievability than the comps imply.
- What's the recent tenant-quality profile in this submarket — average credit score on applications, eviction rate, late-payment / NSF rate, and stable-employment percentage? A property-management company in the area should have these aggregated.
- How much new apartment / multifamily construction is in the pipeline within 1–3 miles? Heavy new supply (>2% of stock underway) typically softens rents 12–24 months out; light construction supports rent growth.
Investment metrics
- 1% rule
- 4.71% ✓
- Cap rate
- 31.49%
- Cash-on-cash
- 89.98%
- DSCR
- 5.00
- GRM
- 1.8
CMA / ARV
- ARV (median comp)
- $53,343
- List price
- $30,000
- Delta
- -43.76%
- Verdict
- UNDERPRICED
- Comps
- 20 within 1.0 mi
Projected returns pro-forma
-0.48% appreciation · 3.0% rent growth · sell at horizon
- IRR
- 92.3%
- Equity multiple
- 5.62×
- Total profit
- $38,768
- Equity at exit
- $8,003
- IRR
- 93.9%
- Equity multiple
- 11.64×
- Total profit
- $89,401
- Equity at exit
- $9,072
Cash invested: $8,400 (down + closing). Projections, not guarantees.
Landlord ↔ Tenant lean methodology
- Overall (STATE)
- 92 Strongly Landlord-Friendly
- State Arkansas
- 92 Strongly Landlord-Friendly · R+14
- County
- — inherits STATE
- City
- — inherits STATE
ZIP-level market 72088
- Home prices YoY
- -0.2%
- Active inventory
- 259
- Price-to-rent
- 1.8×
Monthly cashflow live
- Estimated rent
- $1,413 medium interval (Pro) →
- Mortgage (P&I)
- −$157
- Tax from tax record
- −$17 /mo · $201/yr
- Insurance
- −$12
- HOA
- −$300
- Vacancy / Maint / Mgmt
- −$297
- Net cashflow
- $630
Break-even live
UW: 25.0% down · 7.5% · 30yr · 1.5% tax · 5.0% vac · 8.0% maint · 8.0% mgmt
Financing live
Cash to close
- Down payment
- $7,500
- Closing costs
- $900
- Reserves months
- —
- Total cash needed
- —
Loan-product check · same deal, 3 products live
Conventional
25% down · 7.5% · 30yr
- Down + closing
- —
- Monthly P&I
- —
- Monthly cashflow
- —
- DSCR
- —
- Eligible?
- —
Personal DTI + credit; lowest rate.
DSCR
20% down · 8.5% · 30yr
- Down + closing
- —
- Monthly P&I
- —
- Monthly cashflow
- —
- DSCR
- —
- Eligible?
- —
No personal income docs; deal must DSCR.
Hard money
10% down · 12.0% · 12mo
- Down + closing
- —
- Monthly P&I
- —
- Monthly cashflow
- —
- DSCR
- —
- Eligible?
- —
Short-term bridge; refi at stabilization.
HOA detail condo
- Monthly dues
- $300 · $3,600/yr
- Assessments
- None detected in remarks — confirm with the listing agent.
Listing history 22 events
-
2026-06-19days on market $30,000 Active 57 DOM
-
2026-06-18days on market $30,000 Active 56 DOM
-
2026-06-17days on market $30,000 Active 55 DOM
-
2026-06-16days on market $30,000 Active 54 DOM
-
2026-06-15days on market $30,000 Active 53 DOM
-
2026-06-14days on market $30,000 Active 51 DOM
-
2026-06-12statusdays on market $30,000 Active 50 DOM
-
2026-06-09remarks 205-char remark
-
2026-06-09days on market $30,000 Back on Market 47 DOM
-
2026-06-08days on market $30,000 Back on Market 46 DOM
-
2026-06-07days on market $30,000 Back on Market 45 DOM
-
2026-06-07statusdays on market $30,000 Back on Market 44 DOM
-
2026-06-04days on market $30,000 Take Backups 41 DOM
-
2026-06-02days on market $30,000 Take Backups 40 DOM
-
2026-06-01days on market $30,000 Take Backups 39 DOM
-
2026-05-31days on market $30,000 Take Backups 38 DOM
-
2026-05-31days on market $30,000 Take Backups 37 DOM
-
2026-05-08historical Take Backups 176-char remark
-
2026-04-22$30,000 New Listing 176-char remark
-
2003-08-14soldstatus $13,000
-
2000-06-26soldstatus $15,000
-
1995-03-15soldstatus $10,000
ⓘ Source: listings_history table (triggers on properties + properties_extension) + one-shot
backfill from property_details.listing_events for pre-trigger history.
Tax reassessment forecast AR · Resets to sale price
- Current annual tax
- $201 · $17/mo
- Projected year-2 tax
- $201 · $17/mo
- Expected delta
- $0/yr ($0/mo · 0.0%)
ⓘ Screening estimate from a state-policy table — verify with the county assessor before closing.
Nearby sold comps map
Loading sold comps map…
Walkable amenities ~0.75 mi
Loading nearby amenities…
Taxation est. · year 1
- Rental income
- $16,959
- − Mortgage interest
- −$1,680
- − Property taxes
- −$201
- − Insurance
- −$150
- − Repairs & maintenance
- −$1,357
- − Management
- −$1,357
- − HOA
- −$3,600
- − Depreciation
- −$873
- Taxable income
- $7,741
- Est. tax owed @ 24.0%
- −$1,858
- After-tax cash flow
- $5,701/yr
For passive investors: Depreciation is non-cash, so a rental often shows a tax loss while cash-flowing — sheltering income. Rental losses are passive: they offset passive income freely, and up to $25,000/yr can offset ordinary (W-2) income if you actively participate and your MAGI is under $100k (phasing out to $0 by $150k); unused losses carry forward. On sale, claimed depreciation is recaptured at up to 25%, and gains may owe capital-gains tax (a 1031 exchange can defer both). Figures are a year-1 estimate at your 24.0% rate — not tax advice; consult a CPA.
Schools (NCES district)
- District
- Shirley School District
- NCES district ID
- 0512420
- Math proficiency
- 44% ▲ 4.00%
- Reading proficiency
- 42% ▲ 1.00%
- Median HH income
- $36,296
- Composite
- 37.98/100
- National rank
- #8669
- State rank
- #132 of 245 in AR
Livability — Fairfield Bay
- Score
- 62/100
- State rank
- #220
- US rank
- #16778
Category grades
Schools grade is shown separately in the Schools card above.
Census & demographics
- Census place
- Fairfield Bay, AR
- City population
- 2,264
- Population (ZIP)
- 2,264
Population outlook (Van Buren County) Hauer SSP2
- Today (2025)
- 15,459 people
- By 2030
- 14,645 · -5.3%
- By 2040
- 12,918 · -16.4%
- By 2050
- 11,263 · -27.1%
- By 2075
- 7,870 · -49.1%
- By 2100
- 4,918 · -68.2%
Race, ethnicity, and origin ACS 2023
- Neighborhood character
- Predominantly White (88%)
- Race & ethnicity
- White 88% Hispanic / Latino 6% Two or more races 3% Asian 2%
- Hispanic origin (detail)
- Mexican 6%
- Common ancestry
- Lithuanian 9% Iranian 2% Romanian 2%
- Foreign-born
- 3% · Canada, Dominican Republic
- Languages at home
- 94% English-only · Other Asian/Pacific 4% Tagalog/Filipino 1% Spanish 1%
Political lean MEDSL · Van Buren
- 2024 margin
- Solid R (+60.2) · D 18.9% · R 79.0% · Other 2.1%
- 2008→2024 swing
- -28.5pp toward R · 2008: -31.7pp · 2024: -60.2pp
- All cycles
- 2024: R+60.2 2020: R+56.9 2016: R+53.9 2012: R+39.5 2008: R+31.7
Not yet ingested
- Civics
- —
Market trends
- HPI YoY
- ▼ -0.48%
- Current HPI
- 238.2694
- Rent YoY
- —
- Metro
- —
- State GDP YoY
- ▲ 3.80%
- F500 in state
- 10
Industry mix (Fortune 500 HQ in AR)
| Industry | F500 HQs | Revenue |
|---|---|---|
| Retail | 1 | $681B |
|
||
| Food / Agriculture | 1 | $53B |
|
||
| Retail / Energy | 1 | $22B |
|
||
| Transportation / Logistics | 1 | $12B |
|
||
| Energy | 1 | $4B |
|
||
Price history
+200.0% since first listed6 events — show timeline
- 2026-06-05 Relisted — CARMLS
- 2026-05-08 Contingent — CARMLS
- 2026-04-22 Listed $30,000 CARMLS
- 2003-08-14 Sold (Public Records) $13,000 Public Records
- 2000-06-26 Sold (Public Records) $15,000 Public Records
- 1995-03-15 Sold (Public Records) $10,000 Public Records
Property tax history
+1.8%/yrLatest (2025): $201 · +9.9% YoY. Source: county tax records.
Cash-flow waterfall
monthlySold comps — $/sqft
last 12 mo · ≤1 miLoading sold comps…