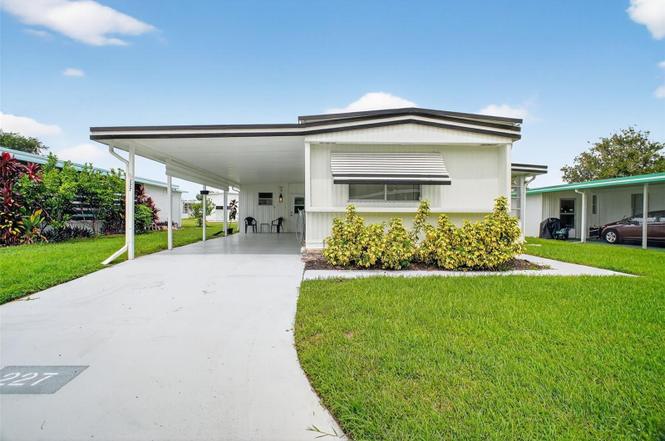
227 Paradise S · Leesburg, FL
Flood risk 4/10 · Minor
- FEMA flood zone
- A
- Chance of flooding over 30 yrs
- 0.22%
- Est. flood insurance / yr
- $1,009 – $1,996
Fire risk 4/10 · Minor
- Est. fire insurance / yr
- $947 – $1,759
Heat risk 8/10 · Major
- Hot days now (above 107°F)
- 7 days/yr
- Hot days in 30 yrs
- 20 days/yr
Wind risk 9/10 · Severe
- Chance of severe wind over 30 yrs
- 99.0%
Air-quality risk 2/10 · Minimal
- Unhealthy air days now
- 1 days/yr
- Unhealthy air days in 30 yrs
- 1 days/yr
Risk factors via First Street. Map © Google.
Why this score? — see what drove the B- grade
The composite is a weighted blend of 9 inputs, each scored 0–100. Each bar is that input's sub-score; the figure is the points it added to the 100-point composite (weight × sub-score).
- Cash flow +30.0/30.0
- 1% rule +10.0/10.0
- DSCR +10.0/10.0
- ARV discount +7.5/15.0
- Schools +4.2/10.0
- Livability +3.1/5.0
- Rent growth +2.5/5.0
- Condition / age +2.5/5.0
- Appreciation +0.0/10.0
$89,900
🖨 Deal sheet (PDF) 📄 Offer letter ✓ Due diligence
Listing remarks
Welcome to this beautifully updated manufactured home in a desirable 55+ community, offering the perfect blend of comfort, convenience, and low-maintenance living. This move-in-ready residence features modern upgrades throughout, including new flooring, fresh paint, updated kitchen and bathrooms, just move in and enjoy! Ideally located just minutes from shopping, dining, medical facilities, and recreational amenities, this home provides easy access to everything you need. Enjoy a relaxed lifestyle with minimal upkeep in a friendly, well-maintained neighborhood designed for active adults.
Key facts
- 4,383 sq ft lot
- 2 parking spots
- Community pool
Property features AI
Finance
- Other: Located in a senior community; Pets allowed; Community features: clubhouse, community mailbox, deed restrictions, golf carts OK, buyer approval required, association recreation owned
- Financial info: Total monthly fees shown as $215; Total annual fees shown as $2,580; Lease restrictions apply
- HOA & community: Has HOA (monthly fee $215); Association requires approval; Association amenities include clubhouse, pool, shuffleboard court, laundry, wheelchair access/handicap modified access, recreational facilities; Association fee covers cable TV, internet, pool, sewer, water, trash, management, maintenance of grounds, common area taxes, escrow reserves, and recreational facilities
Exterior
- Parking: Carport with 2 spaces
- Utilities: Private water source; Private sewer; Internet available (BB/HS); Cable available and connected; Electricity available and connected; Public utilities available; Underground utilities; Water and sewer connected
- Home design: Manufactured single-wide home; One story; South-facing
- Construction: Metal siding and frame construction; Metal roof; Crawlspace foundation; Completed condition
- Exterior features: Awnings; Sliding doors; Outdoor storage
Interior
- Kitchen: Dishwasher; Range; Refrigerator; Exhaust fan; Electric water heater
- Bedrooms: 2 bedrooms (one-level home)
- Flooring: Laminate
- Bathrooms: 1 full bath; 1 half bath
- Heating & cooling: Central heating; Electric heating; Ductless heating; Central air conditioning
- Interior features: Kitchen and family room combo; Open floorplan; Split bedroom layout; Thermostat; Window treatments
- Laundry & utility: Washer; Dryer; Dedicated laundry room
Neighborhood map
What this means for you Summary
Snapshot
- This is a 2-bed/2.0-bath condo listed at $90k.
Deal economics
- At list price, monthly cash flow is $284 ($3k/yr) — positive.
- The deal already cash-flows at list — no discount required.
- Meets the 1% rule at list price ($2k rent vs $90k).
- Recommended offer: $79k (12.0% below list) — sets the bar for market timing.
- Cap rate 11.7% vs local median 4.5% in Leesburg — top-decile yield for the area; either an underpriced asset or a hidden risk that comps aren't pricing in. Stress-test before assuming the spread holds.
Location & tenants
- Location reads 62/100 on livability (#751 in FL) — a middle-class / working-renter tenant base. Strengths: cost of living A+, housing A+; Watch: schools D+, crime D, amenities F.
- Lake (suburban): math 49% / reading 50% proficiency, ranked #37 of 73 in FL (top 51%) — families likely to look elsewhere, expect single-tenant / working-renter base with shorter leases.
- Market conditions: 285 active listings in the ZIP; 2 comparable units currently listed for rent nearby; 4,799 units permitted in Lake County in 2024 (814 in 5+ unit buildings).
- This rent runs 36% of the median local income ($54k/yr) — at the standard rent-burdened threshold; future hikes will face affordability resistance.
Forward outlook
- Local home prices are declining (-3.0%/yr); year-one equity from $622 of loan paydown is wiped out by about $3k of value loss. Plan a longer hold.
- Lake County population projected at +37% by 2050 — long-run rental-demand tailwind backs the buy-and-hold thesis.
- At projected returns (-3.0% appreciation + 3.0% rent growth), your $25k cash investment doubles in ~9 years — after that, you're playing with house money.
Negotiation context
- It's been on market 273 days — a 12% lower offer ($79k) is reasonable based on typical stale-listing flexibility.
- 9 sale attempts since 21y ago; this cycle's ask has dropped $10k (10%) from the opening price — seller is motivated, your offer sets the floor, not the list.
- Current owner paid $50k; list at $90k implies a 80% gain — meaningful room to come down on a strong offer.
Risks & watch-outs
- Watch-outs: flood insurance adds $125/mo.
- Climate carrying-cost: in FEMA flood zone A (mandatory federal flood insurance); severe wind risk, 99% chance of damaging wind over 30y; extreme-heat days projected 7→20/yr by 2055 (HVAC capex compounding) — expect insurance premiums to compound above CPI over the hold.
Questions for the listing agent
- It's been on market 273 days. Have you received any prior offers? Is the seller open to a 12% concession, seller financing, or rate buy-down credit?
- What's the actual annual flood-insurance premium (NFIP or private), and is the property in a SFHA with mandatory coverage?
- What does the HOA fee cover, when was the last increase, and are there any pending special assessments or reserve-fund shortfalls?
- Any open or pending special assessments — roof, HVAC, plumbing, elevator, façade? What's the per-unit balance and payoff schedule, and is the seller paying it off at close or rolling it to the buyer?
- Why hasn't it sold? Are there any deal-killer items the seller is aware of (foundation, flood, title, zoning, code violations)?
- Is there a deadline driving the sale (1031 exchange, divorce, estate, relocation)? That informs how much negotiation room exists.
- Schools are D-rated, which usually means shorter tenancies and higher turnover. Who's the typical renter profile here, and what's been the actual vacancy rate?
- Crime grade is D in this area — have there been break-ins, vandalism, or insurance claims at this property in the last 3 years? What carrier currently insures it and at what premium?
- What's the average days-on-market for RENTAL listings here right now (not sales)? A rising rental-DOM trend means longer vacancies and softer asking-rent achievability than the comps imply.
- What's the recent tenant-quality profile in this submarket — average credit score on applications, eviction rate, late-payment / NSF rate, and stable-employment percentage? A property-management company in the area should have these aggregated.
- How much new apartment / multifamily construction is in the pipeline within 1–3 miles? Heavy new supply (>2% of stock underway) typically softens rents 12–24 months out; light construction supports rent growth.
Investment metrics
- 1% rule
- 1.79% ✓
- Cap rate
- 11.75%
- Cash-on-cash
- 19.49%
- DSCR
- 1.87
- GRM
- 4.7
CMA / ARV
No comps found within radius.
Projected returns pro-forma
-3.0% appreciation · 3.0% rent growth · sell at horizon
- IRR
- 3.8%
- Equity multiple
- 1.15×
- Total profit
- $3,740
- Equity at exit
- $13,404
- IRR
- 13.5%
- Equity multiple
- 2.09×
- Total profit
- $27,517
- Equity at exit
- $7,773
Cash invested: $25,172 (down + closing). Projections, not guarantees.
Landlord ↔ Tenant lean methodology
- Overall (STATE)
- 87 Strongly Landlord-Friendly
- State Florida
- 87 Strongly Landlord-Friendly · R+3
- County
- — inherits STATE
- City
- — inherits STATE
ZIP-level market 34788
- Home prices YoY
- -18.2%
- Active inventory
- 285
- Price-to-rent
- 4.7×
Monthly cashflow live
- Estimated rent
- $1,605 medium interval (Pro) →
- Mortgage (P&I)
- −$471
- Tax from tax record
- −$135 /mo · $1,625/yr
- Insurance
- −$37
- Flood insurance flood zone
- −$125 /mo · $1,502/yr
- HOA
- −$215
- Vacancy / Maint / Mgmt
- −$337
- Net cashflow
- $284
Break-even live
Sensitivity live
| Price | -10% $334 | -5% $309 | +0% $284 | +5% $258 | +10% $233 |
|---|---|---|---|---|---|
| Rent | -10% $157 | -5% $220 | +0% $284 | +5% $347 | +10% $410 |
| Rate | -1.0pp $329 | -0.5pp $306 | base $284 | +0.5pp $260 | +1.0pp $237 |
UW: 25.0% down · 7.5% · 30yr · 1.5% tax · 5.0% vac · 8.0% maint · 8.0% mgmt
Financing live
Cash to close
- Down payment
- $22,475
- Closing costs
- $2,697
- Reserves months
- —
- Total cash needed
- —
Loan-product check · same deal, 3 products live
Conventional
25% down · 7.5% · 30yr
- Down + closing
- —
- Monthly P&I
- —
- Monthly cashflow
- —
- DSCR
- —
- Eligible?
- —
Personal DTI + credit; lowest rate.
DSCR
20% down · 8.5% · 30yr
- Down + closing
- —
- Monthly P&I
- —
- Monthly cashflow
- —
- DSCR
- —
- Eligible?
- —
No personal income docs; deal must DSCR.
Hard money
10% down · 12.0% · 12mo
- Down + closing
- —
- Monthly P&I
- —
- Monthly cashflow
- —
- DSCR
- —
- Eligible?
- —
Short-term bridge; refi at stabilization.
Rent comps 2 comps
| Address | Beds | Baths | Sqft | Rent | $/sqft | DOM | Units | Dist |
|---|---|---|---|---|---|---|---|---|
| 32818 Lake Square Ct #10 Leesburg, FL | 2.0 | 1.0 | 912 | $1,200 | $1.32 | 24d | 1 | 0.77mi |
| 32827 Blossom Ln Leesburg, FL | 1.0 | 1.0 | 704 | $950 | $1.35 | 24d | 1 | 0.86mi |
HOA detail condo
- Monthly dues
- $215 · $2,580/yr
- Assessments
- None detected in remarks — confirm with the listing agent.
Listing history 35 events
-
2026-06-18days on market $89,900 Active 273 DOM
-
2026-06-17days on market $89,900 Active 272 DOM
-
2026-06-16days on market $89,900 Active 271 DOM
-
2026-06-15days on market $89,900 Active 270 DOM
-
2026-06-13days on market $89,900 Active 268 DOM
-
2026-06-09days on market $89,900 Active 264 DOM
-
2026-06-08days on market $89,900 Active 263 DOM
-
2026-06-07days on market $89,900 Active 262 DOM
-
2026-06-04days on market $89,900 Active 259 DOM
-
2026-06-03days on market $89,900 Active 258 DOM
-
2026-06-02days on market $89,900 Active 257 DOM
-
2026-06-02days on market $89,900 Active 256 DOM
-
2026-05-31days on market $89,900 Active 255 DOM
-
2026-03-13status Active
-
2026-03-12historical
-
2026-01-05price $89,900
-
2025-09-17$99,500 Active
-
2025-06-30historical
-
2025-04-17$95,000 Active
-
2025-04-12historical
-
2025-02-14price $99,500
-
2025-02-09price $105,000
-
2025-01-06price $110,000
-
2024-06-10$129,900 Active
-
2023-11-27soldstatus $50,000 Closed
-
2023-11-10status Pending
-
2023-11-07status Active
-
2023-10-20status Pending
-
2023-09-22price $75,000
-
2023-08-12status Active
-
2023-07-27status Pending
-
2023-06-17$78,500 Active
-
2008-03-25$46,900
-
2005-06-22soldstatus $31,000
-
2005-02-01$33,000
ⓘ Source: listings_history table (triggers on properties + properties_extension) + one-shot
backfill from property_details.listing_events for pre-trigger history.
Tax reassessment forecast FL · Resets to sale price
- Current annual tax
- $1,625 · $135/mo
- Projected year-2 tax
- $1,625 · $135/mo
- Expected delta
- $0/yr ($0/mo · 0.0%)
ⓘ Screening estimate from a state-policy table — verify with the county assessor before closing.
Climate risk First Street
- Flood 4/10 Moderate FEMA zone A · 22% chance over 30 yrs
- Wildfire 4/10 Moderate
- Heat 8/10 Severe 7 d/yr ≥107°F today · 20 d/yr by 30 yrs out
- Wind 9/10 Extreme 99% chance of damaging wind over 30 yrs
- Air quality 2/10 Low 1 unhealthy d/yr today · 1 by 30 yrs out
Nearby sold comps map
Loading sold comps map…
Walkable amenities ~0.75 mi
Loading nearby amenities…
Taxation est. · year 1
- Rental income
- $19,262
- − Mortgage interest
- −$5,036
- − Property taxes
- −$1,625
- − Insurance
- −$1,952
- − Repairs & maintenance
- −$1,541
- − Management
- −$1,541
- − HOA
- −$2,580
- − Depreciation
- −$2,615
- Taxable income
- $2,372
- Est. tax owed @ 24.0%
- −$569
- After-tax cash flow
- $2,833/yr
For passive investors: Depreciation is non-cash, so a rental often shows a tax loss while cash-flowing — sheltering income. Rental losses are passive: they offset passive income freely, and up to $25,000/yr can offset ordinary (W-2) income if you actively participate and your MAGI is under $100k (phasing out to $0 by $150k); unused losses carry forward. On sale, claimed depreciation is recaptured at up to 25%, and gains may owe capital-gains tax (a 1031 exchange can defer both). Figures are a year-1 estimate at your 24.0% rate — not tax advice; consult a CPA.
Schools (NCES district)
- District
- Lake
- NCES district ID
- 1201050
- Math proficiency
- 49% ▼ -7.00%
- Reading proficiency
- 50% ▼ -4.00%
- Median HH income
- $46,632
- Composite
- 42.05/100
- National rank
- #3327
- State rank
- #37 of 73 in FL
Livability — Leesburg
- Score
- 62/100
- State rank
- #751
- US rank
- #16429
Category grades
Schools grade is shown separately in the Schools card above.
Census & demographics
- County
- Lake County · 364,602 people
- City population
- 70,232
- Metro
- Orlando-Kissimmee-Sanford, FL
- Population (ZIP)
- 22,137
- Household income
- $54,147
- Rent vs Own
- Severe rent burden
- 406.0
Population outlook (Lake County) Hauer SSP2
- Today (2025)
- 386,640 people
- By 2030
- 417,107 · +7.9%
- By 2040
- 476,676 · +23.3%
- By 2050
- 531,296 · +37.4%
- By 2075
- 648,303 · +67.7%
- By 2100
- 698,530 · +80.7%
Race, ethnicity, and origin ACS 2023
- Neighborhood character
- Predominantly White (79%)
- Race & ethnicity
- White 79% Hispanic / Latino 12% Two or more races 7% Black 5% Asian 1%
- Hispanic origin (detail)
- Mexican 3% Puerto Rican 6%
- Common ancestry
- Romanian 4% Lithuanian 3% Slovak 2%
- Foreign-born
- 5% · Canada, South Korea
- Languages at home
- 88% English-only · Spanish 9% German/W. Germanic 1% Tagalog/Filipino 1%
Political lean MEDSL · Lake
- 2024 margin
- Strong R (+24.7) · D 37.3% · R 62.0%
- 2008→2024 swing
- -11.2pp toward R · 2008: -13.5pp · 2024: -24.7pp
- All cycles
- 2024: R+24.7 2020: R+20.0 2016: R+23.1 2012: R+17.1 2008: R+13.5
Not yet ingested
- Civics
- —
Market trends
- HPI YoY
- ▼ -61.07%
- Current HPI
- 273.6616
- Rent YoY
- —
- Metro
- Orlando-Kissimmee-Sanford, FL
- State GDP YoY
- ▲ 3.28%
- F500 in state
- 36
Industry mix (Fortune 500 HQ in FL)
| Industry | F500 HQs | Revenue |
|---|---|---|
| Industrial Technology | 2 | $29B |
|
||
| Insurance | 2 | $17B |
|
||
| Retail | 1 | $60B |
|
||
| Technology Distribution | 1 | $58B |
|
||
| Homebuilding | 1 | $35B |
|
||
| Technology Manufacturing | 1 | $35B |
|
||
Price history
+172.4% since first listed22 events — show timeline
- 2026-03-13 Relisted — Stellar MLS as Distributed by MLS Grid
- 2026-03-12 Listing Removed — Stellar MLS as Distributed by MLS Grid
- 2026-01-05 Price Changed $89,900 Stellar MLS as Distributed by MLS Grid
- 2025-09-17 Listed $99,500 Stellar MLS as Distributed by MLS Grid
- 2025-06-30 Listing Removed — Stellar MLS as Distributed by MLS Grid
- 2025-04-17 Listed $95,000 Stellar MLS as Distributed by MLS Grid
- 2025-04-12 Listing Removed — Stellar MLS as Distributed by MLS Grid
- 2025-02-14 Price Changed $99,500 Stellar MLS as Distributed by MLS Grid
- 2025-02-09 Price Changed $105,000 Stellar MLS as Distributed by MLS Grid
- 2025-01-06 Price Changed $110,000 Stellar MLS as Distributed by MLS Grid
- 2024-06-10 Listed $129,900 Stellar MLS as Distributed by MLS Grid
- 2023-11-27 Sold (MLS) $50,000 Stellar MLS as Distributed by MLS Grid
- 2023-11-10 Pending — Stellar MLS as Distributed by MLS Grid
- 2023-11-07 Relisted — Stellar MLS as Distributed by MLS Grid
- 2023-10-20 Pending — Stellar MLS as Distributed by MLS Grid
- 2023-09-22 Price Changed $75,000 Stellar MLS as Distributed by MLS Grid
- 2023-08-12 Relisted — Stellar MLS as Distributed by MLS Grid
- 2023-07-27 Pending — Stellar MLS as Distributed by MLS Grid
- 2023-06-17 Listed $78,500 Stellar MLS as Distributed by MLS Grid
- 2008-03-25 Listed $46,900 Stellar MLS as Distributed by MLS Grid
- 2005-06-22 Sold (MLS) $31,000 Stellar MLS as Distributed by MLS Grid
- 2005-02-01 Listed $33,000 Stellar MLS as Distributed by MLS Grid
Property tax history
+30.1%/yrLatest (2025): $1,625 · -1.8% YoY. Source: county tax records.
Cash-flow waterfall
monthlySold comps — $/sqft
last 12 mo · ≤1 miLoading sold comps…