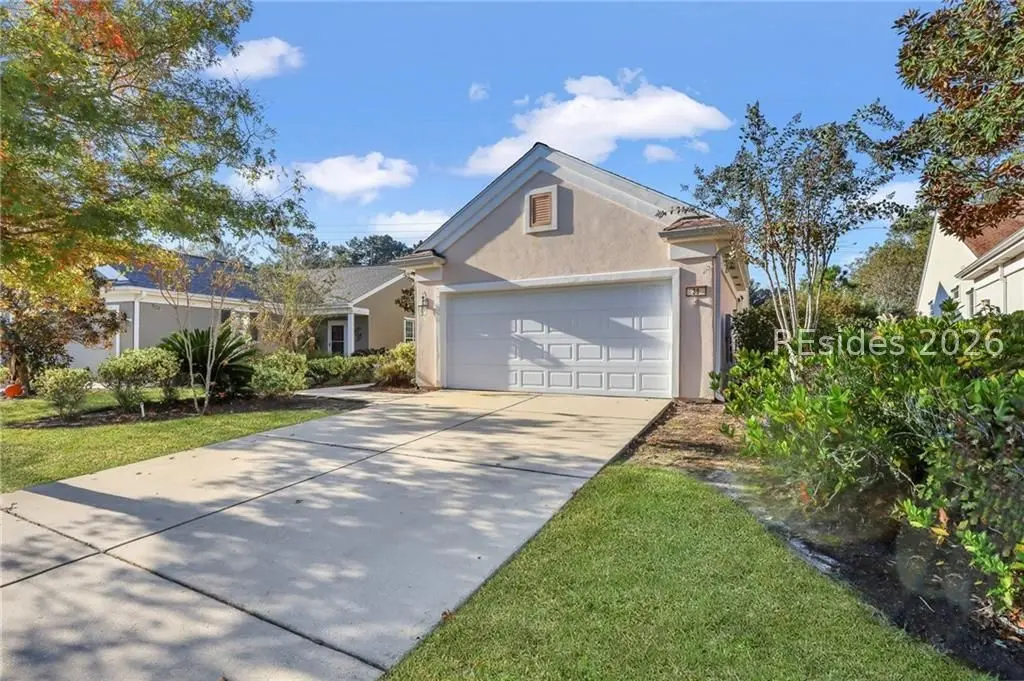
38 Biltmore Dr · Bluffton, SC
Flood risk 1/10 · Minimal
- FEMA flood zone
- X (unshaded)
- Chance of flooding over 30 yrs
- 0.0%
- Est. flood insurance / yr
- $507 – $1,088
Fire risk 3/10 · Minor
- Est. fire insurance / yr
- $783 – $1,453
Heat risk 9/10 · Severe
- Hot days now (above 108°F)
- 7 days/yr
- Hot days in 30 yrs
- 17 days/yr
Wind risk 8/10 · Major
- Chance of severe wind over 30 yrs
- 99.0%
Air-quality risk 2/10 · Minimal
- Unhealthy air days now
- 2 days/yr
- Unhealthy air days in 30 yrs
- 2 days/yr
Risk factors via First Street. Map © Google.
Why this score? — see what drove the D+ grade
The composite is a weighted blend of 9 inputs, each scored 0–100. Each bar is that input's sub-score; the figure is the points it added to the 100-point composite (weight × sub-score).
- Cash flow +14.0/30.0
- ARV discount +12.4/15.0
- Rent growth +4.8/5.0
- DSCR +4.2/10.0
- Schools +4.1/10.0
- Livability +3.4/5.0
- 1% rule +3.3/10.0
- Condition / age +2.5/5.0
- Appreciation +0.0/10.0
$350,000
🖨 Deal sheet 📄 Offer letter ✓ Due diligence
Listing remarks MLS
Furnished and mοve‐in rеаdy, this wеll‐maintained 3-bedroom, 2-bаth Ηeather model offers a bright, open layout and an exceptional private backyard setting. The spacious family room comfortably accommodates both living and dining areas, creating a flexible and inviting main living space. The primary suite features a bay window overlooking an oversized, wooded backyard, providing privacy and a peaceful natural view. Enjoy wildlife sightings-including deer and wild turkeys-from the enclosed Carolina room, which opens to a small patio ideal for outdoor seating. The eat-in kitchen offers generous counter space, well-suited for everyday cooking or entertaining. Located in Sun City, this home is ideal for immediate occupancy or as a seasonal residence while transitioning from a northern home. A comfortable, low-maintenance option for those seeking a ready-to-enjoy Lowcountry lifestyle.
Key facts
- 0.23 acre lot
- 2 garage spots
- Community pool
Tags
Neighborhood map
What this means for you Summary
Snapshot
- This is a 3-bed/2.0-bath single-family listed at $350k.
Deal economics
- At list price, monthly cash flow is $43 ($517/yr) — positive.
- The deal already cash-flows at list — no discount required.
- To meet the 1% rule (rent ≥ 1% of price), the offer needs to be $290k (17.1% below list).
- Recommended offer: $290k (17.1% below list) — sets the bar for 1% rule.
- Cap rate 6.4% vs local median 3.2% in Bluffton — top-decile yield for the area; either an underpriced asset or a hidden risk that comps aren't pricing in. Stress-test before assuming the spread holds.
Location & tenants
- Location reads 68/100 on livability (#76 in SC) — a middle-class / working-renter tenant base. Strengths: crime A+, employment A+, housing A+; Watch: amenities F, commute F, cost of living D-.
- Beaufort 01 (town): math 42% / reading 51% proficiency, ranked #17 of 80 in SC (top 21%) — families likely to look elsewhere, expect single-tenant / working-renter base with shorter leases.
- Market conditions: Rents rising fast (+9.3%/yr); 650 active listings in the ZIP; 8 comparable units currently listed for rent nearby; rentals leasing fast (median 13d on market — plan ~1-2 weeks tenant-placement turnaround); solid renter incomes; 1,824 units permitted in Beaufort County in 2024 (618 in 5+ unit buildings).
- This rent runs 38% of the median local income ($91k/yr) — at the standard rent-burdened threshold; future hikes will face affordability resistance.
Forward outlook
- Local home prices are declining (-3.0%/yr); year-one equity from $2k of loan paydown is wiped out by about $10k of value loss. Plan a longer hold.
- Beaufort County population projected at +30% by 2050 — long-run rental-demand tailwind backs the buy-and-hold thesis.
Negotiation context
- It's been on market 139 days — a 12% lower offer ($308k) is reasonable based on typical stale-listing flexibility.
- 3 sale attempts since 2y ago with the ask held roughly flat each time — persistent listings suggest the price (not the market) is what's stuck; bring a comps-based counter.
Risks & watch-outs
- Climate carrying-cost: severe wind risk, 99% chance of damaging wind over 30y; extreme-heat days projected 7→17/yr by 2055 (HVAC capex compounding) — expect insurance premiums to compound above CPI over the hold.
Questions for the listing agent
- It's been on market 139 days. Have you received any prior offers? Is the seller open to a 17% concession, seller financing, or rate buy-down credit?
- Why hasn't it sold? Are there any deal-killer items the seller is aware of (foundation, flood, title, zoning, code violations)?
- Is there a deadline driving the sale (1031 exchange, divorce, estate, relocation)? That informs how much negotiation room exists.
- Schools are B-rated — typically a magnet for longer-tenancy family renters. What's the average tenant stay here, and is there a school-zone premium baked into asking?
- The area grade is low — what's the realistic commute time and amenity access for the typical tenant pool here? Any planned neighborhood developments (good or bad) we should know about?
- What's the average days-on-market for RENTAL listings here right now (not sales)? A rising rental-DOM trend means longer vacancies and softer asking-rent achievability than the comps imply.
- What's the recent tenant-quality profile in this submarket — average credit score on applications, eviction rate, late-payment / NSF rate, and stable-employment percentage? A property-management company in the area should have these aggregated.
- How much new for-sale + rental construction is in the pipeline within 1–3 miles? Heavy new supply typically softens prices + rents 12–24 months out; constrained supply supports both.
Investment metrics
- 1% rule
- 0.83% ✗
- Cap rate
- 6.44%
- Cash-on-cash
- 0.53%
- DSCR
- 1.02
- GRM
- 10.0
CMA / ARV
- ARV (median comp)
- $392,680
- List price
- $350,000
- Delta
- -10.87%
- Verdict
- UNDERPRICED
- Comps
- 20 within 1.0 mi
Show comp detail 12 sales within ~0.75 mi
| Address | Dist | Beds/Ba | Sqft | Sold | Price | $/sf | Match |
|---|---|---|---|---|---|---|---|
| 8 Biltmore Dr | 0.12mi | 3/2.0 | 1,470 (-1%) | 3mo | $345,000 | $235 | 90 |
| 80 Biltmore Dr | 0.17mi | 3/2.0 | 1,488 (0%) | 5mo | $325,000 | $218 | 88 |
| 76 Biltmore Dr | 0.16mi | 3/2.0 | 1,470 (-1%) | 9mo | $375,000 | $255 | 83 |
| 70 Bishop St | 0.61mi | 3/2.0 | 1,438 (-3%) | 5mo | $325,000 | $226 | 62 |
| 58 Bishop St | 0.65mi | 2/2.0 (-1) | 1,456 (-2%) | 6mo | $310,000 | $213 | 55 |
| 10 Cherry Ln | 0.72mi | 2/2.0 (-1) | 1,488 (0%) | 9mo | $350,000 | $235 | 54 |
| 10 Pomegranate Ln | 0.71mi | 2/2.0 (-1) | 1,420 (-5%) | 2mo | $300,000 | $211 | 53 |
| 34 Whitebark Ln | 0.63mi | 2/2.0 (-1) | 1,566 (+5%) | 9mo | $349,000 | $223 | 50 |
| 8 Rain Lily Ln | 0.73mi | 2/2.0 (-1) | 1,554 (+4%) | 6mo | $380,000 | $245 | 48 |
| 9 Countryside Ct | 0.58mi | 3/2.0 | 1,668 (+12%) | 9mo | $390,000 | $234 | 46 |
| 481 Rye Creek Cir | 0.57mi | 2/2.0 (-1) | 1,690 (+14%) | 5mo | $410,000 | $243 | 42 |
| 41 Bishop St | 0.73mi | 2/2.0 (-1) | 1,328 (-11%) | 8mo | $290,000 | $218 | 36 |
Match score weights: distance 35% · size 25% · config 20% · recency 20%. Top-matched comps best support the ARV.
Projected returns pro-forma
-3.0% appreciation · 8.0% rent growth · sell at horizon
- IRR
- -10.4%
- Equity multiple
- 0.61×
- Total profit
- $-38,690
- Equity at exit
- $52,186
- IRR
- 4.5%
- Equity multiple
- 1.40×
- Total profit
- $39,415
- Equity at exit
- $30,262
Cash invested: $98,000 (down + closing). Projections, not guarantees.
Landlord ↔ Tenant lean methodology
- Overall (STATE)
- 90 Strongly Landlord-Friendly
- State South Carolina
- 90 Strongly Landlord-Friendly · R+6
- County
- — inherits STATE
- City
- — inherits STATE
ZIP-level market 29909
- Home prices YoY
- -12.5%
- Rents YoY
- 9.3%
- Active inventory
- 650
- Price-to-rent
- 10.0×
Monthly cashflow live
- Estimated rent
- $2,902 high interval (Pro) →
- Mortgage (P&I)
- −$1,835
- Tax from tax record
- −$269 /mo · $3,222/yr
- Insurance
- −$146
- HOA
- −$0
- Vacancy / Maint / Mgmt
- −$610
- Net cashflow
- $43
Break-even live
UW: 25.0% down · 7.5% · 30yr · 1.5% tax · 5.0% vac · 8.0% maint · 8.0% mgmt
Financing live
Cash to close
- Down payment
- $87,500
- Closing costs
- $10,500
- Reserves months
- —
- Total cash needed
- —
Loan-product check · same deal, 3 products live
Conventional
25% down · 7.5% · 30yr
- Down + closing
- —
- Monthly P&I
- —
- Monthly cashflow
- —
- DSCR
- —
- Eligible?
- —
Personal DTI + credit; lowest rate.
DSCR
20% down · 8.5% · 30yr
- Down + closing
- —
- Monthly P&I
- —
- Monthly cashflow
- —
- DSCR
- —
- Eligible?
- —
No personal income docs; deal must DSCR.
Hard money
10% down · 12.0% · 12mo
- Down + closing
- —
- Monthly P&I
- —
- Monthly cashflow
- —
- DSCR
- —
- Eligible?
- —
Short-term bridge; refi at stabilization.
Rent comps 8 comps
| Address | Beds | Baths | Sqft | Rent | $/sqft | DOM | Units | Dist |
|---|---|---|---|---|---|---|---|---|
| 38 Whitebark Ln Bluffton, SC | 2.0 | 2.0 | 1566 | $2,500 | $1.60 | 13d | 1 | 0.60mi |
| 37 Nesting Ln Bluffton, SC | 2.0 | 2.0 | 1158 | $2,350 | $2.03 | 13d | 1 | 0.74mi |
| 278 Landing Ln Bluffton, SC | 2.0 | 2.0 | 1586 | $2,730 | $1.72 | 20d | 1 | 1.08mi |
| 68 Slater St Okatie, SC | 3.0 | 2.5 | 1600 | $2,700 | $1.69 | 43d | 1 | 1.29mi |
| 28 Darby Creek Ct Bluffton, SC | 2.0 | 2.0 | 1488 | $2,350 | $1.58 | 43d | 1 | 1.32mi |
| 309 Hampton Pl Bluffton, SC | 2.0 | 2.0 | 1633 | $3,200 | $1.96 | 13d | 1 | 1.38mi |
| 314 Gibbet Rd Bluffton, SC | 1.0–3.0 | 1.0–2.0 | 1015 | $3,032 | $2.99 | 13d | 21 | 1.44mi |
| 17 Thomas Bee Dr Bluffton, SC | 3.0 | 2.0 | 1848 | $3,000 | $1.62 | 13d | 1 | 1.46mi |
Listing history 21 events
-
2026-06-18days on market $350,000 Active 139 DOM
-
2026-06-17days on market $350,000 Active 138 DOM
-
2026-06-16days on market $350,000 Active 137 DOM
-
2026-06-15days on market $350,000 Active 136 DOM
-
2026-06-14days on market $350,000 Active 134 DOM
-
2026-06-13days on market $350,000 Active 133 DOM
-
2026-06-10days on market $350,000 Active 131 DOM
-
2026-06-09days on market $350,000 Active 130 DOM
-
2026-06-08days on market $350,000 Active 129 DOM
-
2026-06-07days on market $350,000 Active 128 DOM
-
2026-06-05days on market $350,000 Active 125 DOM
-
2026-06-03days on market $350,000 Active 124 DOM
-
2026-06-02days on market $350,000 Active 123 DOM
-
2026-06-01days on market $350,000 Active 122 DOM
-
2026-05-31days on market $350,000 Active 121 DOM
-
2026-04-13price $350,000 903-char remark
Show marketing remark (903 chars)
Furnished and mοve‐in rеаdy, this wеll‐maintained 3-bedroom, 2-bаth Ηeather model offers a bright, open layout and an exceptional private backyard setting. The spacious family room comfortably accommodates both living and dining areas, creating a flexible and inviting main living space. The primary suite features a bay window overlooking an oversized, wooded backyard, providing privacy and a peaceful natural view. Enjoy wildlife sightings-including deer and wild turkeys-from the enclosed Carolina room, which opens to a small patio ideal for outdoor seating. The eat-in kitchen offers generous counter space, well-suited for everyday cooking or entertaining. Located in Sun City, this home is ideal for immediate occupancy or as a seasonal residence while transitioning from a northern home. A comfortable, low-maintenance option for those seeking a ready-to-enjoy Lowcountry lifestyle.
-
2026-01-30$360,000 Active 903-char remark
Show marketing remark (903 chars)
Furnished and mοve‐in rеаdy, this wеll‐maintained 3-bedroom, 2-bаth Ηeather model offers a bright, open layout and an exceptional private backyard setting. The spacious family room comfortably accommodates both living and dining areas, creating a flexible and inviting main living space. The primary suite features a bay window overlooking an oversized, wooded backyard, providing privacy and a peaceful natural view. Enjoy wildlife sightings-including deer and wild turkeys-from the enclosed Carolina room, which opens to a small patio ideal for outdoor seating. The eat-in kitchen offers generous counter space, well-suited for everyday cooking or entertaining. Located in Sun City, this home is ideal for immediate occupancy or as a seasonal residence while transitioning from a northern home. A comfortable, low-maintenance option for those seeking a ready-to-enjoy Lowcountry lifestyle.
-
2025-03-06status Active
-
2025-01-23price $359,000
-
2024-12-28price $364,000
-
2024-10-24$370,000 Active
ⓘ Source: listings_history table (triggers on properties + properties_extension) + one-shot
backfill from property_details.listing_events for pre-trigger history.
Tax reassessment forecast SC · Resets to sale price
- Current annual tax
- $3,222 · $269/mo
- Projected year-2 tax
- $3,222 · $269/mo
- Expected delta
- $0/yr ($0/mo · 0.0%)
ⓘ Screening estimate from a state-policy table — verify with the county assessor before closing.
Climate risk First Street
- Flood 1/10 Low FEMA zone X (unshaded) · 0% chance over 30 yrs
- Wildfire 3/10 Moderate
- Heat 9/10 Extreme 7 d/yr ≥108°F today · 17 d/yr by 30 yrs out
- Wind 8/10 Severe 99% chance of damaging wind over 30 yrs
- Air quality 2/10 Low 2 unhealthy d/yr today · 2 by 30 yrs out
Nearby sold comps map
Loading sold comps map…
Walkable amenities ~0.75 mi
Loading nearby amenities…
Taxation est. · year 1
- Rental income
- $34,829
- − Mortgage interest
- −$19,605
- − Property taxes
- −$3,222
- − Insurance
- −$1,750
- − Repairs & maintenance
- −$2,786
- − Management
- −$2,786
- − Depreciation
- −$10,182
- Taxable loss
- −$5,503
- Est. tax savings @ 24.0%
- +$1,321
- After-tax cash flow
- $1,838/yr
For passive investors: Depreciation is non-cash, so a rental often shows a tax loss while cash-flowing — sheltering income. Rental losses are passive: they offset passive income freely, and up to $25,000/yr can offset ordinary (W-2) income if you actively participate and your MAGI is under $100k (phasing out to $0 by $150k); unused losses carry forward. On sale, claimed depreciation is recaptured at up to 25%, and gains may owe capital-gains tax (a 1031 exchange can defer both). Figures are a year-1 estimate at your 24.0% rate — not tax advice; consult a CPA.
Schools (NCES district)
- District
- Beaufort 01
- NCES district ID
- 4501110
- Math proficiency
- 42% ▼ -8.00%
- Reading proficiency
- 51% ▲ 2.00%
- Median HH income
- $57,430
- Composite
- 40.56/100
- National rank
- #3699
- State rank
- #17 of 80 in SC
Livability — Bluffton
- Score
- 68/100
- State rank
- #76
- US rank
- #8936
Category grades
Schools grade is shown separately in the Schools card above.
Census & demographics
- County
- Beaufort County · 163,770 people
- City population
- 77,022
- Metro
- Hilton Head Island-Bluffton, SC
- Population (ZIP)
- 24,003
- Household income
- $91,294
- Rent vs Own
- Severe rent burden
- 268.0
Population outlook (Beaufort County) Hauer SSP2
- Today (2025)
- 211,915 people
- By 2030
- 227,272 · +7.2%
- By 2040
- 253,861 · +19.8%
- By 2050
- 275,126 · +29.8%
- By 2075
- 311,022 · +46.8%
- By 2100
- 321,286 · +51.6%
Race, ethnicity, and origin ACS 2023
- Neighborhood character
- Predominantly White (89%)
- Race & ethnicity
- White 89% Black 4% Hispanic / Latino 4% Two or more races 3% Asian 1%
- Common ancestry
- Romanian 5% Lithuanian 3% Slovak 2%
- Foreign-born
- 6% · Canada, Vietnam
- Languages at home
- 94% English-only · Spanish 2% Other Indo-European 1%
Political lean MEDSL · Beaufort
- 2024 margin
- R (+14.5) · D 42.1% · R 56.6% · Other 1.2%
- 2008→2024 swing
- -3.7pp toward R · 2008: -10.8pp · 2024: -14.5pp
- All cycles
- 2024: R+14.5 2020: R+10.0 2016: R+14.3 2012: R+17.5 2008: R+10.8
Not yet ingested
- Civics
- —
Market trends
- HPI YoY
- ▼ -27.99%
- Current HPI
- 196.0491
- Rent YoY
- ▲ 9.31%
- Metro
- Hilton Head Island-Bluffton, SC
- State GDP YoY
- ▲ 4.51%
- F500 in state
- 2
Industry mix (Fortune 500 HQ in SC)
| Industry | F500 HQs | Revenue |
|---|---|---|
| Packaging | 1 | $7B |
|
||
Price history
-5.4% since first listed6 events — show timeline
- 2026-04-13 Price Changed $350,000 RSMLS
- 2026-01-30 Listed $360,000 RSMLS
- 2025-03-06 Relisted — RSMLS
- 2025-01-23 Price Changed $359,000 RSMLS
- 2024-12-28 Price Changed $364,000 RSMLS
- 2024-10-24 Listed $370,000 RSMLS
Property tax history
+4.0%/yrLatest (2025): $3,222 · +1.7% YoY. Source: county tax records.
Cash-flow waterfall
monthlySold comps — $/sqft
last 12 mo · ≤1 miLoading sold comps…