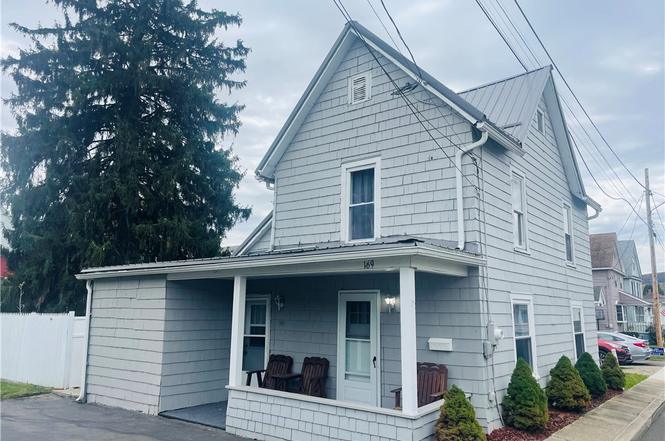
169 Leach Ave · Hornell, NY
Flood risk 1/10 · Minimal
- FEMA flood zone
- X (shaded)
- Chance of flooding over 30 yrs
- 0.0%
- Est. flood insurance / yr
- $473 – $860
Fire risk 3/10 · Minor
- Est. fire insurance / yr
- $691 – $1,283
Heat risk 3/10 · Minor
- Hot days now (above 92°F)
- 8 days/yr
- Hot days in 30 yrs
- 18 days/yr
Wind risk 1/10 · Minimal
- Chance of severe wind over 30 yrs
- —
Air-quality risk 1/10 · Minimal
- Unhealthy air days now
- 0 days/yr
- Unhealthy air days in 30 yrs
- 0 days/yr
Risk factors via First Street. Map © Google.
Why this score? — see what drove the B- grade
The composite is a weighted blend of 9 inputs, each scored 0–100. Each bar is that input's sub-score; the figure is the points it added to the 100-point composite (weight × sub-score).
- Cash flow +30.0/30.0
- DSCR +10.0/10.0
- 1% rule +8.1/10.0
- Appreciation +7.0/10.0
- Livability +3.5/5.0
- Schools +3.4/10.0
- Rent growth +2.5/5.0
- Condition / age +2.5/5.0
- ARV discount +0.0/15.0
$99,900
🖨 Deal sheet (PDF) 📄 Offer letter ✓ Due diligence
Listing remarks
This cozy 2-3 bedroom home has it all!! Easy one floor living with bedroom, full bath with laundry, kitchen, dining room and living room all on the first floor! Upstairs is a large bedroom with double closets and a spacious landing with large closet that could be a third bedroom or home office if needed! Vinyl windows, new flooring and fresh paint throughout. Complete appliance package with stove, refrigerator, dishwasher, washer and dryer that stay! Central air, updated electric and 6 yr old metal roof! Outside there is a double wide drive with plenty of parking as well as a one car garage and shed for extra storage. Fully fenced yard is perfect for pets and kids! Peaceful side porch and p
Key facts
- Vinyl windows
- Double closets
- Large bedroom
Tags
Neighborhood map
What this means for you Summary
Snapshot
- This is a 2-bed/1.0-bath single-family listed at $100k.
Deal economics
- At list price, monthly cash flow is $378 ($5k/yr) — positive.
- The deal already cash-flows at list — no discount required.
- Meets the 1% rule at list price ($1k rent vs $100k).
- Recommended offer: $91k (9.0% below list) — sets the bar for market timing.
Location & tenants
- Location reads 70/100 on livability (#451 in NY) — a middle-class / working-renter tenant base. Strengths: cost of living A+, housing A+, health & safety A+; Watch: amenities C-, schools D, crime F.
- Hornell City School District (town): math 33% / reading 49% proficiency, ranked #519 of 590 in NY (top 88%) — families likely to look elsewhere, expect single-tenant / working-renter base with shorter leases.
- Market conditions: 59 active listings in the ZIP; 196 units permitted in Steuben County in 2024 (0 in 5+ unit buildings).
Forward outlook
- In year one you build about $5k of equity ($691 loan paydown + $4k appreciation (4.0% local appreciation)).
- Steuben County population projected at -20% by 2050 — secular population decline; favor cash flow + early exit over multi-decade hold.
- At projected returns (4.0% appreciation + 3.0% rent growth), your $28k cash investment doubles in ~3 years — after that, you're playing with house money.
- By year 8, paydown + projected appreciation supports a ~$34k cash-out refi (75% LTV) — recoverable capital for the next deal without selling this one.
Negotiation context
- It's been on market 96 days — a 9% lower offer ($91k) is reasonable based on typical stale-listing flexibility.
Risks & watch-outs
- Watch-outs: built in 1880 — expect roof / HVAC / electrical / plumbing capex.
Questions for the listing agent
- It's been on market 96 days. Have you received any prior offers? Is the seller open to a 9% concession, seller financing, or rate buy-down credit?
- Built in 1880 — when were the roof, HVAC, electrical panel, plumbing, and water heater last replaced?
- Why hasn't it sold? Are there any deal-killer items the seller is aware of (foundation, flood, title, zoning, code violations)?
- Is there a deadline driving the sale (1031 exchange, divorce, estate, relocation)? That informs how much negotiation room exists.
- Schools are D-rated, which usually means shorter tenancies and higher turnover. Who's the typical renter profile here, and what's been the actual vacancy rate?
- Crime grade is F in this area — have there been break-ins, vandalism, or insurance claims at this property in the last 3 years? What carrier currently insures it and at what premium?
- What's the average days-on-market for RENTAL listings here right now (not sales)? A rising rental-DOM trend means longer vacancies and softer asking-rent achievability than the comps imply.
- What's the recent tenant-quality profile in this submarket — average credit score on applications, eviction rate, late-payment / NSF rate, and stable-employment percentage? A property-management company in the area should have these aggregated.
- How much new for-sale + rental construction is in the pipeline within 1–3 miles? Heavy new supply typically softens prices + rents 12–24 months out; constrained supply supports both.
Investment metrics
- 1% rule
- 1.31% ✓
- Cap rate
- 10.83%
- Cash-on-cash
- 16.21%
- DSCR
- 1.72
- GRM
- 6.3
CMA / ARV
- ARV (on-the-fly)
- $79,570
- Comps found
- 12
Show comp detail 12 sales within ~0.75 mi
| Address | Dist | Beds/Ba | Sqft | Sold | Price | $/sf | Match |
|---|---|---|---|---|---|---|---|
| 169 Leach Ave | 0.00mi | 2/1.0 | 1,090 (0%) | 1mo | $105,000 | $96 | 99 |
| 134 E Elm St | 0.17mi | 3/1.0 (+1) | 1,120 (+3%) | 4mo | $57,000 | $51 | 79 |
| 68 Catherine St | 0.15mi | 2/1.0 | 1,166 (+7%) | 3mo | $85,000 | $73 | 79 |
| 25 E Main St | 0.14mi | 3/1.0 (+1) | 1,164 (+7%) | 8mo | $114,900 | $99 | 71 |
| 30 Glen Ave | 0.21mi | 3/1.0 (+1) | 1,152 (+6%) | 9mo | $105,000 | $91 | 69 |
| 5 Blaine St | 0.34mi | 3/2.0 (+1) | 1,142 (+5%) | 1mo | $165,000 | $144 | 66 |
| 175 S Leach Ave | 0.02mi | 3/1.5 (+1) | 1,248 (+14%) | 4mo | $22,501 | $18 | 64 |
| 176 Greeley Ave | 0.43mi | 3/1.0 (+1) | 1,204 (+10%) | 1mo | $115,000 | $96 | 57 |
| 422 Monroe Ave | 0.62mi | 2/1.0 | 1,008 (-8%) | 8mo | $64,000 | $63 | 52 |
| 233 Vincent St | 0.73mi | 2/1.0 | 1,071 (-2%) | 18mo | $69,000 | $64 | 48 |
| 19 Oconnor Ave | 0.54mi | 3/1.5 (+1) | 1,216 (+12%) | 8mo | $65,000 | $53 | 42 |
| 48 Bemis Ave | 0.66mi | 3/1.0 (+1) | 1,230 (+13%) | 8mo | $55,000 | $45 | 36 |
Match score weights: distance 35% · size 25% · config 20% · recency 20%. Top-matched comps best support the ARV.
Projected returns pro-forma
3.95% appreciation · 3.0% rent growth · sell at horizon
- IRR
- 24.7%
- Equity multiple
- 2.47×
- Total profit
- $41,206
- Equity at exit
- $50,346
- IRR
- 24.7%
- Equity multiple
- 4.82×
- Total profit
- $106,919
- Equity at exit
- $82,103
Cash invested: $27,972 (down + closing). Projections, not guarantees.
Landlord ↔ Tenant lean methodology
- Overall (STATE)
- 15 Strongly Tenant-Friendly
- State New York
- 15 Strongly Tenant-Friendly · D+10
- County
- — inherits STATE
- City
- — inherits STATE
ZIP-level market 14843
- Home prices YoY
- 1.9%
- Active inventory
- 59
- Price-to-rent
- 6.3×
Monthly cashflow live
- Estimated rent
- $1,313 medium interval (Pro) →
- Mortgage (P&I)
- −$524
- Tax from tax record
- −$94 /mo · $1,128/yr
- Insurance
- −$42
- HOA
- −$0
- Vacancy / Maint / Mgmt
- −$276
- Net cashflow
- $378
Break-even live
Sensitivity live
| Price | -10% $434 | -5% $406 | +0% $378 | +5% $350 | +10% $321 |
|---|---|---|---|---|---|
| Rent | -10% $274 | -5% $326 | +0% $378 | +5% $430 | +10% $482 |
| Rate | -1.0pp $428 | -0.5pp $403 | base $378 | +0.5pp $352 | +1.0pp $326 |
UW: 25.0% down · 7.5% · 30yr · 1.5% tax · 5.0% vac · 8.0% maint · 8.0% mgmt
Financing live
Cash to close
- Down payment
- $24,975
- Closing costs
- $2,997
- Reserves months
- —
- Total cash needed
- —
Loan-product check · same deal, 3 products live
Conventional
25% down · 7.5% · 30yr
- Down + closing
- —
- Monthly P&I
- —
- Monthly cashflow
- —
- DSCR
- —
- Eligible?
- —
Personal DTI + credit; lowest rate.
DSCR
20% down · 8.5% · 30yr
- Down + closing
- —
- Monthly P&I
- —
- Monthly cashflow
- —
- DSCR
- —
- Eligible?
- —
No personal income docs; deal must DSCR.
Hard money
10% down · 12.0% · 12mo
- Down + closing
- —
- Monthly P&I
- —
- Monthly cashflow
- —
- DSCR
- —
- Eligible?
- —
Short-term bridge; refi at stabilization.
Listing history 5 events
-
2026-01-26status Pending
-
2026-01-11historical Active Under Contract
-
2025-11-25price $99,900
-
2025-11-12price $104,900
-
2025-10-22$109,900 Active
ⓘ Source: listings_history table (triggers on properties + properties_extension) + one-shot
backfill from property_details.listing_events for pre-trigger history.
Tax reassessment forecast NY · Partial reset (capped growth)
- Current annual tax
- $1,128 · $94/mo
- Projected year-2 tax
- $1,408 · $117/mo
- Expected delta
- +$280/yr (+$23/mo · 24.8%)
ⓘ Screening estimate from a state-policy table — verify with the county assessor before closing.
Climate risk First Street
- Flood 1/10 Low FEMA zone X (shaded) · 0% chance over 30 yrs
- Wildfire 3/10 Moderate
- Heat 3/10 Moderate 8 d/yr ≥92°F today · 18 d/yr by 30 yrs out
- Wind 1/10 Low
- Air quality 1/10 Low 0 unhealthy d/yr today · 0 by 30 yrs out
Nearby sold comps map
Loading sold comps map…
Walkable amenities ~0.75 mi
Loading nearby amenities…
Taxation est. · year 1
- Rental income
- $15,758
- − Mortgage interest
- −$5,596
- − Property taxes
- −$1,128
- − Insurance
- −$500
- − Repairs & maintenance
- −$1,261
- − Management
- −$1,261
- − Depreciation
- −$2,906
- Taxable income
- $3,107
- Est. tax owed @ 24.0%
- −$746
- After-tax cash flow
- $3,789/yr
For passive investors: Depreciation is non-cash, so a rental often shows a tax loss while cash-flowing — sheltering income. Rental losses are passive: they offset passive income freely, and up to $25,000/yr can offset ordinary (W-2) income if you actively participate and your MAGI is under $100k (phasing out to $0 by $150k); unused losses carry forward. On sale, claimed depreciation is recaptured at up to 25%, and gains may owe capital-gains tax (a 1031 exchange can defer both). Figures are a year-1 estimate at your 24.0% rate — not tax advice; consult a CPA.
Schools (NCES district)
- District
- Hornell City School District
- NCES district ID
- 3614820
- Math proficiency
- 33% ▼ -8.00%
- Reading proficiency
- 49% ▲ 6.00%
- Median HH income
- $40,251
- Composite
- 34.33/100
- National rank
- #5234
- State rank
- #519 of 590 in NY
Livability — Hornell
- Score
- 70/100
- State rank
- #451
- US rank
- #7888
Category grades
Schools grade is shown separately in the Schools card above.
Census & demographics
- Census place
- Hornell, NY
- County
- Steuben County · 41,193 people
- City population
- 12,383
- Metro
- Corning, NY
- Population (ZIP)
- 12,383
- Household income
- $57,874
- Rent vs Own
- Severe rent burden
- 415.0
Population outlook (Steuben County) Hauer SSP2
- Today (2025)
- 93,062 people
- By 2030
- 89,793 · -3.5%
- By 2040
- 82,353 · -11.5%
- By 2050
- 74,286 · -20.2%
- By 2075
- 55,589 · -40.3%
- By 2100
- 37,587 · -59.6%
Race, ethnicity, and origin ACS 2023
- Neighborhood character
- Predominantly White (92%)
- Race & ethnicity
- White 92% Two or more races 3% Hispanic / Latino 3% Black 2%
- Common ancestry
- Lithuanian 3% Romanian 2% Iranian 2%
- Foreign-born
- 4% · Canada
- Languages at home
- 95% English-only · French/Haitian/Cajun 2% Arabic 1% Spanish 1%
Political lean MEDSL · Steuben
- 2024 margin
- Solid R (+31.8) · D 34.1% · R 65.9%
- 2008→2024 swing
- -15.0pp toward R · 2008: -16.8pp · 2024: -31.8pp
- All cycles
- 2024: R+31.8 2020: R+29.6 2016: R+36.2 2012: R+16.4 2008: R+16.8
Not yet ingested
- Civics
- —
Market trends
- HPI YoY
- ▲ 3.95%
- Current HPI
- 210.1986
- Rent YoY
- —
- Metro
- Corning, NY
- State GDP YoY
- ▲ 2.60%
- F500 in state
- 92
Industry mix (Fortune 500 HQ in NY)
| Industry | F500 HQs | Revenue |
|---|---|---|
| Financial Services | 10 | $950B |
|
||
| Consumer Goods | 9 | $162B |
|
||
| Insurance | 4 | $225B |
|
||
| Telecommunications | 2 | $144B |
|
||
| Pharmaceuticals | 2 | $112B |
|
||
| Media / Entertainment | 2 | $69B |
|
||
Price history
-9.1% since first listed5 events — show timeline
- 2026-01-26 Pending — UNYREIS
- 2026-01-11 Contingent — UNYREIS
- 2025-11-25 Price Changed $99,900 UNYREIS
- 2025-11-12 Price Changed $104,900 UNYREIS
- 2025-10-22 Listed $109,900 UNYREIS
Property tax history
+0.0%/yrLatest (2025): $1,128 · -0.4% YoY. Source: county tax records.
Cash-flow waterfall
monthlySold comps — $/sqft
last 12 mo · ≤1 miLoading sold comps…