 Fourplex
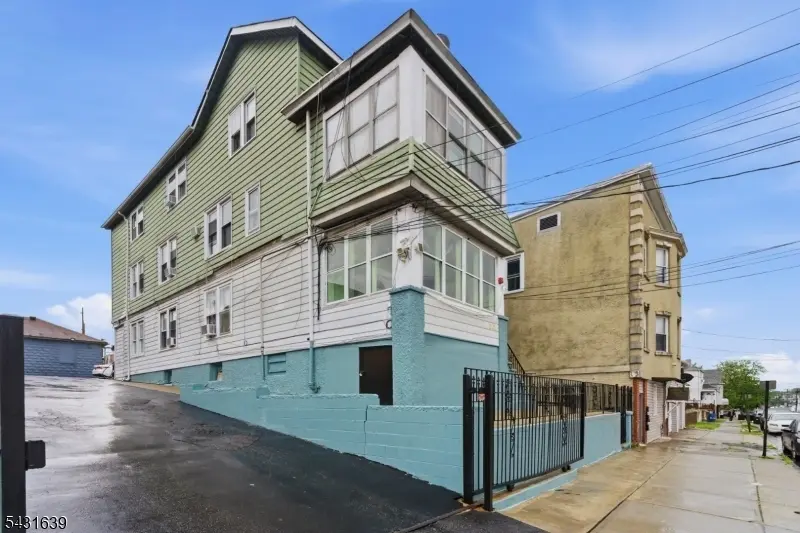
215 217 E 16Th St #3 · Paterson, NJ
Flood risk 1/10 · Minimal
- FEMA flood zone
- X (unshaded)
- Chance of flooding over 30 yrs
- 0.0%
- Est. flood insurance / yr
- $507 – $1,088
Fire risk 1/10 · Minimal
- Est. fire insurance / yr
- $526 – $976
Heat risk 7/10 · Major
- Hot days now (above 100°F)
- 7 days/yr
- Hot days in 30 yrs
- 15 days/yr
Wind risk 6/10 · Moderate
- Chance of severe wind over 30 yrs
- 27.0%
Air-quality risk 4/10 · Minor
- Unhealthy air days now
- 3 days/yr
- Unhealthy air days in 30 yrs
- 5 days/yr
Risk factors via First Street. Map © Google.
Why this score? — see what drove the C- grade
The composite is a weighted blend of 9 inputs, each scored 0–100. Each bar is that input's sub-score; the figure is the points it added to the 100-point composite (weight × sub-score).
- Cash flow +17.8/30.0
- ARV discount +7.5/15.0
- DSCR +5.6/10.0
- Appreciation +5.0/10.0
- 1% rule +4.8/10.0
- Livability +3.5/5.0
- Rent growth +2.5/5.0
- Condition / age +2.2/5.0
- Schools +1.3/10.0
$899,999
🖨 Deal sheet 📄 Offer letter ✓ Due diligence
Multi-family units
County records classify this as Multi-Family (2-4 Unit). Listing-text estimate: 4 units. confirmed
Listing remarks
Well-maintained multi-family property featuring three residential units plus a fully finished walkout basement with additional living space. All units offer spacious, well-proportioned layouts with separate living and dining rooms, providing strong rental functionality and comfortable living space. Unit 1 features 3 bedrooms, 1 full bath, a spacious living room, dining room, and kitchen. Unit 2 offers 3 bedrooms, 1 full bath, with a spacious living room, dining room, and kitchen layout. Unit 3 includes 3 bedrooms, 1 full bath, living room, dining room, and kitchen, offering a functional layout with generous space. The fully finished walkout basement includes 2 bedrooms, 2 full baths, and al
Key facts
- Separate utilities
- Two-car wide parking
- Long driveway
Tags
Property features AI
Finance
- Other: Unit 1: owner pays water; tenants pay gas and heat (rent listed as 0; security deposit $2); Unit 2: owner pays water; tenants pay gas and heat (rent listed as 0); Unit 3: owner pays water; tenants pay gas and heat (rent listed as 0)
- Financial info: Three-unit property; Net operating income, gross operating income, and operating expenses listed as 0
Exterior
- Parking: Off-street parking with driveway (2-car width, driveway-exclusive); One parking space listed
- Utilities: Public water (with additional details in remarks); Public sewer (with additional details in remarks)
- Home design: Three-story unit style
- Construction: Vinyl siding construction
- Exterior features: Vinyl siding; Roof details provided in remarks; No easements
Interior
- Kitchen: Gas range/oven in each unit
- Bedrooms: Three bedrooms in Unit 1; Three bedrooms in Unit 2; Three bedrooms in Unit 3
- Bathrooms: Five full bathrooms (total for property); One bathroom in each Unit 1, 2 and 3
- Heating & cooling: Hot water radiators (three heating units); Natural gas heating (and additional details in remarks); Wall A/C units
- Interior features: Finished walkout basement; Carbon monoxide detectors installed; Water heater details provided in remarks
- Laundry & utility: Utilities and other details referenced in remarks
Neighborhood map
What this means for you Summary
Snapshot
- This is a 3×3bd/1ba + 1×2bd/2ba units multifamily listed at $900k. Condition is rated fair.
Deal economics
- At list price, monthly cash flow is $745 ($9k/yr) — positive. Per door: $186/mo.
- The deal already cash-flows at list — no discount required.
- To meet the 1% rule (rent ≥ 1% of price), the offer needs to be $882k (2.0% below list).
- Recommended offer: $882k (2.0% below list) — sets the bar for 1% rule.
- Cap rate 7.3% vs local median 3.4% in Paterson — top-decile yield for the area; either an underpriced asset or a hidden risk that comps aren't pricing in. Stress-test before assuming the spread holds.
Location & tenants
- Location reads 69/100 on livability (#293 in NJ) — a middle-class / working-renter tenant base. Strengths: amenities A+, commute A+, health & safety A; Watch: schools D, employment D, crime F.
- Paterson Public School District (suburban): math 6% / reading 26% proficiency, ranked #458 of 472 in NJ (top 97%) — low school quality limits family demand, transient renter base, plan for 1-2y turnover; 83% free/reduced lunch — lower-income household profile, screen leases tightly.
- Market conditions: 1 active listings in the ZIP; 860 units permitted in Passaic County in 2024 (614 in 5+ unit buildings).
Forward outlook
- In year one you build about $33k of equity ($6k loan paydown + $27k appreciation (3.0% local appreciation)).
- Passaic County population projected at +5% by 2050 — modest demand growth; plan on rents tracking national, not racing it.
- At projected returns (3.0% appreciation + 3.0% rent growth), your $252k cash investment doubles in ~6 years — after that, you're playing with house money.
- By year 2, paydown + projected appreciation supports a ~$54k cash-out refi (75% LTV) — recoverable capital for the next deal without selling this one.
Negotiation context
- It's been on market 22 days — a 2% lower offer ($886k) is reasonable based on typical stale-listing flexibility.
Risks & watch-outs
- Watch-outs: built in 1950 — expect roof / HVAC / electrical / plumbing capex.
- Climate carrying-cost: major wind risk, 27% chance of damaging wind over 30y; extreme-heat days projected 7→15/yr by 2055 (HVAC capex compounding) — expect insurance premiums to compound above CPI over the hold.
Questions for the listing agent
- Can we see the unit-by-unit rent roll, current vacancy, and any below-market leases? What's the average tenancy length?
- What capital expenditures (roof, boiler, parking lot, exteriors) have been made in the last 5 years, and what's planned in the next 2?
- Have any recent inspections been done? Can we get a copy of the seller's disclosures and any deferred-maintenance estimates?
- Built in 1950 — when were the roof, HVAC, electrical panel, plumbing, and water heater last replaced?
- Is there a deadline driving the sale (1031 exchange, divorce, estate, relocation)? That informs how much negotiation room exists.
- Schools are D-rated, which usually means shorter tenancies and higher turnover. Who's the typical renter profile here, and what's been the actual vacancy rate?
- Crime grade is F in this area — have there been break-ins, vandalism, or insurance claims at this property in the last 3 years? What carrier currently insures it and at what premium?
- What's the average days-on-market for RENTAL listings here right now (not sales)? A rising rental-DOM trend means longer vacancies and softer asking-rent achievability than the comps imply.
- What's the recent tenant-quality profile in this submarket — average credit score on applications, eviction rate, late-payment / NSF rate, and stable-employment percentage? A property-management company in the area should have these aggregated.
- How much new apartment / multifamily construction is in the pipeline within 1–3 miles? Heavy new supply (>2% of stock underway) typically softens rents 12–24 months out; light construction supports rent growth.
Investment metrics
- 1% rule
- 0.98% ✗
- Cap rate
- 7.29%
- Cash-on-cash
- 3.55%
- DSCR
- 1.16
- GRM
- 8.5
CMA / ARV
No comps found within radius.
Show comp detail 6 sales within ~0.75 mi
| Address | Dist | Beds/Ba | Sqft | Sold | Price | $/sf | Match |
|---|---|---|---|---|---|---|---|
| 255 5th Ave | 0.33mi | 12/4.0 | — | 7mo | $915,000 | — | 63 |
| 69 Graham Ave | 0.36mi | 11/3.0 (-1) | — | 14mo | $675,000 | — | 47 |
| 100-102 Warren St | 0.38mi | 11/4.0 (-1) | — | 18mo | $725,000 | — | 46 |
| 204 Governor St | 0.66mi | 12/3.0 | — | 5mo | $755,000 | — | 46 |
| 450-452 E 26th St | 0.58mi | 12/4.0 | — | 14mo | $850,000 | — | 45 |
| 64 Warren St | 0.45mi | 11/4.0 (-1) | — | 18mo | $825,000 | — | 43 |
Match score weights: distance 35% · size 25% · config 20% · recency 20%. Top-matched comps best support the ARV.
Projected returns pro-forma
3.0% appreciation · 3.0% rent growth · sell at horizon
- IRR
- 10.8%
- Equity multiple
- 1.62×
- Total profit
- $155,997
- Equity at exit
- $404,679
- IRR
- 13.1%
- Equity multiple
- 2.94×
- Total profit
- $489,165
- Equity at exit
- $623,658
Cash invested: $252,000 (down + closing). Projections, not guarantees.
Landlord ↔ Tenant lean methodology
- Overall (STATE)
- 21 Tenant-Leaning
- State New Jersey
- 21 Tenant-Leaning · D+6
- County
- — inherits STATE
- City
- — inherits STATE
ZIP-level market 07524-2008
- Active inventory
- 1
- Price-to-rent
- 33.3×
Monthly cashflow live
- Estimated rent
- $8,816 high interval (Pro) →
- Mortgage (P&I)
- −$4,720
- Tax est. 1.5%
- −$1,125 /mo · $13,500/yr
- Insurance
- −$375
- HOA
- −$0
- Vacancy / Maint / Mgmt
- −$1,851
- Net cashflow
- $745
Break-even live
4-unit breakdown (identical units grouped — click to expand)
| Units | Beds | Baths | Est. rent |
|---|---|---|---|
| 3× units | 3 | 1 | $6,750 |
| #1 | 3 | 1 | $2,250 |
| #2 | 3 | 1 | $2,250 |
| #3 | 3 | 1 | $2,250 |
| 1× unit | 2 | 2 | $2,066 |
| Total (4 units) | $8,816 | ||
UW: 25.0% down · 7.5% · 30yr · 1.5% tax · 5.0% vac · 8.0% maint · 8.0% mgmt
Financing live
Cash to close
- Down payment
- $225,000
- Closing costs
- $27,000
- Reserves months
- —
- Total cash needed
- —
Loan-product check · same deal, 3 products live
Conventional
25% down · 7.5% · 30yr
- Down + closing
- —
- Monthly P&I
- —
- Monthly cashflow
- —
- DSCR
- —
- Eligible?
- —
Personal DTI + credit; lowest rate.
DSCR
20% down · 8.5% · 30yr
- Down + closing
- —
- Monthly P&I
- —
- Monthly cashflow
- —
- DSCR
- —
- Eligible?
- —
No personal income docs; deal must DSCR.
Hard money
10% down · 12.0% · 12mo
- Down + closing
- —
- Monthly P&I
- —
- Monthly cashflow
- —
- DSCR
- —
- Eligible?
- —
Short-term bridge; refi at stabilization.
Listing history 6 events
-
2026-06-04days on market $899,999 Active 22 DOM
-
2026-06-03days on market $899,999 Active 21 DOM
-
2026-06-02days on market $899,999 Active 20 DOM
-
2026-06-01days on market $899,999 Active 19 DOM
-
2026-05-31days on market $899,999 Active 18 DOM
-
2026-05-12$899,999 Active
ⓘ Source: listings_history table (triggers on properties + properties_extension) + one-shot
backfill from property_details.listing_events for pre-trigger history.
Climate risk First Street
- Flood 1/10 Low FEMA zone X (unshaded) · 0% chance over 30 yrs
- Wildfire 1/10 Low
- Heat 7/10 Severe 7 d/yr ≥100°F today · 15 d/yr by 30 yrs out
- Wind 6/10 Major 27% chance of damaging wind over 30 yrs
- Air quality 4/10 Moderate 3 unhealthy d/yr today · 5 by 30 yrs out
Nearby sold comps map
Loading sold comps map…
Walkable amenities ~0.75 mi
Loading nearby amenities…
Taxation est. · year 1
- Rental income
- $105,792
- − Mortgage interest
- −$50,414
- − Property taxes
- −$13,500
- − Insurance
- −$4,500
- − Repairs & maintenance
- −$8,463
- − Management
- −$8,463
- − Depreciation
- −$26,182
- Taxable loss
- −$5,730
- Est. tax savings @ 24.0%
- +$1,375
- After-tax cash flow
- $10,315/yr
For passive investors: Depreciation is non-cash, so a rental often shows a tax loss while cash-flowing — sheltering income. Rental losses are passive: they offset passive income freely, and up to $25,000/yr can offset ordinary (W-2) income if you actively participate and your MAGI is under $100k (phasing out to $0 by $150k); unused losses carry forward. On sale, claimed depreciation is recaptured at up to 25%, and gains may owe capital-gains tax (a 1031 exchange can defer both). Figures are a year-1 estimate at your 24.0% rate — not tax advice; consult a CPA.
Condition & rehab AI · 13 photos
A multi-family property with fair condition, requiring moderate repairs and maintenance to improve its resale and rental value.
Repairs flagged
- Minor Kitchen cabinets — Slight wear
- Minor Bathroom vanity — Slight wear
- Moderate Exterior siding — Needs repainting
- Moderate Exterior trim — Needs repainting
Value-add opportunities
- Both Paint exterior — Enhances curb appeal and value
- Both Replace worn kitchen cabinets — Improves functionality and aesthetics
- Both Replace worn bathroom vanity — Improves functionality and aesthetics
- Both Landscaping and curb appeal — Enhances curb appeal and value
Renovation cost estimate screening
| Repair item | Severity | Est. cost |
|---|---|---|
| Kitchen cabinets · Slight wear | Minor | $500–3,000 |
| Bathroom vanity · Slight wear | Minor | $500–3,000 |
| Exterior siding · Needs repainting | Moderate | $3,000–15,000 |
| Exterior trim · Needs repainting | Moderate | $3,000–15,000 |
| Total estimated repair cost · 4 items | $7,000–36,000 |
Value-add ROI direction
- Both Paint exterior — Enhances curb appeal and value ↑
- Both Replace worn kitchen cabinets — Improves functionality and aesthetics ↑
- Both Replace worn bathroom vanity — Improves functionality and aesthetics ↑
- Both Landscaping and curb appeal — Enhances curb appeal and value ↑
ⓘ Cost ranges are severity-bucket heuristics (US national rule-of-thumb). Get contractor quotes + a written scope before underwriting a rehab budget.
Schools (NCES district)
- District
- Paterson Public School District
- NCES district ID
- 3412690
- Math proficiency
- 6% ▼ -12.00%
- Reading proficiency
- 26% ▼ -4.00%
- Median HH income
- $34,365
- Composite
- 13.02/100
- National rank
- #9568
- State rank
- #458 of 472 in NJ
Livability — Paterson
- Score
- 69/100
- State rank
- #293
- US rank
- #8763
Category grades
Schools grade is shown separately in the Schools card above.
Census & demographics
- Census place
- Paterson, NJ
Population outlook (Passaic County) Hauer SSP2
- Today (2025)
- 525,915 people
- By 2030
- 532,160 · +1.2%
- By 2040
- 543,670 · +3.4%
- By 2050
- 554,326 · +5.4%
- By 2075
- 584,728 · +11.2%
- By 2100
- 598,978 · +13.9%
Not yet ingested
- Political lean
- —
- Race & ethnicity
- —
- Common origin
- —
- Civics
- —
Market trends
- HPI YoY
- —
- Current HPI
- —
- Rent YoY
- —
- Metro
- —
- State GDP YoY
- ▲ 2.05%
- F500 in state
- 34
Industry mix (Fortune 500 HQ in NJ)
| Industry | F500 HQs | Revenue |
|---|---|---|
| Consumer Goods | 3 | $31B |
|
||
| Pharmaceuticals | 2 | $153B |
|
||
| Technology | 2 | $21B |
|
||
| Insurance | 2 | $20B |
|
||
| Healthcare | 2 | $19B |
|
||
| Financial Services | 1 | $70B |
|
||
Price history
1 event — show timeline
- 2026-05-12 Listed $899,999 GSMLS
Cash-flow waterfall
monthlySold comps — $/sqft
last 12 mo · ≤1 miLoading sold comps…