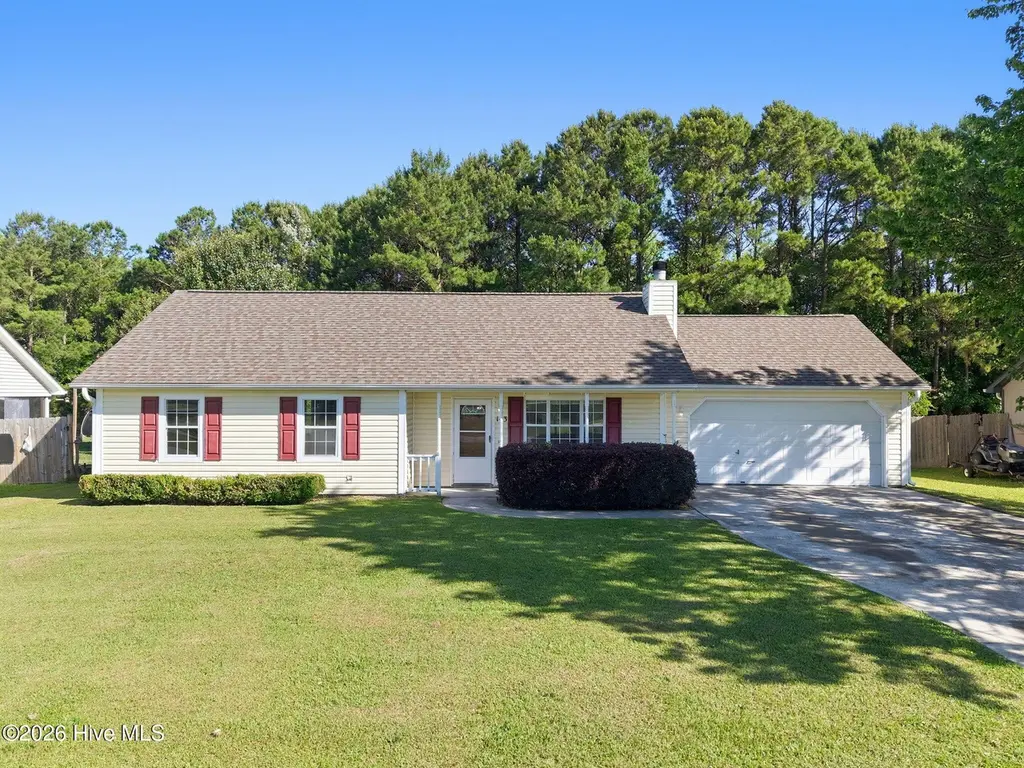
143 Glenwood Dr · Swansboro, NC
Flood risk 1/10 · Minimal
- FEMA flood zone
- X (unshaded)
- Chance of flooding over 30 yrs
- 0.0%
- Est. flood insurance / yr
- $507 – $1,088
Fire risk 4/10 · Minor
- Est. fire insurance / yr
- $906 – $1,684
Heat risk 9/10 · Severe
- Hot days now (above 105°F)
- 7 days/yr
- Hot days in 30 yrs
- 19 days/yr
Wind risk 8/10 · Major
- Chance of severe wind over 30 yrs
- 99.0%
Air-quality risk 2/10 · Minimal
- Unhealthy air days now
- 0 days/yr
- Unhealthy air days in 30 yrs
- 2 days/yr
Risk factors via First Street. Map © Google.
Why this score? — see what drove the D grade
The composite is a weighted blend of 9 inputs, each scored 0–100. Each bar is that input's sub-score; the figure is the points it added to the 100-point composite (weight × sub-score).
- Cash flow +13.0/30.0
- ARV discount +9.4/15.0
- DSCR +3.9/10.0
- Schools +3.9/10.0
- Livability +3.9/5.0
- Rent growth +3.2/5.0
- 1% rule +2.5/10.0
- Condition / age +2.5/5.0
- Appreciation +0.0/10.0
$233,000
🖨 Deal sheet 📄 Offer letter ✓ Due diligence
Listing remarks
Beautifully updated 3-bedroom, 2-bath home featuring fresh upgrades throughout! Recent improvements include new exterior light fixtures, a new living room ceiling fan, new low-profile microwave, fresh paint on the walls, doors, and trim, plus brand-new LVP flooring and carpet. Enjoy the freedom of no HOA and no city taxes while still being conveniently located just a short drive from local beaches, shopping, dining, and military bases
Key facts
- New carpet
- New lvp flooring
- 0.27 acre lot
Tags
Property features AI
Finance
- Other: Zoning: R-10; Directions: From Sandridge Road, turn onto Buckhead Road, then take a left onto Glenwood Drive. Continue down Glenwood Drive to 143 Glenwood Drive, Hubert, NC 28539.
- HOA & community: Located in Foxtrace subdivision
Exterior
- Parking: On-site garage; Attached 2-car garage; 2 parking spaces total
- Utilities: Sewer connected; Water connected
- Home design: Single-family residence; One level / one story; Entry level: 1
- Construction: Vinyl siding with frame construction; Shingle/composition roof; Slab foundation; Built on lot sized approximately 0.27 acres (86 x 133 x 84 x 133)
- Exterior features: Patio; Porch; Partial fencing; Has a view; Paved road access
Interior
- Bedrooms: Total rooms: 5
- Bathrooms: 2 full bathrooms
- Heating & cooling: Central air conditioning; Electric forced air heating
- Interior features: Ceiling fan(s); Window coverings
Neighborhood map
What this means for you Summary
Snapshot
- This is a 3-bed/2.0-bath single-family listed at $233k.
Deal economics
- At list price, monthly cash flow is $-15 ($-174/yr) — negative.
- To cash-flow at today's rent, offer at most $230k (1.1% below list).
- To meet the 1% rule (rent ≥ 1% of price), the offer needs to be $176k (24.5% below list).
- Recommended offer: $176k (24.5% below list) — sets the bar for 1% rule.
- Cap rate 6.2% vs local median 3.5% in Swansboro — top-decile yield for the area; either an underpriced asset or a hidden risk that comps aren't pricing in. Stress-test before assuming the spread holds.
Location & tenants
- Location reads 77/100 on livability (#32 in NC, #3,124 nationally) — a middle-class / working-renter tenant base. Strengths: housing A+, health & safety A+, crime A; Watch: amenities F, commute F.
- Onslow County Schools (other): math 42% / reading 49% proficiency, ranked #84 of 178 in NC (top 47%) — families likely to look elsewhere, expect single-tenant / working-renter base with shorter leases.
- Zoned schools: Sand Ridge Elementary (math 57% / reading 54%, grade C, #293 of 1,410 statewide, top 21%, 581 students, 58% FRL); Swansboro Middle (math 52% / reading 55%, grade C+, #87 of 475 statewide, top 19%, 967 students, 43% FRL); Swansboro High (math 77% / reading 68%, grade B+, #104 of 535 statewide, top 19%, 1,115 students, 38% FRL).
- Zoned-school proficiency averages 60% at this address vs 46% district-wide (+15 pts) — the actual schools serving this property are materially stronger than the Onslow County Schools average implies; a family-tenant draw the district grade alone would hide.
- Market conditions: Rents rising (+2.6%/yr); 322 active listings in the ZIP; 7 comparable units currently listed for rent nearby; rentals at typical pace (median 21d on market — plan ~3-4 weeks tenant-placement turnaround); 1,246 units permitted in Onslow County in 2024 (0 in 5+ unit buildings).
- This rent runs 32% of the median local income ($67k/yr) — at the standard rent-burdened threshold; future hikes will face affordability resistance.
Forward outlook
- Local home prices are declining (-3.0%/yr); year-one equity from $2k of loan paydown is wiped out by about $7k of value loss. Plan a longer hold.
Negotiation context
- It's been on market 32 days — a 3% lower offer ($226k) is reasonable based on typical stale-listing flexibility.
- Current owner paid $140k; list at $233k implies a 66% gain — meaningful room to come down on a strong offer.
Risks & watch-outs
- Climate carrying-cost: severe wind risk, 99% chance of damaging wind over 30y; extreme-heat days projected 7→19/yr by 2055 (HVAC capex compounding) — expect insurance premiums to compound above CPI over the hold.
Questions for the listing agent
- What do current leases actually rent for vs. the listed asking? Can we see a recent rent roll and the last 12 months of T-12 income?
- It's been on market 32 days. Have you received any prior offers? Is the seller open to a 25% concession, seller financing, or rate buy-down credit?
- Is there a deadline driving the sale (1031 exchange, divorce, estate, relocation)? That informs how much negotiation room exists.
- The area grade is low — what's the realistic commute time and amenity access for the typical tenant pool here? Any planned neighborhood developments (good or bad) we should know about?
- What's the average days-on-market for RENTAL listings here right now (not sales)? A rising rental-DOM trend means longer vacancies and softer asking-rent achievability than the comps imply.
- What's the recent tenant-quality profile in this submarket — average credit score on applications, eviction rate, late-payment / NSF rate, and stable-employment percentage? A property-management company in the area should have these aggregated.
- How much new for-sale + rental construction is in the pipeline within 1–3 miles? Heavy new supply typically softens prices + rents 12–24 months out; constrained supply supports both.
Investment metrics
- 1% rule
- 0.75% ✗
- Cap rate
- 6.22%
- Cash-on-cash
- -0.27%
- DSCR
- 0.99
- GRM
- 11.0
CMA / ARV
- ARV (on-the-fly)
- $243,312
- Comps found
- 12
Show comp detail 12 sales within ~0.75 mi
| Address | Dist | Beds/Ba | Sqft | Sold | Price | $/sf | Match |
|---|---|---|---|---|---|---|---|
| 127 Glenwood Dr | 0.13mi | 3/2.0 | 1,051 (-4%) | 1mo | $250,000 | $238 | 86 |
| 142 Parnell Rd | 0.14mi | 3/2.0 | 1,050 (-4%) | 2mo | $235,000 | $224 | 85 |
| 405 Hooks Ln | 0.21mi | 3/2.0 | 1,052 (-4%) | 2mo | $236,500 | $225 | 81 |
| 412 Foxtrace Ln | 0.32mi | 3/2.0 | 1,085 (-1%) | 3mo | $238,400 | $220 | 81 |
| 203 Inman Ct | 0.23mi | 3/2.0 | 1,138 (+4%) | 3mo | $243,000 | $214 | 80 |
| 503 Amber Ave | 0.14mi | 3/2.0 | 1,201 (+10%) | 1mo | $275,000 | $229 | 77 |
| 183 Parnell Rd | 0.28mi | 3/2.0 | 1,040 (-5%) | 2mo | $269,500 | $259 | 77 |
| 601 Cannon Ct | 0.19mi | 3/2.0 | 1,184 (+8%) | 2mo | $257,000 | $217 | 76 |
| 266 Parnell Rd | 0.25mi | 3/2.0 | 1,198 (+9%) | 1mo | $260,000 | $217 | 72 |
| 104 Crown Point Rd | 0.55mi | 3/2.0 | 1,089 (-1%) | 2mo | $207,500 | $191 | 71 |
| 327 Buckhead Rd | 0.23mi | 3/2.0 | 1,249 (+14%) | 3mo | $265,000 | $212 | 64 |
| 502 Waldorf Ct | 0.61mi | 3/2.0 | 1,139 (+4%) | 3mo | $253,000 | $222 | 63 |
Match score weights: distance 35% · size 25% · config 20% · recency 20%. Top-matched comps best support the ARV.
Projected returns pro-forma
-3.0% appreciation · 2.61% rent growth · sell at horizon
- IRR
- -17.2%
- Equity multiple
- 0.40×
- Total profit
- $-39,469
- Equity at exit
- $34,741
- IRR
- -9.9%
- Equity multiple
- 0.41×
- Total profit
- $-38,766
- Equity at exit
- $20,146
Cash invested: $65,240 (down + closing). Projections, not guarantees.
Landlord ↔ Tenant lean methodology
- Overall (STATE)
- 85 Strongly Landlord-Friendly
- State North Carolina
- 85 Strongly Landlord-Friendly · R+3
- County
- — inherits STATE
- City
- — inherits STATE
ZIP-level market 28539
- Home prices YoY
- -23.9%
- Rents YoY
- 2.6%
- Active inventory
- 322
- Price-to-rent
- 11.0×
Monthly cashflow live
- Estimated rent
- $1,759 high interval (Pro) →
- Mortgage (P&I)
- −$1,222
- Tax from tax record
- −$85 /mo · $1,021/yr
- Insurance
- −$97
- HOA
- −$0
- Vacancy / Maint / Mgmt
- −$369
- Net cashflow
- $-15
Break-even live
UW: 25.0% down · 7.5% · 30yr · 1.5% tax · 5.0% vac · 8.0% maint · 8.0% mgmt
Financing live
Cash to close
- Down payment
- $58,250
- Closing costs
- $6,990
- Reserves months
- —
- Total cash needed
- —
Loan-product check · same deal, 3 products live
Conventional
25% down · 7.5% · 30yr
- Down + closing
- —
- Monthly P&I
- —
- Monthly cashflow
- —
- DSCR
- —
- Eligible?
- —
Personal DTI + credit; lowest rate.
DSCR
20% down · 8.5% · 30yr
- Down + closing
- —
- Monthly P&I
- —
- Monthly cashflow
- —
- DSCR
- —
- Eligible?
- —
No personal income docs; deal must DSCR.
Hard money
10% down · 12.0% · 12mo
- Down + closing
- —
- Monthly P&I
- —
- Monthly cashflow
- —
- DSCR
- —
- Eligible?
- —
Short-term bridge; refi at stabilization.
Rent comps 7 comps
| Address | Beds | Baths | Sqft | Rent | $/sqft | DOM | Units | Dist |
|---|---|---|---|---|---|---|---|---|
| 400 Dayrell Dr Hubert, NC | 3.0 | 2.0 | 1267 | $1,800 | $1.42 | 21d | 1 | 0.35mi |
| 212 W Volant St Hubert, NC | 3.0 | 2.0 | 1223 | $1,750 | $1.43 | 21d | 1 | 0.45mi |
| 21 Crown Point Rd Hubert, NC | 4.0 | 2.5 | 1290 | $1,450 | $1.12 | 21d | 1 | 0.67mi |
| 136 Byrum Run Hubert, NC | 3.0 | 2.0 | 1164 | $1,800 | $1.55 | 21d | 1 | 0.87mi |
| 104 Parrot Landing Dr Hubert, NC | 2.0 | 2.5 | 1300 | $1,650 | $1.27 | 21d | 1 | 0.95mi |
| 104 Parrot Landing Dr Unit 104 Hubert, NC | 2.0 | 2.5 | 1300 | $1,650 | $1.27 | 21d | 1 | 0.95mi |
| 309 N Winchester Ln Hubert, NC | 4.0 | 2.0 | 1456 | $1,700 | $1.17 | 21d | 1 | 0.95mi |
Listing history 19 events
-
2026-06-19days on market $233,000 Active 32 DOM
-
2026-06-18days on market $233,000 Active 31 DOM
-
2026-06-17days on market $233,000 Active 30 DOM
-
2026-06-16days on market $233,000 Active 29 DOM
-
2026-06-15days on market $233,000 Active 28 DOM
-
2026-06-14days on market $233,000 Active 26 DOM
-
2026-06-13days on market $233,000 Active 25 DOM
-
2026-06-10days on market $233,000 Active 23 DOM
-
2026-06-09days on market $233,000 Active 22 DOM
-
2026-06-09days on market $233,000 Active 21 DOM
-
2026-06-07days on market $233,000 Active 20 DOM
-
2026-06-03days on market $233,000 Active 16 DOM
-
2026-06-02days on market $233,000 Active 15 DOM
-
2026-06-01days on market $233,000 Active 14 DOM
-
2026-05-31days on market $233,000 Active 13 DOM
-
2026-05-30days on market $233,000 Active 12 DOM
-
2026-05-18$233,000 Active
-
2008-06-06soldstatus $140,000
-
1995-06-29soldstatus $66,000
ⓘ Source: listings_history table (triggers on properties + properties_extension) + one-shot
backfill from property_details.listing_events for pre-trigger history.
Tax reassessment forecast NC · Resets to sale price
- Current annual tax
- $1,021 · $85/mo
- Projected year-2 tax
- $1,911 · $159/mo
- Expected delta
- +$890/yr (+$74/mo · 87.2%)
ⓘ Screening estimate from a state-policy table — verify with the county assessor before closing.
Climate risk First Street
- Flood 1/10 Low FEMA zone X (unshaded) · 0% chance over 30 yrs
- Wildfire 4/10 Moderate
- Heat 9/10 Extreme 7 d/yr ≥105°F today · 19 d/yr by 30 yrs out
- Wind 8/10 Severe 99% chance of damaging wind over 30 yrs
- Air quality 2/10 Low 0 unhealthy d/yr today · 2 by 30 yrs out
Nearby sold comps map
Loading sold comps map…
Walkable amenities ~0.75 mi
Loading nearby amenities…
Taxation est. · year 1
- Rental income
- $21,106
- − Mortgage interest
- −$13,052
- − Property taxes
- −$1,021
- − Insurance
- −$1,165
- − Repairs & maintenance
- −$1,688
- − Management
- −$1,688
- − Depreciation
- −$6,778
- Taxable loss
- −$4,286
- Est. tax savings @ 24.0%
- +$1,029
- After-tax cash flow
- $854/yr
For passive investors: Depreciation is non-cash, so a rental often shows a tax loss while cash-flowing — sheltering income. Rental losses are passive: they offset passive income freely, and up to $25,000/yr can offset ordinary (W-2) income if you actively participate and your MAGI is under $100k (phasing out to $0 by $150k); unused losses carry forward. On sale, claimed depreciation is recaptured at up to 25%, and gains may owe capital-gains tax (a 1031 exchange can defer both). Figures are a year-1 estimate at your 24.0% rate — not tax advice; consult a CPA.
Schools (NCES district)
- District
- Onslow County Schools
- NCES district ID
- 3703450
- Math proficiency
- 42% ▲ 6.00%
- Reading proficiency
- 49% ▲ 5.00%
- Median HH income
- $46,076
- Composite
- 38.66/100
- National rank
- #4148
- State rank
- #84 of 178 in NC
Livability — Swansboro
- Score
- 77/100
- State rank
- #32
- US rank
- #3124
Category grades
Schools grade is shown separately in the Schools card above.
Census & demographics
- County
- Onslow County · 164,453 people
- Metro
- Jacksonville, NC
- Population (ZIP)
- 18,351
- Household income
- $66,976
- Rent vs Own
- Severe rent burden
- 602.0
Population outlook (Onslow County) Hauer SSP2
- Today (2025)
- 189,789 people
- By 2030
- 194,463 · +2.5%
- By 2040
- 193,629 · +2.0%
- By 2050
- 193,248 · +1.8%
- By 2075
- 196,995 · +3.8%
- By 2100
- 201,513 · +6.2%
Race, ethnicity, and origin ACS 2023
- Neighborhood character
- Predominantly White (82%)
- Race & ethnicity
- White 82% Two or more races 7% Hispanic / Latino 6% Black 6% Asian 1%
- Hispanic origin (detail)
- Mexican 3% Puerto Rican 2%
- Common ancestry
- Slovak 3% Romanian 3% Lithuanian 2%
- Foreign-born
- 3% · Canada
- Languages at home
- 93% English-only · Spanish 3% Other Asian/Pacific 1% Other Indo-European 1%
Political lean MEDSL · Onslow
- 2024 margin
- Solid R (+35.9) · D 31.5% · R 67.5% · Other 1.0%
- 2008→2024 swing
- -14.5pp toward R · 2008: -21.5pp · 2024: -35.9pp
- All cycles
- 2024: R+35.9 2020: R+30.2 2016: R+34.6 2012: R+27.0 2008: R+21.5
Not yet ingested
- Civics
- —
Market trends
- HPI YoY
- ▼ -58.68%
- Current HPI
- 186.871
- Rent YoY
- ▲ 2.61%
- Metro
- Jacksonville, NC
- State GDP YoY
- ▲ 3.28%
- F500 in state
- 26
Industry mix (Fortune 500 HQ in NC)
| Industry | F500 HQs | Revenue |
|---|---|---|
| Financial Services | 2 | $213B |
|
||
| Retail | 2 | $95B |
|
||
| Industrial Conglomerate | 1 | $38B |
|
||
| Metals / Steel | 1 | $35B |
|
||
| Utilities | 1 | $30B |
|
||
| Industrial Machinery | 1 | $19B |
|
||
Price history
+253.0% since first listed3 events — show timeline
- 2026-05-18 Listed $233,000 Hive MLS
- 2008-06-06 Sold (Public Records) $140,000 Public Records
- 1995-06-29 Sold (Public Records) $66,000 Public Records
Property tax history
+2.5%/yrLatest (2025): $1,021 · +0.0% YoY. Source: county tax records.
Cash-flow waterfall
monthlySold comps — $/sqft
last 12 mo · ≤1 miLoading sold comps…