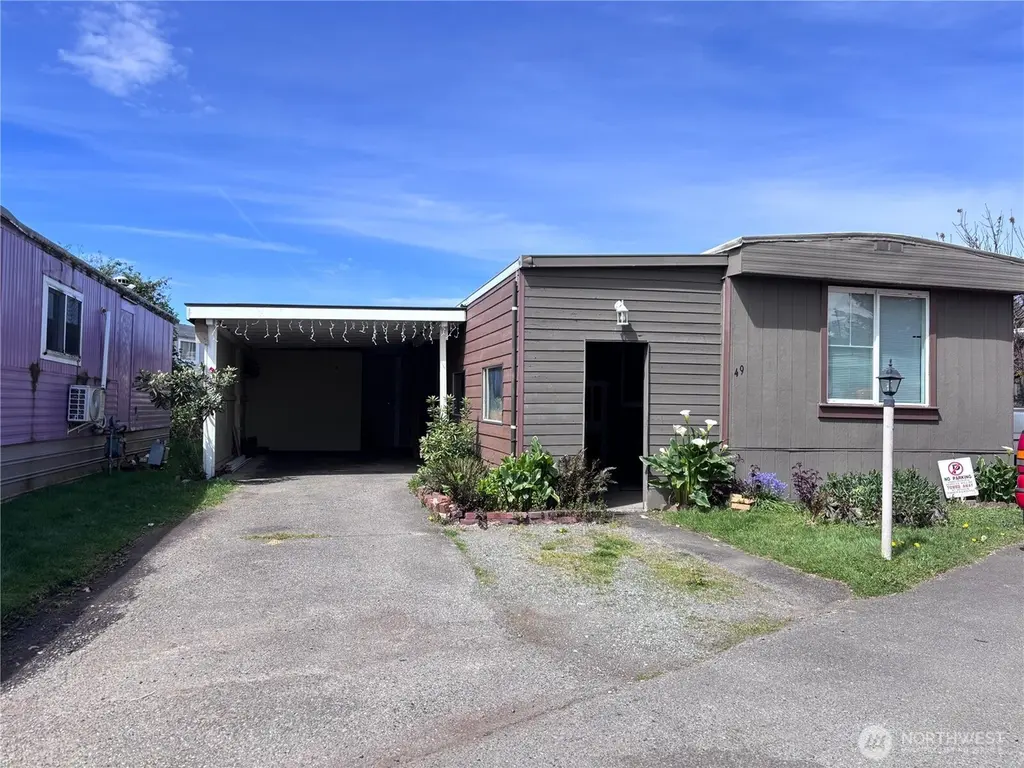
8114 34Th Ave S #49 · Lakewood, WA
Flood risk 1/10 · Minimal
- FEMA flood zone
- X (unshaded)
- Chance of flooding over 30 yrs
- 0.0%
- Est. flood insurance / yr
- $507 – $1,088
Fire risk 1/10 · Minimal
- Est. fire insurance / yr
- $604 – $1,122
Heat risk 3/10 · Minor
- Hot days now (above 86°F)
- 7 days/yr
- Hot days in 30 yrs
- 14 days/yr
Wind risk 1/10 · Minimal
- Chance of severe wind over 30 yrs
- —
Air-quality risk 7/10 · Major
- Unhealthy air days now
- 11 days/yr
- Unhealthy air days in 30 yrs
- 12 days/yr
Risk factors via First Street. Map © Google.
Why this score? — see what drove the B grade
The composite is a weighted blend of 9 inputs, each scored 0–100. Each bar is that input's sub-score; the figure is the points it added to the 100-point composite (weight × sub-score).
- Cash flow +30.0/30.0
- 1% rule +10.0/10.0
- DSCR +10.0/10.0
- ARV discount +7.5/15.0
- Schools +4.0/10.0
- Livability +3.7/5.0
- Rent growth +3.2/5.0
- Condition / age +2.5/5.0
- Appreciation +0.0/10.0
$75,000
🖨 Deal sheet 📄 Offer letter ✓ Due diligence
Listing remarks
Welcome to this beautifully updated and move-in ready home in the desirable Canterbury Estates Mobile Park Community! This charming 2-bedroom, 1-bath residence offers comfort, convenience, and affordability all in one. Step inside to discover a bright and inviting living space with tasteful upgrades throughout, creating a warm and modern feel the moment you walk in. The functional floor plan offers a comfortable flow between the living area, kitchen, and bedrooms, making everyday living easy and enjoyable. The kitchen provides ample cabinetry and workspace, while the refreshed interior gives the home a clean and well-maintained feel. Enjoy abundant natural light, spacious bedrooms, and a co
Key facts
- Move-in ready
- Bright living space
- Ample cabinetry
Tags
Property features AI
Finance
- Other: Approximately 840 square feet (per listing); MLS status: Active
- Financial info: Listing accepts cash or conventional financing
- HOA & community: Land lease: $780/month
Exterior
- Parking: Carport
- Utilities: Public water; Electric service
- Home design: Manufactured single-wide home; One level; Westwind model
- Construction: Metal roof; Manufactured house construction; Built as a single-wide
- Exterior features: Located in a manufactured home park (Canterbury Estates); Park has about 114 homes; Pets allowed — see remarks
Interior
- Bedrooms: 2 bedrooms
- Flooring: Ceramic tile; Laminate; Carpet
- Bathrooms: 1 full bathroom
- Heating & cooling: Forced air heating; Electric power
- Interior features: Tie down foundation; Has view
Neighborhood map
What this means for you Summary
Snapshot
- This is a 2-bed/1.0-bath manufactured listed at $75k.
Deal economics
- At list price, monthly cash flow is $834 ($10k/yr) — positive.
- The deal already cash-flows at list — no discount required.
- Meets the 1% rule at list price ($2k rent vs $75k).
- Recommended offer: $73k (3.0% below list) — sets the bar for market timing.
- Cap rate 19.6% vs local median 2.6% in Lakewood — top-decile yield for the area; either an underpriced asset or a hidden risk that comps aren't pricing in. Stress-test before assuming the spread holds.
Location & tenants
- Location reads 74/100 on livability (#182 in WA, #4,754 nationally) — a middle-class / working-renter tenant base. Strengths: commute A+, health & safety A+, housing A-; Watch: schools C-, cost of living D, crime F.
- Clover Park School District (urban): math 39% / reading 51% proficiency, ranked #190 of 291 in WA (top 65%) — families likely to look elsewhere, expect single-tenant / working-renter base with shorter leases.
- Market conditions: Rents rising (+3.0%/yr); 129 active listings in the ZIP; 40 comparable units currently listed for rent nearby; rentals at typical pace (median 17d on market — plan ~3-4 weeks tenant-placement turnaround); 3,209 units permitted in Pierce County in 2024 (1,269 in 5+ unit buildings).
Forward outlook
- Local home prices are declining (-3.0%/yr); year-one equity from $519 of loan paydown is wiped out by about $2k of value loss. Plan a longer hold.
- Pierce County population projected at +26% by 2050 — long-run rental-demand tailwind backs the buy-and-hold thesis.
- At projected returns (-3.0% appreciation + 3.0% rent growth), your $21k cash investment doubles in ~3 years — after that, you're playing with house money.
Negotiation context
- It's been on market 31 days — a 3% lower offer ($73k) is reasonable based on typical stale-listing flexibility.
Questions for the listing agent
- It's been on market 31 days. Have you received any prior offers? Is the seller open to a 3% concession, seller financing, or rate buy-down credit?
- Built in 1973 — when were the roof, HVAC, electrical panel, plumbing, and water heater last replaced?
- Is there a deadline driving the sale (1031 exchange, divorce, estate, relocation)? That informs how much negotiation room exists.
- Crime grade is F in this area — have there been break-ins, vandalism, or insurance claims at this property in the last 3 years? What carrier currently insures it and at what premium?
- What's the average days-on-market for RENTAL listings here right now (not sales)? A rising rental-DOM trend means longer vacancies and softer asking-rent achievability than the comps imply.
- What's the recent tenant-quality profile in this submarket — average credit score on applications, eviction rate, late-payment / NSF rate, and stable-employment percentage? A property-management company in the area should have these aggregated.
- How much new for-sale + rental construction is in the pipeline within 1–3 miles? Heavy new supply typically softens prices + rents 12–24 months out; constrained supply supports both.
Investment metrics
- 1% rule
- 2.17% ✓
- Cap rate
- 19.63%
- Cash-on-cash
- 47.64%
- DSCR
- 3.12
- GRM
- 3.8
CMA / ARV
- ARV (on-the-fly)
- $40,320
- Comps found
- 3
Show comp detail 3 sales within ~0.75 mi
| Address | Dist | Beds/Ba | Sqft | Sold | Price | $/sf | Match |
|---|---|---|---|---|---|---|---|
| 8527 31st Ave S | 0.40mi | 2/1.0 | 840 (0%) | 11mo | $40,000 | $48 | 72 |
| 3250 S 77th St #18 | 0.24mi | 2/2.0 | 960 (+14%) | 6mo | $35,000 | $36 | 56 |
| 3121 S 86th street Ct #87 | 0.39mi | 3/2.0 (+1) | 950 (+13%) | 14mo | $120,000 | $126 | 40 |
Match score weights: distance 35% · size 25% · config 20% · recency 20%. Top-matched comps best support the ARV.
Projected returns pro-forma
-3.0% appreciation · 3.0% rent growth · sell at horizon
- IRR
- 45.0%
- Equity multiple
- 2.95×
- Total profit
- $40,930
- Equity at exit
- $11,183
- IRR
- 50.9%
- Equity multiple
- 5.95×
- Total profit
- $103,952
- Equity at exit
- $6,485
Cash invested: $21,000 (down + closing). Projections, not guarantees.
Landlord ↔ Tenant lean methodology
- Overall (STATE)
- 28 Tenant-Leaning
- State Washington
- 28 Tenant-Leaning · D+8
- County
- — inherits STATE
- City
- — inherits STATE
ZIP-level market 98499
- Rents YoY
- 3.0%
- Active inventory
- 129
- Price-to-rent
- 3.8×
Monthly cashflow live
- Estimated rent
- $1,628 high interval (Pro) →
- Mortgage (P&I)
- −$393
- Tax from tax record
- −$28 /mo · $338/yr
- Insurance
- −$31
- HOA
- −$0
- Vacancy / Maint / Mgmt
- −$342
- Net cashflow
- $834
Break-even live
UW: 25.0% down · 7.5% · 30yr · 1.5% tax · 5.0% vac · 8.0% maint · 8.0% mgmt
Financing live
Cash to close
- Down payment
- $18,750
- Closing costs
- $2,250
- Reserves months
- —
- Total cash needed
- —
Loan-product check · same deal, 3 products live
Conventional
25% down · 7.5% · 30yr
- Down + closing
- —
- Monthly P&I
- —
- Monthly cashflow
- —
- DSCR
- —
- Eligible?
- —
Personal DTI + credit; lowest rate.
DSCR
20% down · 8.5% · 30yr
- Down + closing
- —
- Monthly P&I
- —
- Monthly cashflow
- —
- DSCR
- —
- Eligible?
- —
No personal income docs; deal must DSCR.
Hard money
10% down · 12.0% · 12mo
- Down + closing
- —
- Monthly P&I
- —
- Monthly cashflow
- —
- DSCR
- —
- Eligible?
- —
Short-term bridge; refi at stabilization.
Rent comps 40 comps
| Address | Beds | Baths | Sqft | Rent | $/sqft | DOM | Units | Dist |
|---|---|---|---|---|---|---|---|---|
| 8333 32nd Ave S Lakewood, WA | 2.0 | 1.0 | 850 | $1,695 | $1.99 | 1d | 5 | 0.27mi |
| 8420 S Tacoma Way Unit 1/2 Lakewood, WA | 2.0 | 1.0 | 800 | $1,995 | $2.49 | 17d | 1 | 0.32mi |
| 3422 86th St S Lakewood, WA | 1.0 | 1.0 | 672 | $1,295 | $1.93 | 10d | 2 | 0.34mi |
| 2611 84th Street Ct S Tacoma, WA | 1.0–2.0 | 1.0 | 850 | $1,895 | $2.23 | 21d | 6 | 0.42mi |
| 3418 90th St S Lakewood, WA | 2.0 | 1.0 | 800 | $1,495 | $1.87 | 43d | 1 | 0.60mi |
| 3407-3411 92nd St S Unit 17 Lakewood, WA | 2.0 | 1.0 | 700 | $1,395 | $1.99 | 24d | 1 | 0.66mi |
| 3411 92nd St S Unit 15 Lakewood, WA | 2.0 | 1.0 | 700 | $1,595 | $2.28 | 24d | 1 | 0.66mi |
| 3415 92nd St S Lakewood, WA | 1.0 | 1.0 | 650 | $1,200 | $1.85 | 17d | 1 | 0.69mi |
| 3415 92nd St S Apt 2 Tacoma, WA | 1.0 | 1.0 | 650 | $1,200 | $1.85 | 16d | 1 | 0.69mi |
| 6815 S Warner St Tacoma, WA | 3.0 | 1.0 | 1034 | $2,400 | $2.32 | 2d | 1 | 0.76mi |
| 3102 92nd St S Unit 3104 Lakewood, WA | 2.0 | 1.0 | 708 | $1,497 | $2.11 | 21d | 1 | 0.77mi |
| 9324 S Tacoma Way Lakewood, WA | 2.0 | 1.0 | 800 | $1,995 | $2.49 | 14d | 1 | 0.82mi |
| 2205 S 74th St Tacoma, WA | 2.0 | 1.0 | 880 | $1,720 | $1.95 | 2d | 1 | 0.84mi |
| 2604 92nd St S Unit B Lakewood, WA | 3.0 | 2.0 | 1120 | $1,995 | $1.78 | 43d | 1 | 0.87mi |
| 2604 92nd St S Unit B Lakewood, WA | 3.0 | 2.0 | 1120 | $1,995 | $1.78 | 24d | 1 | 0.87mi |
| 3232 94th St S Unit 15 Lakewood, WA | 1.0 | 1.0 | 632 | $1,150 | $1.82 | 24d | 1 | 0.87mi |
| 8740 S Hosmer St #155 Tacoma, WA | 1.0 | 1.0 | 750 | $1,100 | $1.47 | 24d | 1 | 0.91mi |
| 1801 S 84th St Tacoma, WA | 1.0 | 1.0 | 725 | $1,295 | $1.79 | 24d | 1 | 0.97mi |
| 8801 S Hosmer St Tacoma, WA | 2.0 | 1.0–2.0 | 443 | $1,795 | $4.05 | 1d | 26 | 1.00mi |
| 1721 S 82nd St Unit 1813-10 Tacoma, WA | 1.0 | 1.0 | 609 | $1,300 | $2.13 | 2d | 1 | 1.03mi |
| 1721 S 82nd St Unit 1807-02 Tacoma, WA | 2.0 | 1.0 | 897 | $1,500 | $1.67 | 2d | 1 | 1.03mi |
| 2425 S 96th St Tacoma, WA | 1.0–2.0 | 1.0 | 850 | $1,225 | $1.44 | 1d | 15 | 1.05mi |
| 6601 S Tyler St Unit 13 Tacoma, WA | 2.0 | 1.0 | 880 | $1,300 | $1.48 | 23d | 1 | 1.06mi |
| 9210 S Hosmer St Tacoma, WA | 1.0–2.0 | 1.0–2.0 | 787 | $1,685 | $2.14 | 1d | 12 | 1.06mi |
| 1718 S 84th St Tacoma, WA | 1.0–2.0 | 1.0 | 730 | $1,445 | $1.98 | 10d | 2 | 1.07mi |
| 6830 Tacoma Mall Blvd Tacoma, WA | 2.0 | 1.0 | 980 | $1,560 | $1.59 | 7d | 1 | 1.07mi |
| 1721 S 82nd St Tacoma, WA | 1.0–2.0 | 1.0 | 753 | $1,500 | $1.99 | 4d | 4 | 1.07mi |
| 1721 S 82nd St Tacoma, WA | 1.0–2.0 | 1.0 | 753 | $1,400 | $1.86 | 23d | 3 | 1.07mi |
| 9318 S Steele St Unit DD520 Tacoma, WA | 2.0 | 2.0 | 1000 | $1,695 | $1.70 | 43d | 1 | 1.12mi |
| 9318 S Steele St Unit Q367 Tacoma, WA | 2.0 | 1.0 | 960 | $1,650 | $1.72 | 43d | 1 | 1.12mi |
| 9318 S Steele St Unit D61 Tacoma, WA | 2.0 | 2.0 | 1000 | $1,695 | $1.70 | 14d | 1 | 1.12mi |
| 4215 S 66th St Unit 103 Tacoma, WA | 1.0 | 1.0 | 615 | $1,450 | $2.36 | 24d | 1 | 1.12mi |
| 1819 S 93rd St Unit A Tacoma, WA | 2.0 | 1.0 | 912 | $1,575 | $1.73 | 10d | 1 | 1.17mi |
| 1819 S 93rd St Tacoma, WA | 2.0 | 1.0 | 912 | $1,588 | $1.74 | 17d | 2 | 1.17mi |
| 6451 S Stevens St Tacoma, WA | 2.0 | 1.0 | 772 | $1,595 | $2.07 | 3d | 1 | 1.17mi |
| 6451 S Stevens St Unit 3 Tacoma, WA | 2.0 | 1.0 | 772 | $1,675 | $2.17 | 21d | 1 | 1.17mi |
| 9314 S Ash St Tacoma, WA | 1.0–2.0 | 1.0 | 800 | $1,683 | $2.10 | 1d | 21 | 1.21mi |
| 5101 88th Street Ct SW Lakewood, WA | 3.0 | 1.0–2.0 | 832 | $2,258 | $2.71 | 2d | 16 | 1.23mi |
| 9315 S Ash St Tacoma, WA | 2.0 | 1.5 | 828 | $1,550 | $1.87 | 16d | 1 | 1.24mi |
| 6031 S Oakes St Tacoma, WA | 1.0 | 1.0 | 528 | $800 | $1.52 | 4d | 1 | 1.30mi |
Listing history 14 events
-
2026-06-18days on market $75,000 Active 31 DOM
-
2026-06-17days on market $75,000 Active 30 DOM
-
2026-06-16days on market $75,000 Active 29 DOM
-
2026-06-15days on market $75,000 Active 28 DOM
-
2026-06-13days on market $75,000 Active 26 DOM
-
2026-06-09days on market $75,000 Active 22 DOM
-
2026-06-08days on market $75,000 Active 21 DOM
-
2026-06-07days on market $75,000 Active 20 DOM
-
2026-06-04days on market $75,000 Active 17 DOM
-
2026-06-03days on market $75,000 Active 16 DOM
-
2026-06-02days on market $75,000 Active 15 DOM
-
2026-06-01days on market $75,000 Active 14 DOM
-
2026-05-31days on market $75,000 Active 13 DOM
-
2026-05-18$75,000 Active
ⓘ Source: listings_history table (triggers on properties + properties_extension) + one-shot
backfill from property_details.listing_events for pre-trigger history.
Tax reassessment forecast WA · Resets to sale price
- Current annual tax
- $338 · $28/mo
- Projected year-2 tax
- $735 · $61/mo
- Expected delta
- +$396/yr (+$33/mo · 117.1%)
ⓘ Screening estimate from a state-policy table — verify with the county assessor before closing.
Climate risk First Street
- Flood 1/10 Low FEMA zone X (unshaded) · 0% chance over 30 yrs
- Wildfire 1/10 Low
- Heat 3/10 Moderate 7 d/yr ≥86°F today · 14 d/yr by 30 yrs out
- Wind 1/10 Low
- Air quality 7/10 Severe 11 unhealthy d/yr today · 12 by 30 yrs out
Nearby sold comps map
Loading sold comps map…
Walkable amenities ~0.75 mi
Loading nearby amenities…
Taxation est. · year 1
- Rental income
- $19,541
- − Mortgage interest
- −$4,201
- − Property taxes
- −$338
- − Insurance
- −$375
- − Repairs & maintenance
- −$1,563
- − Management
- −$1,563
- − Depreciation
- −$2,182
- Taxable income
- $9,318
- Est. tax owed @ 24.0%
- −$2,236
- After-tax cash flow
- $7,768/yr
For passive investors: Depreciation is non-cash, so a rental often shows a tax loss while cash-flowing — sheltering income. Rental losses are passive: they offset passive income freely, and up to $25,000/yr can offset ordinary (W-2) income if you actively participate and your MAGI is under $100k (phasing out to $0 by $150k); unused losses carry forward. On sale, claimed depreciation is recaptured at up to 25%, and gains may owe capital-gains tax (a 1031 exchange can defer both). Figures are a year-1 estimate at your 24.0% rate — not tax advice; consult a CPA.
Schools (NCES district)
- District
- Clover Park School District
- NCES district ID
- 5301410
- Math proficiency
- 39% ▼ -2.00%
- Reading proficiency
- 51% ▲ 2.00%
- Median HH income
- $42,344
- Composite
- 40.11/100
- National rank
- #7858
- State rank
- #190 of 291 in WA
Livability — Lakewood
- Score
- 74/100
- State rank
- #182
- US rank
- #4754
Category grades
Schools grade is shown separately in the Schools card above.
Census & demographics
- Census place
- Lakewood, WA
- County
- Pierce County · 788,257 people
- City population
- 61,673
- Metro
- Seattle-Tacoma-Bellevue, WA
- Population (ZIP)
- 32,464
- Household income
- $67,292
- Rent vs Own
- Severe rent burden
- 2313.0
Population outlook (Pierce County) Hauer SSP2
- Today (2025)
- 956,648 people
- By 2030
- 1,010,862 · +5.7%
- By 2040
- 1,113,170 · +16.4%
- By 2050
- 1,206,524 · +26.1%
- By 2075
- 1,436,425 · +50.2%
- By 2100
- 1,563,654 · +63.5%
Race, ethnicity, and origin ACS 2023
- Neighborhood character
- Highly diverse neighborhood (Simpson 0.76)
- Race & ethnicity
- White 39% Hispanic / Latino 25% Two or more races 17% Black 15% Asian 8% Pacific Islander 6%
- Hispanic origin (detail)
- Mexican 17% Puerto Rican 2% Cuban 1%
- Common ancestry
- Portuguese 3% Slovak 2% Lithuanian 2%
- Foreign-born
- 18% · Canada, South Korea, Vietnam
- Languages at home
- 74% English-only · Spanish 16% Korean 3% Tagalog/Filipino 2%
Political lean MEDSL · Pierce
- 2024 margin
- D (+10.8) · D 53.9% · R 43.1% · Other 3.0%
- 2008→2024 swing
- -1.4pp toward R · 2008: 12.2pp · 2024: 10.8pp
- All cycles
- 2024: D+10.8 2020: D+11.2 2016: D+7.5 2012: D+11.0 2008: D+12.2
Not yet ingested
- Civics
- —
Market trends
- HPI YoY
- ▼ -536.54%
- Current HPI
- 288.2797
- Rent YoY
- ▲ 3.00%
- Metro
- Seattle-Tacoma-Bellevue, WA
- State GDP YoY
- ▲ 4.65%
- F500 in state
- 22
Industry mix (Fortune 500 HQ in WA)
| Industry | F500 HQs | Revenue |
|---|---|---|
| Retail | 2 | $269B |
|
||
| Technology / Retail | 1 | $638B |
|
||
| Technology | 1 | $245B |
|
||
| Telecommunications | 1 | $38B |
|
||
| Food / Beverage | 1 | $36B |
|
||
| Automotive / Trucks | 1 | $34B |
|
||
Price history
1 event — show timeline
- 2026-05-18 Listed $75,000 NWMLS as Distributed by MLS Grid
Property tax history
+38.3%/yrLatest (2026): $338 · +3.4% YoY. Source: county tax records.
Cash-flow waterfall
monthlySold comps — $/sqft
last 12 mo · ≤1 miLoading sold comps…