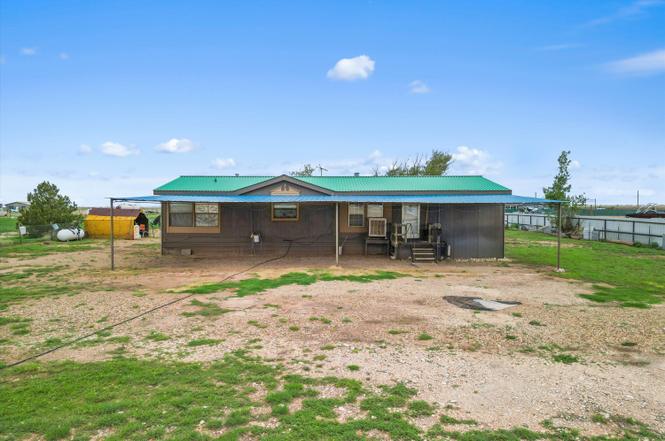
3104 Black Gold Rd · Levelland, TX
Flood risk 2/10 · Minimal
- FEMA flood zone
- A
- Chance of flooding over 30 yrs
- 0.03%
- Est. flood insurance / yr
- $1,009 – $1,996
Fire risk 5/10 · Moderate
- Est. fire insurance / yr
- $1,222 – $2,270
Heat risk 5/10 · Moderate
- Hot days now (above 99°F)
- 7 days/yr
- Hot days in 30 yrs
- 20 days/yr
Wind risk 2/10 · Minimal
- Chance of severe wind over 30 yrs
- 1.0%
Air-quality risk 1/10 · Minimal
- Unhealthy air days now
- 0 days/yr
- Unhealthy air days in 30 yrs
- 0 days/yr
Risk factors via First Street. Map © Google.
Why this score? — see what drove the B- grade
The composite is a weighted blend of 9 inputs, each scored 0–100. Each bar is that input's sub-score; the figure is the points it added to the 100-point composite (weight × sub-score).
- Cash flow +30.0/30.0
- DSCR +10.0/10.0
- 1% rule +8.0/10.0
- ARV discount +7.5/15.0
- Livability +3.6/5.0
- Schools +2.8/10.0
- Rent growth +2.5/5.0
- Condition / age +2.5/5.0
- Appreciation +0.0/10.0
$99,900
🖨 Deal sheet 📄 Offer letter ✓ Due diligence
Listing remarks
Great opportunity to enjoy country living on 1.67 acres! This 3-bedroom, 2-bath manufactured home features a metal roof and plenty of room for animals, equipment, or outdoor activities. Conveniently located just outside Levelland with easy access to town while enjoying the peace and privacy of rural living.
Key facts
- Metal roof
- Easy access to town
- Peace and privacy
Tags
Property features AI
Exterior
- Parking: Attached carport; Detached driveway access; 3 carport spaces
- Utilities: No specific utility provider details listed
- Home design: Manufactured home; Residential property; Rectangular lot
- Construction: Vinyl siding; Metal roof; Pillar/post/pier foundation; Built as a manufactured home
- Exterior features: Private, fenced backyard
Interior
- Bathrooms: 2 full bathrooms
- Heating & cooling: Central air; Ceiling fans (cooling); Electric cooling; Propane heating
- Interior features: Ceiling fans
Neighborhood map
What this means for you Summary
Snapshot
- This is a 3-bed/2.0-bath manufactured listed at $100k.
Deal economics
- At list price, monthly cash flow is $268 ($3k/yr) — positive.
- The deal already cash-flows at list — no discount required.
- Meets the 1% rule at list price ($1k rent vs $100k).
Location & tenants
- Location reads 72/100 on livability (#274 in TX) — a middle-class / working-renter tenant base. Strengths: cost of living A+, housing A+, health & safety A+; Watch: commute F, employment F.
- Levelland ISD (town): math 33% / reading 32% proficiency, ranked #566 of 826 in TX (top 68%) — families likely to look elsewhere, expect single-tenant / working-renter base with shorter leases; 64% free/reduced lunch — lower-income household profile, screen leases tightly.
- Zoned schools: Levelland Middle (math 32% / reading 31%, grade F, #997 of 1,662 statewide, top 61%, 622 students, 79% FRL); Levelland H S (math 67% / reading 55%, grade C+, #258 of 1,632 statewide, top 16%, 745 students, 67% FRL).
- Zoned-school proficiency averages 46% at this address vs 32% district-wide (+14 pts) — the actual schools serving this property are materially stronger than the Levelland ISD average implies; a family-tenant draw the district grade alone would hide.
- Market conditions: 120 active listings in the ZIP; 7 units permitted in Hockley County in 2024 (0 in 5+ unit buildings).
Forward outlook
- Local home prices are declining (-3.0%/yr); year-one equity from $691 of loan paydown is wiped out by about $3k of value loss. Plan a longer hold.
- Hockley County population projected at +21% by 2050 — long-run rental-demand tailwind backs the buy-and-hold thesis.
- At projected returns (-3.0% appreciation + 3.0% rent growth), your $28k cash investment doubles in ~10 years — after that, you're playing with house money.
Negotiation context
- Only 3 days on market — expect competitive offers; lowballing is unlikely to land.
Risks & watch-outs
- Watch-outs: flood insurance adds $125/mo.
- Climate carrying-cost: in FEMA flood zone A (mandatory federal flood insurance); moderate wildfire risk; extreme-heat days projected 7→20/yr by 2055 (HVAC capex compounding) — expect insurance premiums to compound above CPI over the hold.
Questions for the listing agent
- What's the actual annual flood-insurance premium (NFIP or private), and is the property in a SFHA with mandatory coverage?
- Is there a deadline driving the sale (1031 exchange, divorce, estate, relocation)? That informs how much negotiation room exists.
- Schools are F-rated, which usually means shorter tenancies and higher turnover. Who's the typical renter profile here, and what's been the actual vacancy rate?
- What's the average days-on-market for RENTAL listings here right now (not sales)? A rising rental-DOM trend means longer vacancies and softer asking-rent achievability than the comps imply.
- What's the recent tenant-quality profile in this submarket — average credit score on applications, eviction rate, late-payment / NSF rate, and stable-employment percentage? A property-management company in the area should have these aggregated.
- How much new for-sale + rental construction is in the pipeline within 1–3 miles? Heavy new supply typically softens prices + rents 12–24 months out; constrained supply supports both.
Investment metrics
- 1% rule
- 1.30% ✓
- Cap rate
- 11.02%
- Cash-on-cash
- 16.88%
- DSCR
- 1.75
- GRM
- 6.4
CMA / ARV
No comps found within radius.
Projected returns pro-forma
-3.0% appreciation · 3.0% rent growth · sell at horizon
- IRR
- 0.9%
- Equity multiple
- 1.03×
- Total profit
- $967
- Equity at exit
- $14,895
- IRR
- 10.6%
- Equity multiple
- 1.83×
- Total profit
- $23,104
- Equity at exit
- $8,638
Cash invested: $27,972 (down + closing). Projections, not guarantees.
Landlord ↔ Tenant lean methodology
- Overall (STATE)
- 87 Strongly Landlord-Friendly
- State Texas
- 87 Strongly Landlord-Friendly · R+5
- County
- — inherits STATE
- City
- — inherits STATE
ZIP-level market 79336
- Active inventory
- 120
- Price-to-rent
- 6.4×
Monthly cashflow live
- Estimated rent
- $1,302 medium interval (Pro) →
- Mortgage (P&I)
- −$524
- Tax from tax record
- −$69 /mo · $831/yr
- Insurance
- −$42
- Flood insurance flood zone
- −$125 /mo · $1,502/yr
- HOA
- −$0
- Vacancy / Maint / Mgmt
- −$273
- Net cashflow
- $268
Break-even live
UW: 25.0% down · 7.5% · 30yr · 1.5% tax · 5.0% vac · 8.0% maint · 8.0% mgmt
Financing live
Cash to close
- Down payment
- $24,975
- Closing costs
- $2,997
- Reserves months
- —
- Total cash needed
- —
Loan-product check · same deal, 3 products live
Conventional
25% down · 7.5% · 30yr
- Down + closing
- —
- Monthly P&I
- —
- Monthly cashflow
- —
- DSCR
- —
- Eligible?
- —
Personal DTI + credit; lowest rate.
DSCR
20% down · 8.5% · 30yr
- Down + closing
- —
- Monthly P&I
- —
- Monthly cashflow
- —
- DSCR
- —
- Eligible?
- —
No personal income docs; deal must DSCR.
Hard money
10% down · 12.0% · 12mo
- Down + closing
- —
- Monthly P&I
- —
- Monthly cashflow
- —
- DSCR
- —
- Eligible?
- —
Short-term bridge; refi at stabilization.
Listing history 4 events
-
2026-06-18days on market $99,900 Active 3 DOM
-
2026-06-17days on market $99,900 Active 2 DOM
-
2026-06-16remarks 308-char remark
-
2026-06-16$99,900 Active 1 DOM
ⓘ Source: listings_history table (triggers on properties + properties_extension) + one-shot
backfill from property_details.listing_events for pre-trigger history.
Tax reassessment forecast TX · Resets to sale price
- Current annual tax
- $831 · $69/mo
- Projected year-2 tax
- $1,828 · $152/mo
- Expected delta
- +$997/yr (+$83/mo · 119.9%)
ⓘ Screening estimate from a state-policy table — verify with the county assessor before closing.
Climate risk First Street
- Flood 2/10 Low FEMA zone A · 3% chance over 30 yrs
- Wildfire 5/10 Major
- Heat 5/10 Major 7 d/yr ≥99°F today · 20 d/yr by 30 yrs out
- Wind 2/10 Low 100% chance of damaging wind over 30 yrs
- Air quality 1/10 Low 0 unhealthy d/yr today · 0 by 30 yrs out
Nearby sold comps map
Loading sold comps map…
Walkable amenities ~0.75 mi
Loading nearby amenities…
Taxation est. · year 1
- Rental income
- $15,621
- − Mortgage interest
- −$5,596
- − Property taxes
- −$831
- − Insurance
- −$2,002
- − Repairs & maintenance
- −$1,250
- − Management
- −$1,250
- − Depreciation
- −$2,906
- Taxable income
- $1,786
- Est. tax owed @ 24.0%
- −$429
- After-tax cash flow
- $2,792/yr
For passive investors: Depreciation is non-cash, so a rental often shows a tax loss while cash-flowing — sheltering income. Rental losses are passive: they offset passive income freely, and up to $25,000/yr can offset ordinary (W-2) income if you actively participate and your MAGI is under $100k (phasing out to $0 by $150k); unused losses carry forward. On sale, claimed depreciation is recaptured at up to 25%, and gains may owe capital-gains tax (a 1031 exchange can defer both). Figures are a year-1 estimate at your 24.0% rate — not tax advice; consult a CPA.
Schools (NCES district)
- District
- Levelland ISD
- NCES district ID
- 4827240
- Math proficiency
- 33% ▼ -9.00%
- Reading proficiency
- 32% ▼ -6.00%
- Median HH income
- $47,924
- Composite
- 28.09/100
- National rank
- #6833
- State rank
- #566 of 826 in TX
Livability — Levelland
- Score
- 72/100
- State rank
- #274
- US rank
- #6392
Category grades
Schools grade is shown separately in the Schools card above.
Census & demographics
- Population (ZIP)
- 15,265
Population outlook (Hockley County) Hauer SSP2
- Today (2025)
- 25,295 people
- By 2030
- 26,230 · +3.7%
- By 2040
- 28,268 · +11.8%
- By 2050
- 30,536 · +20.7%
- By 2075
- 36,867 · +45.7%
- By 2100
- 40,662 · +60.8%
Race, ethnicity, and origin ACS 2023
- Neighborhood character
- Majority Hispanic (53%)
- Race & ethnicity
- Hispanic / Latino 53% White 42% Two or more races 24% Black 3%
- Hispanic origin (detail)
- Mexican 48%
- Common ancestry
- Slovak 1% Lithuanian 1% Italian 1%
- Foreign-born
- 9% · Canada
- Languages at home
- 72% English-only · Spanish 27%
Political lean MEDSL · Hockley
- 2024 margin
- Solid R (+66.3) · D 16.6% · R 82.8%
- 2008→2024 swing
- -14.0pp toward R · 2008: -52.3pp · 2024: -66.3pp
- All cycles
- 2024: R+66.3 2020: R+62.4 2016: R+62.3 2012: R+57.0 2008: R+52.3
Not yet ingested
- Civics
- —
Market trends
- HPI YoY
- ▼ -169.34%
- Current HPI
- 154.0713
- Rent YoY
- —
- Metro
- —
- State GDP YoY
- ▲ 3.95%
- F500 in state
- 110
Industry mix (Fortune 500 HQ in TX)
| Industry | F500 HQs | Revenue |
|---|---|---|
| Energy | 16 | $1,198B |
|
||
| Technology | 5 | $198B |
|
||
| Engineering / Construction | 4 | $72B |
|
||
| Energy Services | 3 | $60B |
|
||
| Utilities | 3 | $41B |
|
||
| Healthcare | 2 | $330B |
|
||
Price history
1 event — show timeline
- 2026-06-15 Listed $99,900 LARMLS
Property tax history
+2.4%/yrLatest (2025): $831 · +12.2% YoY. Source: county tax records.
Cash-flow waterfall
monthlySold comps — $/sqft
last 12 mo · ≤1 miLoading sold comps…