674 Hurley Ave · Hurley, NY
Flood risk 1/10 · Minimal
- FEMA flood zone
- X (unshaded)
- Chance of flooding over 30 yrs
- 0.0%
- Est. flood insurance / yr
- $473 – $860
Fire risk 1/10 · Minimal
- Est. fire insurance / yr
- $691 – $1,283
Heat risk 4/10 · Minor
- Hot days now (above 99°F)
- 7 days/yr
- Hot days in 30 yrs
- 15 days/yr
Wind risk 3/10 · Minor
- Chance of severe wind over 30 yrs
- 8.0%
Air-quality risk 2/10 · Minimal
- Unhealthy air days now
- 0 days/yr
- Unhealthy air days in 30 yrs
- 1 days/yr
Risk factors via First Street. Map © Google.
Why this score? — see what drove the D+ grade
The composite is a weighted blend of 9 inputs, each scored 0–100. Each bar is that input's sub-score; the figure is the points it added to the 100-point composite (weight × sub-score).
- Cash flow +15.5/30.0
- Appreciation +5.4/10.0
- DSCR +4.8/10.0
- Schools +4.4/10.0
- 1% rule +4.3/10.0
- Livability +3.4/5.0
- ARV discount +2.6/15.0
- Rent growth +2.5/5.0
- Condition / age +2.5/5.0
$425,000
🖨 Deal sheet 📄 Offer letter ✓ Due diligence
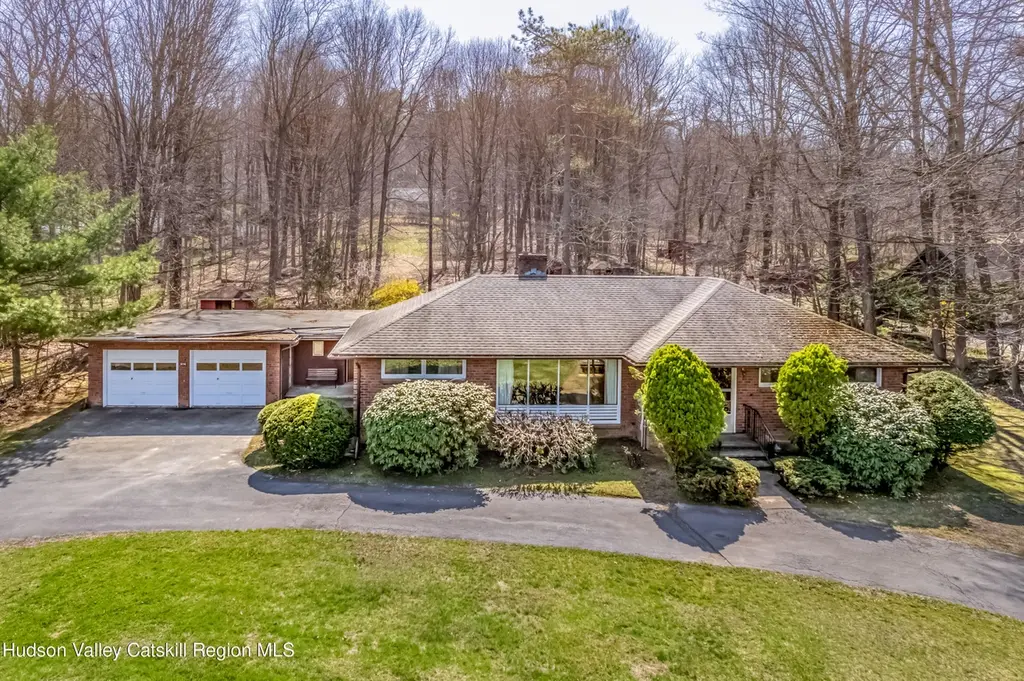
Listing remarks
Charming Mid-Century Brick Home on 5.3 Acres in Old Hurley with Endless Potential. Solid, sweet, and full of character, this 1950-built brick ranch offers 3 bedrooms, 1 bath, and is made up of two parcels totaling 5.3 acres. The main home rests on a 2.1-acre lot with a circular driveway, while an additional contiguous 3.3-acre parcel further back from the road provides exciting possibilities. Built by its original family 77 years ago, this mid-century gem features hardwood floors, a classic hipped roof, and three wood-burning heat sources: a stove in the basement, one in the kitchen, and a striking two-sided fireplace in the living room. The propane furnace with central air and a 200 amp pa
Key facts
- New propane furnace
- 5.3 acres
- Two-sided fireplace
Tags
Property features AI
Exterior
- Parking: Attached 2-car garage; Circular driveway
- Utilities: Public water; Septic tank sewer; Propane service
- Home design: Single-family residence; One story; Residential zoning (R2, medium density)
- Construction: Brick construction
- Exterior features: Private yard; Asphalt roof; Circular driveway; Additional detached garage structures
Interior
- Flooring: Hardwood
- Bathrooms: 1 full bathroom
- Heating & cooling: Central air conditioning; Forced air heating with propane
- Interior features: Hardwood floors; Full basement with interior entry; Total of 5 rooms
- Laundry & utility: Laundry in basement
Neighborhood map
What this means for you Summary
Snapshot
- This is a 3-bed/1.0-bath single-family listed at $425k.
Deal economics
- At list price, monthly cash flow is $171 ($2k/yr) — positive.
- The deal already cash-flows at list — no discount required.
- To meet the 1% rule (rent ≥ 1% of price), the offer needs to be $395k (7.1% below list).
- Recommended offer: $395k (7.1% below list) — sets the bar for 1% rule.
- Cap rate 6.8% vs local median 3.2% in Hurley — top-decile yield for the area; either an underpriced asset or a hidden risk that comps aren't pricing in. Stress-test before assuming the spread holds.
Location & tenants
- Location reads 68/100 on livability (#543 in NY) — a middle-class / working-renter tenant base. Strengths: crime A+, employment A+, housing A+; Watch: cost of living D+, amenities F, commute F.
- Kingston City School District (urban): math 44% / reading 59% proficiency, ranked #355 of 590 in NY (top 60%) — acceptable for families but not a draw, mixed tenant base, ~2y average lease.
- Market conditions: 31 active listings in the ZIP; 1 comparable units currently listed for rent nearby; 464 units permitted in Ulster County in 2024 (170 in 5+ unit buildings).
Forward outlook
- In year one you build about $7k of equity ($3k loan paydown + $4k appreciation (0.8% local appreciation)).
- Ulster County population projected at -14% by 2050 — secular population decline; favor cash flow + early exit over multi-decade hold.
- At projected returns (0.8% appreciation + 3.0% rent growth), your $119k cash investment doubles in ~9 years — after that, you're playing with house money.
- By year 5, paydown + projected appreciation supports a ~$31k cash-out refi (75% LTV) — recoverable capital for the next deal without selling this one.
Negotiation context
- It's been on market 26 days — a 2% lower offer ($419k) is reasonable based on typical stale-listing flexibility.
Risks & watch-outs
- Watch-outs: built in 1950 — expect roof / HVAC / electrical / plumbing capex.
Questions for the listing agent
- Built in 1950 — when were the roof, HVAC, electrical panel, plumbing, and water heater last replaced?
- Is there a deadline driving the sale (1031 exchange, divorce, estate, relocation)? That informs how much negotiation room exists.
- The area grade is low — what's the realistic commute time and amenity access for the typical tenant pool here? Any planned neighborhood developments (good or bad) we should know about?
- What's the average days-on-market for RENTAL listings here right now (not sales)? A rising rental-DOM trend means longer vacancies and softer asking-rent achievability than the comps imply.
- What's the recent tenant-quality profile in this submarket — average credit score on applications, eviction rate, late-payment / NSF rate, and stable-employment percentage? A property-management company in the area should have these aggregated.
- How much new for-sale + rental construction is in the pipeline within 1–3 miles? Heavy new supply typically softens prices + rents 12–24 months out; constrained supply supports both.
Investment metrics
- 1% rule
- 0.93% ✗
- Cap rate
- 6.78%
- Cash-on-cash
- 1.73%
- DSCR
- 1.08
- GRM
- 9.0
CMA / ARV
- ARV (on-the-fly)
- $383,032
- Comps found
- 9
Show comp detail 9 sales within ~0.75 mi
| Address | Dist | Beds/Ba | Sqft | Sold | Price | $/sf | Match |
|---|---|---|---|---|---|---|---|
| 459 Mountain View Ave | 0.54mi | 3/1.0 | 1,559 (+3%) | 1mo | $396,150 | $254 | 68 |
| 109 Terrace Ln | 0.07mi | 4/1.0 (+1) | 1,677 (+11%) | 8mo | $360,500 | $215 | 66 |
| 160 Russell Rd | 0.52mi | 3/1.5 | 1,575 (+4%) | 5mo | $390,000 | $248 | 62 |
| 143 Old Route 209 | 0.57mi | 3/1.0 | 1,344 (-11%) | 0mo | $392,000 | $292 | 55 |
| 170 Old Route 209 | 0.64mi | 4/2.0 (+1) | 1,538 (+2%) | 5mo | $470,000 | $306 | 53 |
| 104 Benson Ct | 0.47mi | 3/1.0 | 1,328 (-12%) | 7mo | $349,900 | $263 | 52 |
| 231 Millbrook Ave | 0.32mi | 3/2.0 | 1,404 (-7%) | 24mo | $310,000 | $221 | 50 |
| 511 Walnut St | 0.59mi | 4/1.5 (+1) | 1,596 (+6%) | 8mo | $335,000 | $210 | 49 |
| 333 Overlook Dr | 0.64mi | 3/2.0 | 1,366 (-9%) | 18mo | $420,000 | $307 | 36 |
Match score weights: distance 35% · size 25% · config 20% · recency 20%. Top-matched comps best support the ARV.
Projected returns pro-forma
0.84% appreciation · 3.0% rent growth · sell at horizon
- IRR
- 2.6%
- Equity multiple
- 1.13×
- Total profit
- $15,654
- Equity at exit
- $141,616
- IRR
- 7.3%
- Equity multiple
- 1.87×
- Total profit
- $103,761
- Equity at exit
- $185,540
Cash invested: $119,000 (down + closing). Projections, not guarantees.
Landlord ↔ Tenant lean methodology
- Overall (STATE)
- 15 Strongly Tenant-Friendly
- State New York
- 15 Strongly Tenant-Friendly · D+10
- County
- — inherits STATE
- City
- — inherits STATE
ZIP-level market 12443
- Home prices YoY
- 0.3%
- Active inventory
- 31
- Price-to-rent
- 9.0×
Monthly cashflow live
- Estimated rent
- $3,950 medium interval (Pro) →
- Mortgage (P&I)
- −$2,229
- Tax from tax record
- −$543 /mo · $6,522/yr
- Insurance
- −$177
- HOA
- −$0
- Vacancy / Maint / Mgmt
- −$830
- Net cashflow
- $171
Break-even live
UW: 25.0% down · 7.5% · 30yr · 1.5% tax · 5.0% vac · 8.0% maint · 8.0% mgmt
Financing live
Cash to close
- Down payment
- $106,250
- Closing costs
- $12,750
- Reserves months
- —
- Total cash needed
- —
Loan-product check · same deal, 3 products live
Conventional
25% down · 7.5% · 30yr
- Down + closing
- —
- Monthly P&I
- —
- Monthly cashflow
- —
- DSCR
- —
- Eligible?
- —
Personal DTI + credit; lowest rate.
DSCR
20% down · 8.5% · 30yr
- Down + closing
- —
- Monthly P&I
- —
- Monthly cashflow
- —
- DSCR
- —
- Eligible?
- —
No personal income docs; deal must DSCR.
Hard money
10% down · 12.0% · 12mo
- Down + closing
- —
- Monthly P&I
- —
- Monthly cashflow
- —
- DSCR
- —
- Eligible?
- —
Short-term bridge; refi at stabilization.
Rent comps 1 comps
| Address | Beds | Baths | Sqft | Rent | $/sqft | DOM | Units | Dist |
|---|---|---|---|---|---|---|---|---|
| 111 Zandhoek Rd Hurley, NY | 3.0 | 1.5 | 1581 | $3,950 | $2.50 | 43d | 1 | 0.50mi |
Listing history 3 events
-
2026-05-12status Pending
-
2026-04-24historical Active Under Contract
-
2026-04-16$425,000 Active
ⓘ Source: listings_history table (triggers on properties + properties_extension) + one-shot
backfill from property_details.listing_events for pre-trigger history.
Tax reassessment forecast NY · Partial reset (capped growth)
- Current annual tax
- $6,522 · $543/mo
- Projected year-2 tax
- $6,852 · $571/mo
- Expected delta
- +$330/yr (+$28/mo · 5.1%)
ⓘ Screening estimate from a state-policy table — verify with the county assessor before closing.
Climate risk First Street
- Flood 1/10 Low FEMA zone X (unshaded) · 0% chance over 30 yrs
- Wildfire 1/10 Low
- Heat 4/10 Moderate 7 d/yr ≥99°F today · 15 d/yr by 30 yrs out
- Wind 3/10 Moderate 8% chance of damaging wind over 30 yrs
- Air quality 2/10 Low 0 unhealthy d/yr today · 1 by 30 yrs out
Nearby sold comps map
Loading sold comps map…
Walkable amenities ~0.75 mi
Loading nearby amenities…
Taxation est. · year 1
- Rental income
- $47,400
- − Mortgage interest
- −$23,807
- − Property taxes
- −$6,522
- − Insurance
- −$2,125
- − Repairs & maintenance
- −$3,792
- − Management
- −$3,792
- − Depreciation
- −$12,364
- Taxable loss
- −$5,001
- Est. tax savings @ 24.0%
- +$1,200
- After-tax cash flow
- $3,254/yr
For passive investors: Depreciation is non-cash, so a rental often shows a tax loss while cash-flowing — sheltering income. Rental losses are passive: they offset passive income freely, and up to $25,000/yr can offset ordinary (W-2) income if you actively participate and your MAGI is under $100k (phasing out to $0 by $150k); unused losses carry forward. On sale, claimed depreciation is recaptured at up to 25%, and gains may owe capital-gains tax (a 1031 exchange can defer both). Figures are a year-1 estimate at your 24.0% rate — not tax advice; consult a CPA.
Schools (NCES district)
- District
- Kingston City School District
- NCES district ID
- 3616290
- Math proficiency
- 44% ▲ 1.00%
- Reading proficiency
- 59% ▲ 20.00%
- Median HH income
- $52,586
- Composite
- 44.22/100
- National rank
- #2849
- State rank
- #355 of 590 in NY
Livability — Hurley
- Score
- 68/100
- State rank
- #543
- US rank
- #9765
Category grades
Schools grade is shown separately in the Schools card above.
Census & demographics
- Census place
- Hurley, NY
- Population (ZIP)
- 3,601
Population outlook (Ulster County) Hauer SSP2
- Today (2025)
- 175,887 people
- By 2030
- 171,876 · -2.3%
- By 2040
- 161,771 · -8.0%
- By 2050
- 151,470 · -13.9%
- By 2075
- 133,023 · -24.4%
- By 2100
- 113,504 · -35.5%
Race, ethnicity, and origin ACS 2023
- Neighborhood character
- Predominantly White (82%)
- Race & ethnicity
- White 82% Two or more races 8% Hispanic / Latino 6% Asian 3% Black 1%
- Hispanic origin (detail)
- Puerto Rican 1% Dominican 2%
- Common ancestry
- Iranian 5% Romanian 4% Scotch-Irish 4%
- Foreign-born
- 6% · Canada, Jamaica, South Korea
- Languages at home
- 91% English-only · Spanish 6% Other Asian/Pacific 1% Other Indo-European 1%
Political lean MEDSL · Ulster
- 2024 margin
- D (+18.7) · D 59.3% · R 40.7%
- 2008→2024 swing
- -4.9pp toward R · 2008: 23.6pp · 2024: 18.7pp
- All cycles
- 2024: D+18.7 2020: D+20.9 2016: D+9.1 2012: D+21.9 2008: D+23.6
Not yet ingested
- Civics
- —
Market trends
- HPI YoY
- ▲ 0.84%
- Current HPI
- 329.5547
- Rent YoY
- —
- Metro
- —
- State GDP YoY
- ▲ 2.60%
- F500 in state
- 92
Industry mix (Fortune 500 HQ in NY)
| Industry | F500 HQs | Revenue |
|---|---|---|
| Financial Services | 10 | $950B |
|
||
| Consumer Goods | 9 | $162B |
|
||
| Insurance | 4 | $225B |
|
||
| Telecommunications | 2 | $144B |
|
||
| Pharmaceuticals | 2 | $112B |
|
||
| Media / Entertainment | 2 | $69B |
|
||
Price history
3 events — show timeline
- 2026-05-12 Pending — HVCRMLS
- 2026-04-24 Contingent — HVCRMLS
- 2026-04-16 Listed $425,000 HVCRMLS
Property tax history
+2.3%/yrLatest (2025): $6,522 · -0.5% YoY. Source: county tax records.
Cash-flow waterfall
monthlySold comps — $/sqft
last 12 mo · ≤1 miLoading sold comps…