15 E Jefferson Rd · Pittsford, NY
Flood risk 1/10 · Minimal
- FEMA flood zone
- X (unshaded)
- Chance of flooding over 30 yrs
- 0.0%
- Est. flood insurance / yr
- $473 – $860
Fire risk 1/10 · Minimal
- Est. fire insurance / yr
- $691 – $1,283
Heat risk 2/10 · Minimal
- Hot days now (above 95°F)
- 7 days/yr
- Hot days in 30 yrs
- 16 days/yr
Wind risk 1/10 · Minimal
- Chance of severe wind over 30 yrs
- —
Air-quality risk 2/10 · Minimal
- Unhealthy air days now
- 1 days/yr
- Unhealthy air days in 30 yrs
- 2 days/yr
Risk factors via First Street. Map © Google.
Why this score? — see what drove the D grade
The composite is a weighted blend of 9 inputs, each scored 0–100. Each bar is that input's sub-score; the figure is the points it added to the 100-point composite (weight × sub-score).
- ARV discount +15.0/15.0
- Schools +7.5/10.0
- Cash flow +6.0/30.0
- Livability +4.7/5.0
- Rent growth +2.5/5.0
- Condition / age +2.5/5.0
- 1% rule +2.4/10.0
- DSCR +0.3/10.0
- Appreciation +0.0/10.0
$419,900
🖨 Deal sheet (PDF) 📄 Offer letter ✓ Due diligence
Listing remarks
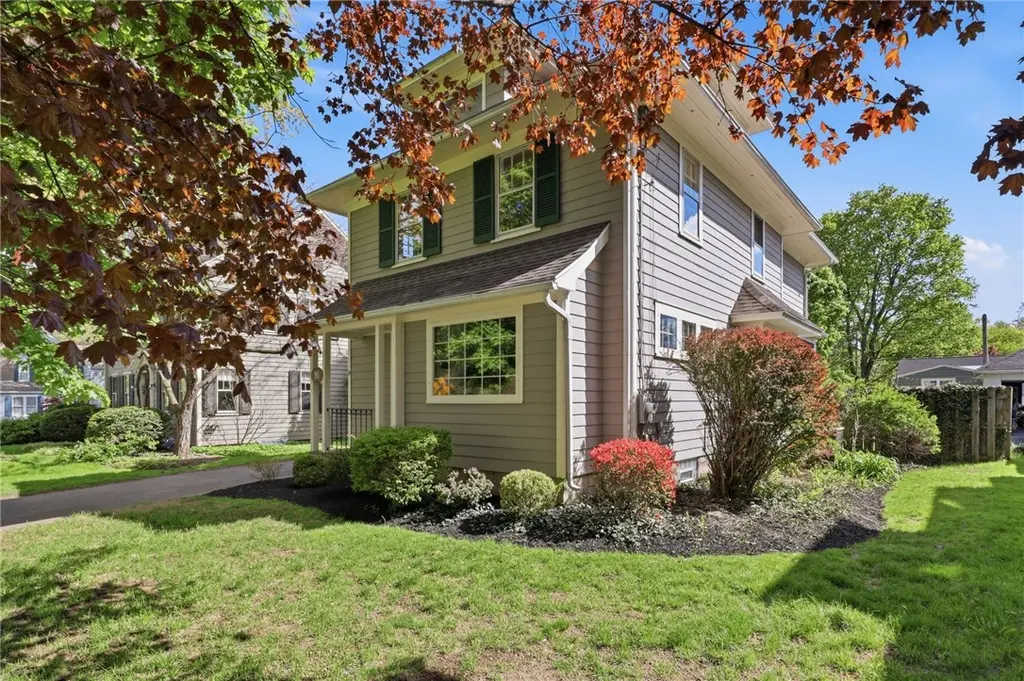
Nestled in the heart of the Historic Village of Pittsford, this stunning 4-bedroom, 2 full bath, 2 half bath Craftsman-style home is rich with timeless character, exquisite craftsmanship, and thoughtfully updated modern amenities. From the moment you step inside, you’ll be captivated by the home’s beautiful original natural woodwork, substantial moldings, classic trim details, and beautifully refinished hardwood floors that showcase the enduring charm and quality of true Craftsman architecture. Completely renovated from top to bottom, this home seamlessly blends historic elegance with today’s conveniences. The brand-new kitchen is both stylish and functional, featuring qua
Key facts
- Classic trim details
- Substantial moldings
- Brand-new kitchen
Tags
Property features AI
Exterior
- Parking: Detached garage; Approximately 2.5 garage spaces
- Utilities: High-speed internet available; Public water connected; Sewer connected; Circuit breaker electric panel
- Home design: 3 stories; Existing (previously built) property; Shingle roof; Wood siding exterior; Block foundation; Main thoroughfare frontage; Rectangular lot (approx. 53 x 134)
- Construction: Wood siding construction; Shingle roof; Block foundation; Built previously (existing structure)
- Exterior features: Blacktop driveway; Deck; Covered porch; Fully fenced yard; Full fencing
Interior
- Kitchen: Dishwasher; Gas oven; Gas range; Range hood; Refrigerator
- Bedrooms: Total of 9 rooms (includes bedrooms and living spaces)
- Flooring: Carpet; Hardwood; Luxury vinyl; Tile; Varied flooring types
- Bathrooms: 2 full bathrooms; 2 half bathrooms; One main-level bathroom
- Heating & cooling: Gas forced-air heating; Central air conditioning
- Interior features: Skylights; Attic; Separate/formal dining room; Kitchen island; Solid surface counters; Walk-in pantry; Natural woodwork
- Laundry & utility: Laundry on main level; Laundry in basement; Gas water heater
Neighborhood map
What this means for you Summary
Snapshot
- This is a 3-bed/1.5-bath single-family listed at $420k.
Deal economics
- At list price, monthly cash flow is $-804 ($-10k/yr) — negative.
- To cash-flow at today's rent, offer at most $278k (33.8% below list).
- To meet the 1% rule (rent ≥ 1% of price), the offer needs to be $311k (25.8% below list).
- Recommended offer: $278k (33.8% below list) — sets the bar for cash-flow.
- Cap rate 4.0% vs local median 2.6% in Pittsford — top-decile yield for the area; either an underpriced asset or a hidden risk that comps aren't pricing in. Stress-test before assuming the spread holds.
Location & tenants
- Location reads 94/100 on livability (#1 in NY, #10 nationally) — a professional / high-income tenant draw. Strengths: crime A+, commute A+, employment A+; Watch: cost of living D.
- Pittsford Central School District (suburban): math 80% / reading 84% proficiency, ranked #34 of 590 in NY (top 6%) — strong family-tenant draw, lease renewals of 3-5y typical; only 2% free/reduced lunch — higher-income household profile.
- Zoned schools: Jefferson Road School (math 82% / reading 87%, grade A+, #93 of 2,108 statewide, top 6%, 471 students, 0% FRL); Calkins Road Middle School (math 67% / reading 82%, grade A, #61 of 729 statewide, top 9%, 638 students, 0% FRL); Pittsford Sutherland High School (math 100% / reading 87%, grade A+, #141 of 1,100 statewide, top 13%, 898 students, 0% FRL) — zoned schools at 0% FRL track the district average.
- Market conditions: 188 active listings in the ZIP; 6 comparable units currently listed for rent nearby; rentals at typical pace (median 23d on market — plan ~3-4 weeks tenant-placement turnaround); high-income renter base; 1,169 units permitted in Monroe County in 2024 (591 in 5+ unit buildings).
Forward outlook
- Local home prices are declining (-3.0%/yr); year-one equity from $3k of loan paydown is wiped out by about $13k of value loss. Plan a longer hold.
- Monroe County population projected to shrink 6% by 2050 — rents likely to lag national; underwrite the cash flow, not the appreciation.
Negotiation context
- Only 6 days on market — expect competitive offers; lowballing is unlikely to land.
- Current owner paid $118k; list at $420k implies a 256% gain — meaningful room to come down on a strong offer.
Risks & watch-outs
- Watch-outs: property tax is 2.5% of price; built in 1926 — expect roof / HVAC / electrical / plumbing capex.
Questions for the listing agent
- What do current leases actually rent for vs. the listed asking? Can we see a recent rent roll and the last 12 months of T-12 income?
- Built in 1926 — when were the roof, HVAC, electrical panel, plumbing, and water heater last replaced?
- Property tax is high relative to price — has the assessment been appealed recently, and will the sale trigger a re-assessment?
- Is there a deadline driving the sale (1031 exchange, divorce, estate, relocation)? That informs how much negotiation room exists.
- Schools are A-rated — typically a magnet for longer-tenancy family renters. What's the average tenant stay here, and is there a school-zone premium baked into asking?
- The area grade is low — what's the realistic commute time and amenity access for the typical tenant pool here? Any planned neighborhood developments (good or bad) we should know about?
- What's the average days-on-market for RENTAL listings here right now (not sales)? A rising rental-DOM trend means longer vacancies and softer asking-rent achievability than the comps imply.
- What's the recent tenant-quality profile in this submarket — average credit score on applications, eviction rate, late-payment / NSF rate, and stable-employment percentage? A property-management company in the area should have these aggregated.
- How much new for-sale + rental construction is in the pipeline within 1–3 miles? Heavy new supply typically softens prices + rents 12–24 months out; constrained supply supports both.
Investment metrics
- 1% rule
- 0.74% ✗
- Cap rate
- 3.99%
- Cash-on-cash
- -8.21%
- DSCR
- 0.63
- GRM
- 11.2
CMA / ARV
- ARV (median comp)
- $524,038
- List price
- $419,900
- Delta
- -19.87%
- Verdict
- UNDERPRICED
- Comps
- 20 within 1.0 mi
Show comp detail 12 sales within ~0.75 mi
| Address | Dist | Beds/Ba | Sqft | Sold | Price | $/sf | Match |
|---|---|---|---|---|---|---|---|
| 92 S Main St | 0.10mi | 3/2.0 | 1,742 (+5%) | 11mo | $253,500 | $146 | 76 |
| 75 South St | 0.25mi | 3/2.0 | 1,576 (-5%) | 5mo | $430,000 | $273 | 74 |
| 5 Reitz Cir | 0.25mi | 3/2.5 | 1,714 (+3%) | 12mo | $606,500 | $354 | 69 |
| 2 Hilltop Dr | 0.44mi | 3/2.5 | 1,722 (+4%) | 2mo | $446,200 | $259 | 67 |
| 9 Sutherland St | 0.43mi | 3/2.0 | 1,646 (-1%) | 13mo | $636,000 | $386 | 66 |
| 2 Village Grv | 0.17mi | 3/2.5 | 1,832 (+11%) | 8mo | $525,000 | $287 | 64 |
| 7 Boughton Ave | 0.31mi | 3/2.5 | 1,604 (-3%) | 16mo | $430,000 | $268 | 64 |
| 14 Courtenay Cir | 0.43mi | 3/2.5 | 1,616 (-2%) | 13mo | $440,000 | $272 | 62 |
| 49 Reitz Pkwy | 0.22mi | 3/3.0 | 1,456 (-12%) | 8mo | $480,000 | $330 | 57 |
| 11 Washington Rd | 0.72mi | 3/1.5 | 1,636 (-1%) | 11mo | $375,000 | $229 | 55 |
| 7 Brook Rd | 0.71mi | 3/1.5 | 1,556 (-6%) | 4mo | $335,000 | $215 | 53 |
| 34 Crestview Dr | 0.58mi | 3/2.5 | 1,861 (+12%) | 11mo | $508,000 | $273 | 39 |
Match score weights: distance 35% · size 25% · config 20% · recency 20%. Top-matched comps best support the ARV.
Projected returns pro-forma
-3.0% appreciation · 3.0% rent growth · sell at horizon
- IRR
- -30.6%
- Equity multiple
- -0.01×
- Total profit
- $-118,992
- Equity at exit
- $62,608
- IRR
- -32.6%
- Equity multiple
- -0.43×
- Total profit
- $-168,473
- Equity at exit
- $36,305
Cash invested: $117,572 (down + closing). Projections, not guarantees.
Landlord ↔ Tenant lean methodology
- Overall (STATE)
- 15 Strongly Tenant-Friendly
- State New York
- 15 Strongly Tenant-Friendly · D+10
- County
- — inherits STATE
- City
- — inherits STATE
ZIP-level market 14534
- Active inventory
- 188
- Price-to-rent
- 11.2×
Monthly cashflow live
- Estimated rent
- $3,115 high interval (Pro) →
- Mortgage (P&I)
- −$2,202
- Tax from tax record
- −$888 /mo · $10,652/yr
- Insurance
- −$175
- HOA
- −$0
- Vacancy / Maint / Mgmt
- −$654
- Net cashflow
- $-804
Break-even live
Sensitivity live
| Price | -10% $-567 | -5% $-685 | +0% $-804 | +5% $-923 | +10% $-1,042 |
|---|---|---|---|---|---|
| Rent | -10% $-1,050 | -5% $-927 | +0% $-804 | +5% $-681 | +10% $-558 |
| Rate | -1.0pp $-593 | -0.5pp $-697 | base $-804 | +0.5pp $-913 | +1.0pp $-1,024 |
UW: 25.0% down · 7.5% · 30yr · 1.5% tax · 5.0% vac · 8.0% maint · 8.0% mgmt
Financing live
Cash to close
- Down payment
- $104,975
- Closing costs
- $12,597
- Reserves months
- —
- Total cash needed
- —
Loan-product check · same deal, 3 products live
Conventional
25% down · 7.5% · 30yr
- Down + closing
- —
- Monthly P&I
- —
- Monthly cashflow
- —
- DSCR
- —
- Eligible?
- —
Personal DTI + credit; lowest rate.
DSCR
20% down · 8.5% · 30yr
- Down + closing
- —
- Monthly P&I
- —
- Monthly cashflow
- —
- DSCR
- —
- Eligible?
- —
No personal income docs; deal must DSCR.
Hard money
10% down · 12.0% · 12mo
- Down + closing
- —
- Monthly P&I
- —
- Monthly cashflow
- —
- DSCR
- —
- Eligible?
- —
Short-term bridge; refi at stabilization.
Rent comps 6 comps
| Address | Beds | Baths | Sqft | Rent | $/sqft | DOM | Units | Dist |
|---|---|---|---|---|---|---|---|---|
| 74 S Main St Pittsford, NY | 4.0 | 2.0 | 1846 | $3,350 | $1.81 | 45d | 1 | 0.07mi |
| 20 Boughton Ave Pittsford, NY | 3.0 | 2.5 | 1653 | $3,200 | $1.94 | 16d | 1 | 0.30mi |
| 7 Courtenay Cir Pittsford, NY | 4.0 | 2.0 | 1833 | $3,400 | $1.85 | 23d | 1 | 0.42mi |
| 3650 Monroe Ave Pittsford, NY | 2.0 | 2.0 | 1100 | $1,825 | $1.66 | 4d | 1 | 1.02mi |
| 99 Brittany Ln Pittsford, NY | 2.0–3.0 | 2.0 | 1590 | $2,679 | $1.68 | 4d | 1 | 1.14mi |
| 6 Cullens Run Pittsford, NY | 4.0 | 2.0 | 1300 | $3,000 | $2.31 | 45d | 1 | 1.26mi |
Listing history 4 events
-
2026-05-13$419,900 Active 1761-char remark
-
2001-10-16soldstatus $118,000
-
1995-12-04soldstatus $101,000
-
1994-07-29soldstatus $93,500
ⓘ Source: listings_history table (triggers on properties + properties_extension) + one-shot
backfill from property_details.listing_events for pre-trigger history.
Tax reassessment forecast NY · Partial reset (capped growth)
- Current annual tax
- $10,652 · $888/mo
- Projected year-2 tax
- $10,652 · $888/mo
- Expected delta
- $0/yr ($0/mo · 0.0%)
ⓘ Screening estimate from a state-policy table — verify with the county assessor before closing.
Climate risk First Street
- Flood 1/10 Low FEMA zone X (unshaded) · 0% chance over 30 yrs
- Wildfire 1/10 Low
- Heat 2/10 Low 7 d/yr ≥95°F today · 16 d/yr by 30 yrs out
- Wind 1/10 Low
- Air quality 2/10 Low 1 unhealthy d/yr today · 2 by 30 yrs out
Nearby sold comps map
Loading sold comps map…
Walkable amenities ~0.75 mi
Loading nearby amenities…
Taxation est. · year 1
- Rental income
- $37,374
- − Mortgage interest
- −$23,521
- − Property taxes
- −$10,652
- − Insurance
- −$2,100
- − Repairs & maintenance
- −$2,990
- − Management
- −$2,990
- − Depreciation
- −$12,215
- Taxable loss
- −$17,094
- Est. tax savings @ 24.0%
- +$4,103
- After-tax cash flow
- $-5,548/yr
For passive investors: Depreciation is non-cash, so a rental often shows a tax loss while cash-flowing — sheltering income. Rental losses are passive: they offset passive income freely, and up to $25,000/yr can offset ordinary (W-2) income if you actively participate and your MAGI is under $100k (phasing out to $0 by $150k); unused losses carry forward. On sale, claimed depreciation is recaptured at up to 25%, and gains may owe capital-gains tax (a 1031 exchange can defer both). Figures are a year-1 estimate at your 24.0% rate — not tax advice; consult a CPA.
Schools (NCES district)
- District
- Pittsford Central School District
- NCES district ID
- 3623160
- Math proficiency
- 80% ▼ -4.00%
- Reading proficiency
- 84% ▲ 7.00%
- Median HH income
- $106,940
- Composite
- 74.75/100
- National rank
- #151
- State rank
- #34 of 590 in NY
Livability — Pittsford
- Score
- 94/100
- State rank
- #1
- US rank
- #10
Category grades
Schools grade is shown separately in the Schools card above.
Census & demographics
- Census place
- Pittsford, NY
- County
- Monroe County · 674,131 people
- City population
- 33,230
- Metro
- Rochester, NY
- Population (ZIP)
- 33,230
- Household income
- $143,694
- Rent vs Own
- Severe rent burden
- 398.0
Population outlook (Monroe County) Hauer SSP2
- Today (2025)
- 759,460 people
- By 2030
- 757,154 · -0.3%
- By 2040
- 740,644 · -2.5%
- By 2050
- 714,443 · -5.9%
- By 2075
- 645,883 · -15.0%
- By 2100
- 547,084 · -28.0%
Race, ethnicity, and origin ACS 2023
- Neighborhood character
- Predominantly White (81%)
- Race & ethnicity
- White 81% Asian 8% Two or more races 6% Hispanic / Latino 4% Black 2%
- Common ancestry
- Romanian 5% Italian 4% Lithuanian 3%
- Foreign-born
- 12% · Canada, China, South Korea
- Languages at home
- 87% English-only · Other Indo-European 3% Chinese 2% Spanish 2%
Political lean MEDSL · Monroe
- 2024 margin
- D (+19.1) · D 59.5% · R 40.5%
- 2008→2024 swing
- +1.4pp toward D · 2008: 17.7pp · 2024: 19.1pp
- All cycles
- 2024: D+19.1 2020: D+21.0 2016: D+14.1 2012: D+17.4 2008: D+17.7
Not yet ingested
- Civics
- —
Market trends
- HPI YoY
- ▼ -232.40%
- Current HPI
- 258.0726
- Rent YoY
- —
- Metro
- Rochester, NY
- State GDP YoY
- ▲ 2.60%
- F500 in state
- 92
Industry mix (Fortune 500 HQ in NY)
| Industry | F500 HQs | Revenue |
|---|---|---|
| Financial Services | 10 | $950B |
|
||
| Consumer Goods | 9 | $162B |
|
||
| Insurance | 4 | $225B |
|
||
| Telecommunications | 2 | $144B |
|
||
| Pharmaceuticals | 2 | $112B |
|
||
| Media / Entertainment | 2 | $69B |
|
||
Price history
+349.1% since first listed5 events — show timeline
- 2026-05-19 Pending — UNYREIS
- 2026-05-13 Listed $419,900 UNYREIS
- 2001-10-16 Sold (Public Records) $118,000 Public Records
- 1995-12-04 Sold (Public Records) $101,000 Public Records
- 1994-07-29 Sold (Public Records) $93,500 Public Records
Property tax history
+2.6%/yrLatest (2025): $10,652 · +8.5% YoY. Source: county tax records.
Cash-flow waterfall
monthlySold comps — $/sqft
last 12 mo · ≤1 miLoading sold comps…