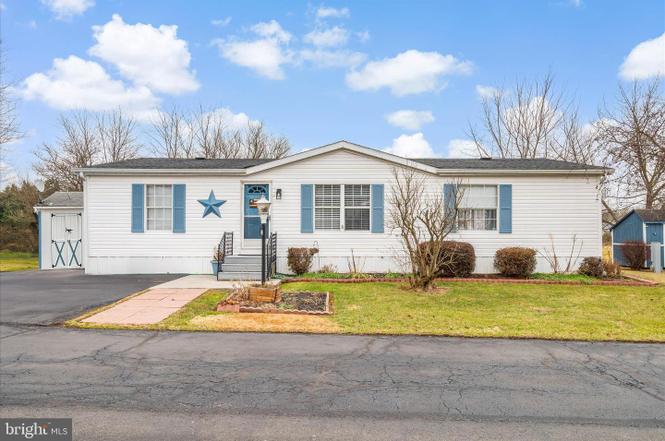
27 Bonneau Heights Rd · Bonneauville, PA
Flood risk 1/10 · Minimal
- FEMA flood zone
- X (unshaded)
- Chance of flooding over 30 yrs
- 0.0%
- Est. flood insurance / yr
- $507 – $1,088
Fire risk 1/10 · Minimal
- Est. fire insurance / yr
- $511 – $949
Heat risk 5/10 · Moderate
- Hot days now (above 102°F)
- 7 days/yr
- Hot days in 30 yrs
- 15 days/yr
Wind risk 4/10 · Minor
- Chance of severe wind over 30 yrs
- 8.0%
Air-quality risk 2/10 · Minimal
- Unhealthy air days now
- 1 days/yr
- Unhealthy air days in 30 yrs
- 3 days/yr
Risk factors via First Street. Map © Google.
Why this score? — see what drove the B- grade
The composite is a weighted blend of 9 inputs, each scored 0–100. Each bar is that input's sub-score; the figure is the points it added to the 100-point composite (weight × sub-score).
- Cash flow +30.0/30.0
- 1% rule +10.0/10.0
- DSCR +10.0/10.0
- ARV discount +7.5/15.0
- Schools +4.1/10.0
- Livability +3.2/5.0
- Rent growth +2.5/5.0
- Condition / age +2.5/5.0
- Appreciation +0.0/10.0
$80,000
🖨 Deal sheet 📄 Offer letter ✓ Due diligence
Listing remarks
Back on the market at NO FAULT of the seller. Bring your offer! Welcome to 27 Bonneau Heights Rd in the Bonneau Heights community of Gettysburg. This home offers 3 bedrooms and 2 full bathrooms with a functional, open floor plan designed for comfortable one-level living. The home features a spacious living area, an eat-in kitchen with ample cabinetry, and a private primary suite with its own full bath. Two additional bedrooms and a second full bathroom provide flexibility for guests, a home office, or additional living space. Walk out to the partially covered rear deck for outdoor enjoyment, and take advantage of the storage shed for added convenience. Lot rent includes water and sewer, tr
Key facts
- Built 1991
- Listed 107 days
Property features AI
Finance
- Other: Not located in a federal flood zone; Property condition reported as good; Located in the Bonneau Heights park; use GPS for directions; Living area source: Assessor
- Financial info: Annual ground rent payment; Improvement assessed value listed
- HOA & community: Ground rent exists (paid monthly)
Exterior
- Parking: Asphalt driveway
- Utilities: Public water; Public sewer; Electric available; Cable TV available; Phone available; Propane (community)
- Home design: Manufactured double-wide home; Estimated year built
- Construction: Vinyl siding; Asphalt roof; Above-grade and below-grade structures noted
- Exterior features: Deck(s); Shed; Other exterior features
Interior
- Kitchen: Cooktop; Stove; Dishwasher; Refrigerator; Freezer; Microwave; Water heater
- Bedrooms: Three bedrooms on the main level
- Flooring: Carpet
- Bathrooms: Two full bathrooms
- Heating & cooling: Forced air heating; Propane (metered) heating fuel; Central air conditioning; Electric hot water
- Interior features: Combination kitchen and dining area; Dining area; Ceiling fan(s); Master bathroom; Entry-level bedroom; Other
- Laundry & utility: Main-floor laundry
Neighborhood map
What this means for you Summary
Snapshot
- This is a 2-bed/2.0-bath manufactured listed at $80k.
Deal economics
- At list price, monthly cash flow is $552 ($7k/yr) — positive.
- The deal already cash-flows at list — no discount required.
- Meets the 1% rule at list price ($1k rent vs $80k).
- Recommended offer: $73k (9.0% below list) — sets the bar for market timing.
Location & tenants
- Location reads 65/100 on livability (#1,134 in PA) — a middle-class / working-renter tenant base. Strengths: crime A+, cost of living A+, housing A+; Watch: schools F, amenities F, commute F.
- Conewago Valley SD (suburban): math 39% / reading 56% proficiency, ranked #215 of 539 in PA (top 40%) — families likely to look elsewhere, expect single-tenant / working-renter base with shorter leases.
- Market conditions: 313 active listings in the ZIP; solid renter incomes; 403 units permitted in Adams County in 2024 (0 in 5+ unit buildings).
Forward outlook
- Local home prices are declining (-3.0%/yr); year-one equity from $553 of loan paydown is wiped out by about $2k of value loss. Plan a longer hold.
- Adams County population projected at -10% by 2050 — secular population decline; favor cash flow + early exit over multi-decade hold.
- At projected returns (-3.0% appreciation + 3.0% rent growth), your $22k cash investment doubles in ~5 years — after that, you're playing with house money.
Negotiation context
- It's been on market 107 days — a 9% lower offer ($73k) is reasonable based on typical stale-listing flexibility.
- 3 sale attempts since 8y ago; this cycle's ask has dropped $20k (20%) from the opening price — seller is motivated, your offer sets the floor, not the list.
- Current owner paid $23k; list at $80k implies a 248% gain — meaningful room to come down on a strong offer.
Risks & watch-outs
- Climate carrying-cost: extreme-heat days projected 7→15/yr by 2055 (HVAC capex compounding) — expect insurance premiums to compound above CPI over the hold.
Questions for the listing agent
- It's been on market 107 days. Have you received any prior offers? Is the seller open to a 9% concession, seller financing, or rate buy-down credit?
- Why hasn't it sold? Are there any deal-killer items the seller is aware of (foundation, flood, title, zoning, code violations)?
- Is there a deadline driving the sale (1031 exchange, divorce, estate, relocation)? That informs how much negotiation room exists.
- Schools are F-rated, which usually means shorter tenancies and higher turnover. Who's the typical renter profile here, and what's been the actual vacancy rate?
- What's the average days-on-market for RENTAL listings here right now (not sales)? A rising rental-DOM trend means longer vacancies and softer asking-rent achievability than the comps imply.
- What's the recent tenant-quality profile in this submarket — average credit score on applications, eviction rate, late-payment / NSF rate, and stable-employment percentage? A property-management company in the area should have these aggregated.
- How much new for-sale + rental construction is in the pipeline within 1–3 miles? Heavy new supply typically softens prices + rents 12–24 months out; constrained supply supports both.
Investment metrics
- 1% rule
- 1.73% ✓
- Cap rate
- 14.57%
- Cash-on-cash
- 29.55%
- DSCR
- 2.31
- GRM
- 4.8
CMA / ARV
No comps found within radius.
Projected returns pro-forma
-3.0% appreciation · 3.0% rent growth · sell at horizon
- IRR
- 24.0%
- Equity multiple
- 1.99×
- Total profit
- $22,185
- Equity at exit
- $11,928
- IRR
- 31.9%
- Equity multiple
- 3.88×
- Total profit
- $64,620
- Equity at exit
- $6,917
Cash invested: $22,400 (down + closing). Projections, not guarantees.
Landlord ↔ Tenant lean methodology
- Overall (STATE)
- 62 Landlord-Friendly
- State Pennsylvania
- 62 Landlord-Friendly · EVEN
- County
- — inherits STATE
- City
- — inherits STATE
ZIP-level market 17325
- Home prices YoY
- -22.4%
- Active inventory
- 313
- Price-to-rent
- 4.8×
Monthly cashflow live
- Estimated rent
- $1,386 medium interval (Pro) →
- Mortgage (P&I)
- −$420
- Tax from tax record
- −$91 /mo · $1,087/yr
- Insurance
- −$33
- HOA
- −$0
- Vacancy / Maint / Mgmt
- −$291
- Net cashflow
- $552
Break-even live
UW: 25.0% down · 7.5% · 30yr · 1.5% tax · 5.0% vac · 8.0% maint · 8.0% mgmt
Financing live
Cash to close
- Down payment
- $20,000
- Closing costs
- $2,400
- Reserves months
- —
- Total cash needed
- —
Loan-product check · same deal, 3 products live
Conventional
25% down · 7.5% · 30yr
- Down + closing
- —
- Monthly P&I
- —
- Monthly cashflow
- —
- DSCR
- —
- Eligible?
- —
Personal DTI + credit; lowest rate.
DSCR
20% down · 8.5% · 30yr
- Down + closing
- —
- Monthly P&I
- —
- Monthly cashflow
- —
- DSCR
- —
- Eligible?
- —
No personal income docs; deal must DSCR.
Hard money
10% down · 12.0% · 12mo
- Down + closing
- —
- Monthly P&I
- —
- Monthly cashflow
- —
- DSCR
- —
- Eligible?
- —
Short-term bridge; refi at stabilization.
Listing history 12 events
-
2026-04-30status Pending
-
2026-04-16price $80,000
-
2026-04-16status Active
-
2026-04-08historical Active Under Contract
-
2026-03-30price $85,000
-
2026-03-21price $90,000
-
2026-02-17price $95,000
-
2026-01-05$99,900 Active
-
2026-01-01historical $99,900
-
2018-04-12soldstatus $23,000
-
2018-03-02historical
-
2018-02-05$25,000
ⓘ Source: listings_history table (triggers on properties + properties_extension) + one-shot
backfill from property_details.listing_events for pre-trigger history.
Tax reassessment forecast PA · Partial reset (capped growth)
- Current annual tax
- $1,087 · $91/mo
- Projected year-2 tax
- $1,175 · $98/mo
- Expected delta
- +$89/yr (+$7/mo · 8.1%)
ⓘ Screening estimate from a state-policy table — verify with the county assessor before closing.
Climate risk First Street
- Flood 1/10 Low FEMA zone X (unshaded) · 0% chance over 30 yrs
- Wildfire 1/10 Low
- Heat 5/10 Major 7 d/yr ≥102°F today · 15 d/yr by 30 yrs out
- Wind 4/10 Moderate 8% chance of damaging wind over 30 yrs
- Air quality 2/10 Low 1 unhealthy d/yr today · 3 by 30 yrs out
Nearby sold comps map
Loading sold comps map…
Walkable amenities ~0.75 mi
Loading nearby amenities…
Taxation est. · year 1
- Rental income
- $16,634
- − Mortgage interest
- −$4,481
- − Property taxes
- −$1,087
- − Insurance
- −$400
- − Repairs & maintenance
- −$1,331
- − Management
- −$1,331
- − Depreciation
- −$2,327
- Taxable income
- $5,677
- Est. tax owed @ 24.0%
- −$1,362
- After-tax cash flow
- $5,257/yr
For passive investors: Depreciation is non-cash, so a rental often shows a tax loss while cash-flowing — sheltering income. Rental losses are passive: they offset passive income freely, and up to $25,000/yr can offset ordinary (W-2) income if you actively participate and your MAGI is under $100k (phasing out to $0 by $150k); unused losses carry forward. On sale, claimed depreciation is recaptured at up to 25%, and gains may owe capital-gains tax (a 1031 exchange can defer both). Figures are a year-1 estimate at your 24.0% rate — not tax advice; consult a CPA.
Schools (NCES district)
- District
- Conewago Valley SD
- NCES district ID
- 4206550
- Math proficiency
- 39% ▼ -15.00%
- Reading proficiency
- 56% ▼ -11.00%
- Median HH income
- $54,603
- Composite
- 41.08/100
- National rank
- #3572
- State rank
- #215 of 539 in PA
Livability — Bonneauville
- Score
- 65/100
- State rank
- #1134
- US rank
- #13009
Category grades
Schools grade is shown separately in the Schools card above.
Census & demographics
- County
- Adams County · 30,373 people
- Metro
- Gettysburg, PA
- Population (ZIP)
- 30,373
- Household income
- $80,948
- Rent vs Own
- Severe rent burden
- 447.0
Population outlook (Adams County) Hauer SSP2
- Today (2025)
- 102,494 people
- By 2030
- 101,890 · -0.6%
- By 2040
- 98,417 · -4.0%
- By 2050
- 92,014 · -10.2%
- By 2075
- 76,128 · -25.7%
- By 2100
- 58,931 · -42.5%
Race, ethnicity, and origin ACS 2023
- Neighborhood character
- Predominantly White (83%)
- Race & ethnicity
- White 83% Hispanic / Latino 9% Two or more races 5% Black 4% Asian 2%
- Hispanic origin (detail)
- Mexican 4% Puerto Rican 2%
- Common ancestry
- Romanian 3% Lithuanian 3% Serbian 2%
- Foreign-born
- 5% · Canada, China, Vietnam
- Languages at home
- 92% English-only · Spanish 4% Other Indo-European 1% Russian/Polish/Slavic 1%
Political lean MEDSL · Adams
- 2024 margin
- Solid R (+33.6) · D 32.7% · R 66.4%
- 2008→2024 swing
- -14.1pp toward R · 2008: -19.6pp · 2024: -33.6pp
- All cycles
- 2024: R+33.6 2020: R+34.1 2016: R+36.4 2012: R+27.6 2008: R+19.6
Not yet ingested
- Civics
- —
Market trends
- HPI YoY
- ▼ -81.49%
- Current HPI
- 282.6594
- Rent YoY
- —
- Metro
- Gettysburg, PA
- State GDP YoY
- ▲ 1.68%
- F500 in state
- 34
Industry mix (Fortune 500 HQ in PA)
| Industry | F500 HQs | Revenue |
|---|---|---|
| Healthcare | 2 | $309B |
|
||
| Insurance | 2 | $27B |
|
||
| Telecommunications / Media | 1 | $124B |
|
||
| Industrial Distribution | 1 | $22B |
|
||
| Financial Services | 1 | $20B |
|
||
| Chemicals / Materials | 1 | $18B |
|
||
Price history
+220.0% since first listed12 events — show timeline
- 2026-04-30 Pending — BRIGHT MLS
- 2026-04-16 Price Changed $80,000 BRIGHT MLS
- 2026-04-16 Relisted — BRIGHT MLS
- 2026-04-08 Contingent — BRIGHT MLS
- 2026-03-30 Price Changed $85,000 BRIGHT MLS
- 2026-03-21 Price Changed $90,000 BRIGHT MLS
- 2026-02-17 Price Changed $95,000 BRIGHT MLS
- 2026-01-05 Listed $99,900 BRIGHT MLS
- 2026-01-01 Coming Soon $99,900 BRIGHT MLS
- 2018-04-12 Sold (MLS) $23,000 BRIGHT MLS
- 2018-03-02 Listing Removed — BRIGHT MLS
- 2018-02-05 Listed $25,000 BRIGHT MLS
Property tax history
+3.7%/yrLatest (2026): $1,087 · +1.9% YoY. Source: county tax records.
Cash-flow waterfall
monthlySold comps — $/sqft
last 12 mo · ≤1 miLoading sold comps…