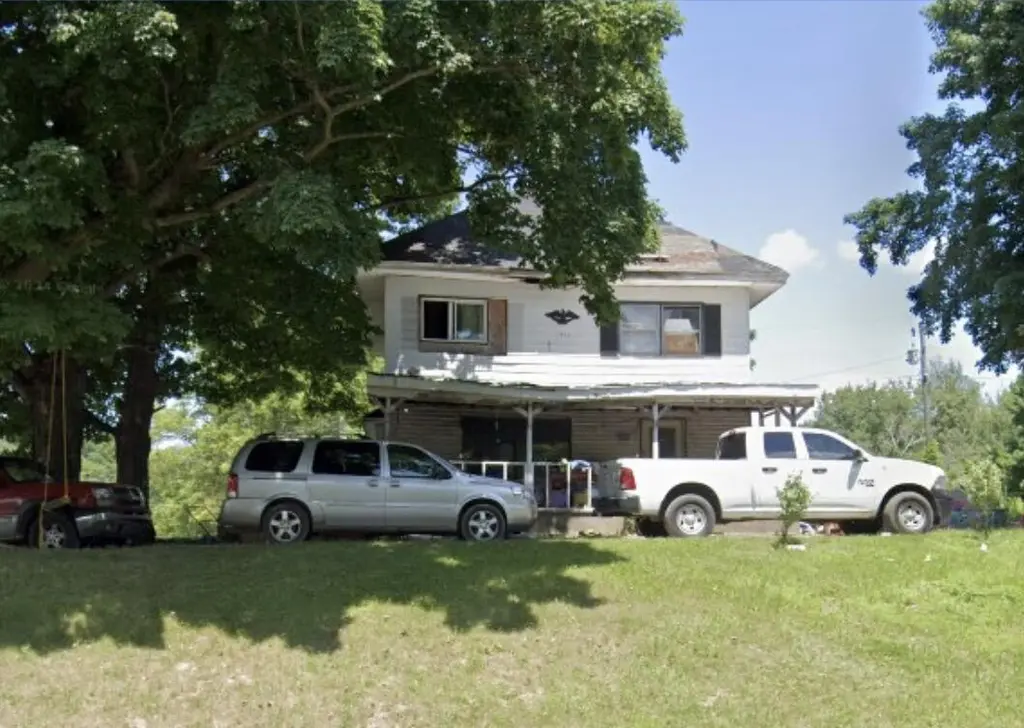
3456 E Harrison Rd · Elbridge, MI
Flood risk 1/10 · Minimal
- FEMA flood zone
- X (unshaded)
- Chance of flooding over 30 yrs
- 0.0%
- Est. flood insurance / yr
- $473 – $860
Fire risk 1/10 · Minimal
- Est. fire insurance / yr
- $784 – $1,456
Heat risk 1/10 · Minimal
- Hot days now (above 95°F)
- 7 days/yr
- Hot days in 30 yrs
- 15 days/yr
Wind risk 1/10 · Minimal
- Chance of severe wind over 30 yrs
- —
Air-quality risk 2/10 · Minimal
- Unhealthy air days now
- 1 days/yr
- Unhealthy air days in 30 yrs
- 1 days/yr
Risk factors via First Street. Map © Google.
Why this score? — see what drove the C+ grade
The composite is a weighted blend of 9 inputs, each scored 0–100. Each bar is that input's sub-score; the figure is the points it added to the 100-point composite (weight × sub-score).
- Cash flow +27.9/30.0
- DSCR +9.9/10.0
- 1% rule +7.6/10.0
- ARV discount +7.5/15.0
- Rent growth +2.5/5.0
- Livability +2.5/5.0
- Condition / age +2.5/5.0
- Schools +2.3/10.0
- Appreciation +0.0/10.0
$99,000
🖨 Deal sheet 📄 Offer letter ✓ Due diligence
Listing remarks MLS
Prime opportunity for a fixer-upper with a strong upside potential! Bring your vision and restore this property to it full potential. Great potential ROI - Sold as-is.
Key facts
- 4 acre lot
- Built 1911
- Listed 45 days
Property features AI
Exterior
- Utilities: Well water
- Home design: Single family residence; Residential property
- Construction: Built in 1911; Shingle roof; Other construction materials
- Exterior features: Paved road access; 4.0-acre lot
Interior
- Bathrooms: 1 full bathroom
- Heating & cooling: Wood heating
- Interior features: 9 total rooms; Full basement
Neighborhood map
What this means for you Summary
Snapshot
- This is a 4-bed/1.0-bath single-family listed at $99k.
Deal economics
- At list price, monthly cash flow is $304 ($4k/yr) — positive.
- The deal already cash-flows at list — no discount required.
- Meets the 1% rule at list price ($1k rent vs $99k).
- Recommended offer: $96k (3.0% below list) — sets the bar for market timing.
Location & tenants
- Location reads: area grade C — affects rentability + tenant quality, not the cash-flow math above.
- Hart Public School District (town): math 18% / reading 38% proficiency, ranked #399 of 540 in MI (top 74%) — low school quality limits family demand, transient renter base, plan for 1-2y turnover; 64% free/reduced lunch — lower-income household profile, screen leases tightly.
- Market conditions: 91 active listings in the ZIP; 147 units permitted in Oceana County in 2024 (0 in 5+ unit buildings).
Forward outlook
- Local home prices are declining (-3.0%/yr); year-one equity from $684 of loan paydown is wiped out by about $3k of value loss. Plan a longer hold.
- Oceana County population projected at -18% by 2050 — secular population decline; favor cash flow + early exit over multi-decade hold.
- At projected returns (-3.0% appreciation + 3.0% rent growth), your $28k cash investment doubles in ~9 years — after that, you're playing with house money.
Negotiation context
- It's been on market 45 days — a 3% lower offer ($96k) is reasonable based on typical stale-listing flexibility.
- 3 sale attempts; this cycle's ask has dropped $21k (18%) from the opening price — seller is motivated, your offer sets the floor, not the list.
- Current owner paid $40k; list at $99k implies a 148% gain — meaningful room to come down on a strong offer.
Risks & watch-outs
- Watch-outs: built in 1911 — expect roof / HVAC / electrical / plumbing capex.
Questions for the listing agent
- It's been on market 45 days. Have you received any prior offers? Is the seller open to a 3% concession, seller financing, or rate buy-down credit?
- Built in 1911 — when were the roof, HVAC, electrical panel, plumbing, and water heater last replaced?
- Is there a deadline driving the sale (1031 exchange, divorce, estate, relocation)? That informs how much negotiation room exists.
- What's the average days-on-market for RENTAL listings here right now (not sales)? A rising rental-DOM trend means longer vacancies and softer asking-rent achievability than the comps imply.
- What's the recent tenant-quality profile in this submarket — average credit score on applications, eviction rate, late-payment / NSF rate, and stable-employment percentage? A property-management company in the area should have these aggregated.
- How much new for-sale + rental construction is in the pipeline within 1–3 miles? Heavy new supply typically softens prices + rents 12–24 months out; constrained supply supports both.
Investment metrics
- 1% rule
- 1.26% ✓
- Cap rate
- 9.98%
- Cash-on-cash
- 13.17%
- DSCR
- 1.59
- GRM
- 6.6
CMA / ARV
No comps found within radius.
Projected returns pro-forma
-3.0% appreciation · 3.0% rent growth · sell at horizon
- IRR
- 3.1%
- Equity multiple
- 1.12×
- Total profit
- $3,352
- Equity at exit
- $14,761
- IRR
- 12.7%
- Equity multiple
- 2.01×
- Total profit
- $27,943
- Equity at exit
- $8,560
Cash invested: $27,720 (down + closing). Projections, not guarantees.
Landlord ↔ Tenant lean methodology
- Overall (STATE)
- 62 Landlord-Friendly
- State Michigan
- 62 Landlord-Friendly · EVEN
- County
- — inherits STATE
- City
- — inherits STATE
ZIP-level market 49420
- Home prices YoY
- -22.2%
- Active inventory
- 91
- Price-to-rent
- 6.6×
Monthly cashflow live
- Estimated rent
- $1,250 medium interval (Pro) →
- Mortgage (P&I)
- −$519
- Tax from tax record
- −$123 /mo · $1,475/yr
- Insurance
- −$41
- HOA
- −$0
- Vacancy / Maint / Mgmt
- −$263
- Net cashflow
- $304
Break-even live
UW: 25.0% down · 7.5% · 30yr · 1.5% tax · 5.0% vac · 8.0% maint · 8.0% mgmt
Financing live
Cash to close
- Down payment
- $24,750
- Closing costs
- $2,970
- Reserves months
- —
- Total cash needed
- —
Loan-product check · same deal, 3 products live
Conventional
25% down · 7.5% · 30yr
- Down + closing
- —
- Monthly P&I
- —
- Monthly cashflow
- —
- DSCR
- —
- Eligible?
- —
Personal DTI + credit; lowest rate.
DSCR
20% down · 8.5% · 30yr
- Down + closing
- —
- Monthly P&I
- —
- Monthly cashflow
- —
- DSCR
- —
- Eligible?
- —
No personal income docs; deal must DSCR.
Hard money
10% down · 12.0% · 12mo
- Down + closing
- —
- Monthly P&I
- —
- Monthly cashflow
- —
- DSCR
- —
- Eligible?
- —
Short-term bridge; refi at stabilization.
Listing history 22 events
-
2026-06-18days on market $99,000 Active 45 DOM
-
2026-06-17days on market $99,000 Active 44 DOM
-
2026-06-16days on market $99,000 Active 43 DOM
-
2026-06-15days on market $99,000 Active 42 DOM
-
2026-06-13days on market $99,000 Active 40 DOM
-
2026-06-12days on market $99,000 Active 39 DOM
-
2026-06-09days on market $99,000 Active 36 DOM
-
2026-06-08days on market $99,000 Active 35 DOM
-
2026-06-07days on market $99,000 Active 34 DOM
-
2026-06-07days on market $99,000 Active 33 DOM
-
2026-06-04days on market $99,000 Active 30 DOM
-
2026-06-02days on market $99,000 Active 29 DOM
-
2026-06-01days on market $99,000 Active 28 DOM
-
2026-05-31days on market $99,000 Active 27 DOM
-
2026-05-31days on market $99,000 Active 26 DOM
-
2026-05-09price $119,900 167-char remark
Show marketing remark (168 chars)
Prime opportunity for a fixer-upper with a strong upside potential! Bring your vision and restore this property to it full potential. Great potential ROI - Sold as-is.
-
2026-05-09price $119,900 168-char remark
Show marketing remark (168 chars)
Prime opportunity for a fixer-upper with a strong upside potential! Bring your vision and restore this property to it full potential. Great potential ROI - Sold as-is.
-
2026-05-08price $119,900
-
2026-04-13$120,000 Active 167-char remark
Show marketing remark (168 chars)
Prime opportunity for a fixer-upper with a strong upside potential! Bring your vision and restore this property to it full potential. Great potential ROI - Sold as-is.
-
2026-04-13$120,000 Active 168-char remark
Show marketing remark (168 chars)
Prime opportunity for a fixer-upper with a strong upside potential! Bring your vision and restore this property to it full potential. Great potential ROI - Sold as-is.
-
2026-04-13$120,000 Active
Show marketing remark (168 chars)
Prime opportunity for a fixer-upper with a strong upside potential! Bring your vision and restore this property to it full potential. Great potential ROI - Sold as-is.
-
2018-02-28soldstatus $40,000
ⓘ Source: listings_history table (triggers on properties + properties_extension) + one-shot
backfill from property_details.listing_events for pre-trigger history.
Tax reassessment forecast MI · Partial reset (capped growth)
- Current annual tax
- $1,475 · $123/mo
- Projected year-2 tax
- $1,500 · $125/mo
- Expected delta
- +$25/yr (+$2/mo · 1.7%)
ⓘ Screening estimate from a state-policy table — verify with the county assessor before closing.
Climate risk First Street
- Flood 1/10 Low FEMA zone X (unshaded) · 0% chance over 30 yrs
- Wildfire 1/10 Low
- Heat 1/10 Low 7 d/yr ≥95°F today · 15 d/yr by 30 yrs out
- Wind 1/10 Low
- Air quality 2/10 Low 1 unhealthy d/yr today · 1 by 30 yrs out
Nearby sold comps map
Loading sold comps map…
Walkable amenities ~0.75 mi
Loading nearby amenities…
Taxation est. · year 1
- Rental income
- $15,001
- − Mortgage interest
- −$5,546
- − Property taxes
- −$1,475
- − Insurance
- −$495
- − Repairs & maintenance
- −$1,200
- − Management
- −$1,200
- − Depreciation
- −$2,880
- Taxable income
- $2,205
- Est. tax owed @ 24.0%
- −$529
- After-tax cash flow
- $3,121/yr
For passive investors: Depreciation is non-cash, so a rental often shows a tax loss while cash-flowing — sheltering income. Rental losses are passive: they offset passive income freely, and up to $25,000/yr can offset ordinary (W-2) income if you actively participate and your MAGI is under $100k (phasing out to $0 by $150k); unused losses carry forward. On sale, claimed depreciation is recaptured at up to 25%, and gains may owe capital-gains tax (a 1031 exchange can defer both). Figures are a year-1 estimate at your 24.0% rate — not tax advice; consult a CPA.
Schools (NCES district)
- District
- Hart Public School District
- NCES district ID
- 2617860
- Math proficiency
- 18% ▼ -6.00%
- Reading proficiency
- 38% ▼ -4.00%
- Median HH income
- $37,795
- Composite
- 23.3/100
- National rank
- #7923
- State rank
- #399 of 540 in MI
Livability — Elbridge
No livability data for this city. (Only ~50 U.S. cities are tracked.)
Census & demographics
- Population (ZIP)
- 6,109
Population outlook (Oceana County) Hauer SSP2
- Today (2025)
- 25,141 people
- By 2030
- 24,324 · -3.2%
- By 2040
- 22,484 · -10.6%
- By 2050
- 20,561 · -18.2%
- By 2075
- 16,280 · -35.2%
- By 2100
- 11,376 · -54.8%
Race, ethnicity, and origin ACS 2023
- Neighborhood character
- Predominantly White (80%)
- Race & ethnicity
- White 80% Hispanic / Latino 15% Two or more races 7% Black 2%
- Hispanic origin (detail)
- Mexican 13%
- Common ancestry
- Iranian 7% Romanian 4% Italian 2%
- Foreign-born
- 6% · Canada
- Languages at home
- 88% English-only · Spanish 11%
Political lean MEDSL · Oceana
- 2024 margin
- Solid R (+30.0) · D 34.2% · R 64.2% · Other 1.6%
- 2008→2024 swing
- -34.4pp toward R · 2008: 4.3pp · 2024: -30.0pp
- All cycles
- 2024: R+30.0 2020: R+28.1 2016: R+27.3 2012: R+10.3 2008: D+4.3
Not yet ingested
- Civics
- —
Market trends
- HPI YoY
- ▼ -53.60%
- Current HPI
- 188.1779
- Rent YoY
- —
- Metro
- —
- State GDP YoY
- ▲ 1.37%
- F500 in state
- 28
Industry mix (Fortune 500 HQ in MI)
| Industry | F500 HQs | Revenue |
|---|---|---|
| Automotive Parts | 3 | $48B |
|
||
| Automotive | 2 | $372B |
|
||
| Chemicals | 1 | $45B |
|
||
| Automotive Retail | 1 | $29B |
|
||
| Healthcare / Medical Devices | 1 | $23B |
|
||
| Automotive Technology | 1 | $20B |
|
||
Price history
+147.5% since first listed10 events — show timeline
- 2026-05-29 Price Changed $99,000 MiRealSource-MiMLS
- 2026-05-28 Price Changed $99,000 REALCOMP
- 2026-05-28 Price Changed $99,000 SW Michigan MLS
- 2026-05-09 Price Changed $119,900 MiRealSource-MiMLS
- 2026-05-09 Price Changed $119,900 REALCOMP
- 2026-05-08 Price Changed $119,900 SW Michigan MLS
- 2026-04-13 Listed $120,000 SW Michigan MLS
- 2026-04-13 Listed $120,000 REALCOMP
- 2026-04-13 Listed $120,000 MiRealSource-MiMLS
- 2018-02-28 Sold (Public Records) $40,000 Public Records
Property tax history
+0.1%/yrLatest (2022): $1,475 · +34.9% YoY. Source: county tax records.
Cash-flow waterfall
monthlySold comps — $/sqft
last 12 mo · ≤1 miLoading sold comps…