164 Tom · West Livingston, TX
Flood risk 8/10 · Major
- FEMA flood zone
- X (unshaded)
- Chance of flooding over 30 yrs
- 0.99%
- Est. flood insurance / yr
- $507 – $1,088
Fire risk 4/10 · Minor
- Est. fire insurance / yr
- $1,222 – $2,270
Heat risk 8/10 · Major
- Hot days now (above 112°F)
- 7 days/yr
- Hot days in 30 yrs
- 24 days/yr
Wind risk 8/10 · Major
- Chance of severe wind over 30 yrs
- 98.0%
Air-quality risk 1/10 · Minimal
- Unhealthy air days now
- 0 days/yr
- Unhealthy air days in 30 yrs
- 0 days/yr
Risk factors via First Street. Map © Google.
Why this score? — see what drove the C+ grade
The composite is a weighted blend of 9 inputs, each scored 0–100. Each bar is that input's sub-score; the figure is the points it added to the 100-point composite (weight × sub-score).
- Cash flow +23.2/30.0
- ARV discount +15.0/15.0
- 1% rule +7.5/10.0
- DSCR +7.5/10.0
- Schools +3.2/10.0
- Rent growth +2.5/5.0
- Livability +2.5/5.0
- Condition / age +2.5/5.0
- Appreciation +0.0/10.0
$110,000
🖨 Deal sheet 📄 Offer letter ✓ Due diligence
Listing remarks
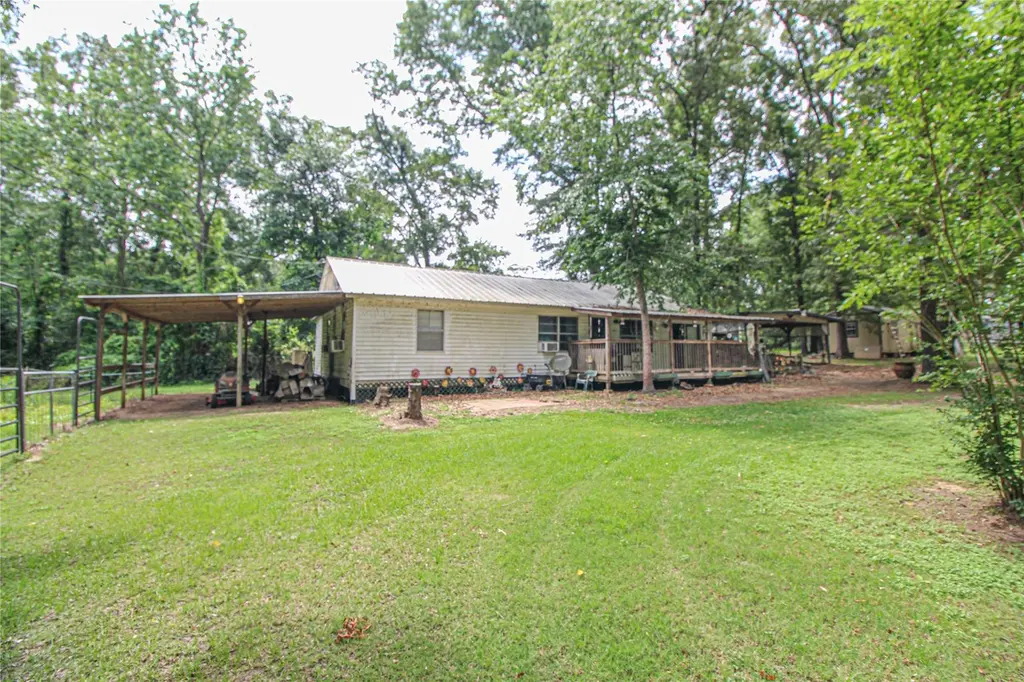
Escape to the tranquility of country living with this 2 bed, 2 bath home on a 1+ acre horse-ready property. Equipped with established horse shoots, corrals, carports, workshop, and storage building. The horse fences can provide other uses and are removable if not needed. Also ideal for a small-scale hobby farm. Just minutes from Lake Livingston and amenities, perfect for fishing and outdoor recreation. Home is SOLD-AS IS for you to add your personal touch and restore its vibrancy. Enjoy the peace and quiet while bringing your design vision to life.
Key facts
- Outdoor recreation
- Horse ready property
- 1.12 acre lot
Tags
Property features AI
Finance
- Other: Seller disclosure provided
- HOA & community: Part of Foresters Retreat association; Annual association fee of $72 covering common areas and recreation facilities; Community amenities include picnic area, playground, and park
Exterior
- Parking: Attached carport; Detached carport; Carport with space for 4 vehicles; Driveway; Additional parking; RV access/parking; Boat parking; Workshop in garage
- Utilities: Septic tank
- Home design: Residential property; Single-story layout (rooms listed on first floor)
- Construction: Built in 1981; Vinyl siding and wood siding exterior; Metal roof; Block foundation
- Exterior features: Cleared lot; Lot dimensions approximately 500 x 98; About 1.125 acres
Interior
- Kitchen: Electric range
- Bedrooms: Primary bedroom on first floor (14 x 10); Additional bedroom on first floor (18 x 10); 2 possible bedrooms total
- Bathrooms: 2 full bathrooms
- Heating & cooling: Window units for cooling
- Interior features: Ceiling fans; Kitchen and dining combined; 6 total rooms
- Laundry & utility: Washer hookup; Electric dryer hookup; Utility room on first floor (8 x 30)
Neighborhood map
What this means for you Summary
Snapshot
- This is a 2-bed/2.0-bath single-family listed at $110k.
Deal economics
- At list price, monthly cash flow is $133 ($2k/yr) — positive.
- The deal already cash-flows at list — no discount required.
- Meets the 1% rule at list price ($1k rent vs $110k).
- Recommended offer: $107k (3.0% below list) — sets the bar for market timing.
- Cap rate 8.5% vs local median 2.5% in West Livingston — top-decile yield for the area; either an underpriced asset or a hidden risk that comps aren't pricing in. Stress-test before assuming the spread holds.
Location & tenants
- Location reads 50/100 on livability (#1,501 in TX) — a working-class tenant base; expect higher turnover. Strengths: cost of living A+, housing A+; Watch: crime F, amenities F, commute F.
- Livingston ISD (rural): math 38% / reading 39% proficiency, ranked #459 of 826 in TX (top 56%) — families likely to look elsewhere, expect single-tenant / working-renter base with shorter leases.
- Zoned schools: Livingston J H (math 30% / reading 32%, grade F, #1,015 of 1,662 statewide, top 62%, 893 students, 62% FRL); Livingston H S (math 35% / reading 46%, grade F, #798 of 1,632 statewide, top 49%, 1,128 students, 51% FRL) — zoned schools at 57% FRL track the district average.
- Market conditions: 1186 active listings in the ZIP; 1 comparable units currently listed for rent nearby; 769 units permitted in Polk County in 2024 (0 in 5+ unit buildings).
Forward outlook
- Local home prices are declining (-3.0%/yr); year-one equity from $761 of loan paydown is wiped out by about $3k of value loss. Plan a longer hold.
- Polk County population projected at +16% by 2050 — long-run rental-demand tailwind backs the buy-and-hold thesis.
Negotiation context
- It's been on market 36 days — a 3% lower offer ($107k) is reasonable based on typical stale-listing flexibility.
Risks & watch-outs
- Watch-outs: property tax is 2.8% of price; flood insurance adds $66/mo.
- Climate carrying-cost: severe flood risk; severe wind risk, 98% chance of damaging wind over 30y; extreme-heat days projected 7→24/yr by 2055 (HVAC capex compounding) — expect insurance premiums to compound above CPI over the hold.
Questions for the listing agent
- It's been on market 36 days. Have you received any prior offers? Is the seller open to a 3% concession, seller financing, or rate buy-down credit?
- Property tax is high relative to price — has the assessment been appealed recently, and will the sale trigger a re-assessment?
- What's the actual annual flood-insurance premium (NFIP or private), and is the property in a SFHA with mandatory coverage?
- What does the HOA fee cover, when was the last increase, and are there any pending special assessments or reserve-fund shortfalls?
- Is there a deadline driving the sale (1031 exchange, divorce, estate, relocation)? That informs how much negotiation room exists.
- Schools are F-rated, which usually means shorter tenancies and higher turnover. Who's the typical renter profile here, and what's been the actual vacancy rate?
- Crime grade is F in this area — have there been break-ins, vandalism, or insurance claims at this property in the last 3 years? What carrier currently insures it and at what premium?
- What's the average days-on-market for RENTAL listings here right now (not sales)? A rising rental-DOM trend means longer vacancies and softer asking-rent achievability than the comps imply.
- What's the recent tenant-quality profile in this submarket — average credit score on applications, eviction rate, late-payment / NSF rate, and stable-employment percentage? A property-management company in the area should have these aggregated.
- How much new for-sale + rental construction is in the pipeline within 1–3 miles? Heavy new supply typically softens prices + rents 12–24 months out; constrained supply supports both.
Investment metrics
- 1% rule
- 1.25% ✓
- Cap rate
- 8.47%
- Cash-on-cash
- 7.79%
- DSCR
- 1.35
- GRM
- 6.7
CMA / ARV
- ARV (median comp)
- $197,478
- List price
- $110,000
- Delta
- -44.30%
- Verdict
- UNDERPRICED
- Comps
- 20 within 1.0 mi
Show comp detail 2 sales within ~0.75 mi
| Address | Dist | Beds/Ba | Sqft | Sold | Price | $/sf | Match |
|---|---|---|---|---|---|---|---|
| 2787 Mangum Rd | 0.14mi | 2/1.5 | 1,400 (-14%) | 9mo | $290,000 | $207 | 60 |
| 557 Star Dust Dr | 0.53mi | 3/2.0 (+1) | 1,538 (-6%) | 2mo | $239,900 | $156 | 59 |
Match score weights: distance 35% · size 25% · config 20% · recency 20%. Top-matched comps best support the ARV.
Projected returns pro-forma
-3.0% appreciation · 3.0% rent growth · sell at horizon
- IRR
- -8.1%
- Equity multiple
- 0.70×
- Total profit
- $-9,184
- Equity at exit
- $16,401
- IRR
- 1.6%
- Equity multiple
- 1.11×
- Total profit
- $3,513
- Equity at exit
- $9,511
Cash invested: $30,800 (down + closing). Projections, not guarantees.
Landlord ↔ Tenant lean methodology
- Overall (STATE)
- 87 Strongly Landlord-Friendly
- State Texas
- 87 Strongly Landlord-Friendly · R+5
- County
- — inherits STATE
- City
- — inherits STATE
ZIP-level market 77351
- Home prices YoY
- -14.8%
- Active inventory
- 1186
- Price-to-rent
- 6.7×
Monthly cashflow live
- Estimated rent
- $1,374 medium interval (Pro) →
- Mortgage (P&I)
- −$577
- Tax from tax record
- −$257 /mo · $3,080/yr
- Insurance
- −$46
- Flood insurance flood zone
- −$66 /mo · $798/yr
- HOA
- −$6
- Vacancy / Maint / Mgmt
- −$288
- Net cashflow
- $133
Break-even live
UW: 25.0% down · 7.5% · 30yr · 1.5% tax · 5.0% vac · 8.0% maint · 8.0% mgmt
Financing live
Cash to close
- Down payment
- $27,500
- Closing costs
- $3,300
- Reserves months
- —
- Total cash needed
- —
Loan-product check · same deal, 3 products live
Conventional
25% down · 7.5% · 30yr
- Down + closing
- —
- Monthly P&I
- —
- Monthly cashflow
- —
- DSCR
- —
- Eligible?
- —
Personal DTI + credit; lowest rate.
DSCR
20% down · 8.5% · 30yr
- Down + closing
- —
- Monthly P&I
- —
- Monthly cashflow
- —
- DSCR
- —
- Eligible?
- —
No personal income docs; deal must DSCR.
Hard money
10% down · 12.0% · 12mo
- Down + closing
- —
- Monthly P&I
- —
- Monthly cashflow
- —
- DSCR
- —
- Eligible?
- —
Short-term bridge; refi at stabilization.
Rent comps 1 comps
| Address | Beds | Baths | Sqft | Rent | $/sqft | DOM | Units | Dist |
|---|---|---|---|---|---|---|---|---|
| 360 Terlingua Livingston, TX | 3.0 | 2.0 | 1680 | $1,575 | $0.94 | 24d | 1 | 1.12mi |
HOA detail
- Monthly dues
- $6 · $72/yr
Listing history 17 events
-
2026-06-18days on market $110,000 Active 36 DOM
-
2026-06-17days on market $110,000 Active 35 DOM
-
2026-06-16days on market $110,000 Active 34 DOM
-
2026-06-15days on market $110,000 Active 33 DOM
-
2026-06-13days on market $110,000 Active 31 DOM
-
2026-06-09days on market $110,000 Active 27 DOM
-
2026-06-08days on market $110,000 Active 26 DOM
-
2026-06-07days on market $110,000 Active 25 DOM
-
2026-06-04days on market $110,000 Active 22 DOM
-
2026-06-03days on market $110,000 Active 21 DOM
-
2026-06-02days on market $110,000 Active 20 DOM
-
2026-06-01days on market $110,000 Active 19 DOM
-
2026-05-31days on market $110,000 Active 18 DOM
-
2026-05-13$110,000 Active 554-char remark
-
2023-02-27soldstatus
-
2016-10-06soldstatus
-
2007-02-23soldstatus
ⓘ Source: listings_history table (triggers on properties + properties_extension) + one-shot
backfill from property_details.listing_events for pre-trigger history.
Tax reassessment forecast TX · Resets to sale price
- Current annual tax
- $3,080 · $257/mo
- Projected year-2 tax
- $3,080 · $257/mo
- Expected delta
- $0/yr ($0/mo · 0.0%)
ⓘ Screening estimate from a state-policy table — verify with the county assessor before closing.
Climate risk First Street
- Flood 8/10 Severe FEMA zone X (unshaded) · 99% chance over 30 yrs
- Wildfire 4/10 Moderate
- Heat 8/10 Severe 7 d/yr ≥112°F today · 24 d/yr by 30 yrs out
- Wind 8/10 Severe 98% chance of damaging wind over 30 yrs
- Air quality 1/10 Low 0 unhealthy d/yr today · 0 by 30 yrs out
Nearby sold comps map
Loading sold comps map…
Walkable amenities ~0.75 mi
Loading nearby amenities…
Taxation est. · year 1
- Rental income
- $16,485
- − Mortgage interest
- −$6,162
- − Property taxes
- −$3,080
- − Insurance
- −$1,348
- − Repairs & maintenance
- −$1,319
- − Management
- −$1,319
- − HOA
- −$72
- − Depreciation
- −$3,200
- Taxable loss
- −$13
- Est. tax savings @ 24.0%
- +$3
- After-tax cash flow
- $1,605/yr
For passive investors: Depreciation is non-cash, so a rental often shows a tax loss while cash-flowing — sheltering income. Rental losses are passive: they offset passive income freely, and up to $25,000/yr can offset ordinary (W-2) income if you actively participate and your MAGI is under $100k (phasing out to $0 by $150k); unused losses carry forward. On sale, claimed depreciation is recaptured at up to 25%, and gains may owe capital-gains tax (a 1031 exchange can defer both). Figures are a year-1 estimate at your 24.0% rate — not tax advice; consult a CPA.
Schools (NCES district)
- District
- Livingston ISD
- NCES district ID
- 4827780
- Math proficiency
- 38% ▼ -1.00%
- Reading proficiency
- 39% ▲ 3.00%
- Median HH income
- $39,531
- Composite
- 32.25/100
- National rank
- #5767
- State rank
- #459 of 826 in TX
Livability — West Livingston
- Score
- 50/100
- State rank
- #1501
- US rank
- #25668
Category grades
Schools grade is shown separately in the Schools card above.
Census & demographics
- Census place
- West Livingston, TX
- County
- Polk County · 37,143 people
- Metro
- nan
- Population (ZIP)
- 37,143
- Household income
- $66,834
- Rent vs Own
- Severe rent burden
- 608.0
Population outlook (Polk County) Hauer SSP2
- Today (2025)
- 51,049 people
- By 2030
- 53,243 · +4.3%
- By 2040
- 56,528 · +10.7%
- By 2050
- 59,243 · +16.1%
- By 2075
- 63,528 · +24.4%
- By 2100
- 60,376 · +18.3%
Race, ethnicity, and origin ACS 2023
- Neighborhood character
- Predominantly White (72%)
- Race & ethnicity
- White 72% Hispanic / Latino 14% Two or more races 9% Black 8% Native American 2%
- Hispanic origin (detail)
- Mexican 11%
- Common ancestry
- Lithuanian 2% Italian 2% Portuguese 2%
- Foreign-born
- 5% · Canada
- Languages at home
- 88% English-only · Spanish 10%
Political lean MEDSL · Polk
- 2024 margin
- Solid R (+58.9) · D 20.2% · R 79.1%
- 2008→2024 swing
- -21.7pp toward R · 2008: -37.2pp · 2024: -58.9pp
- All cycles
- 2024: R+58.9 2020: R+54.5 2016: R+56.5 2012: R+48.2 2008: R+37.2
Not yet ingested
- Civics
- —
Market trends
- HPI YoY
- ▼ -31.11%
- Current HPI
- 178.5316
- Rent YoY
- —
- Metro
- nan
- State GDP YoY
- ▲ 3.95%
- F500 in state
- 110
Industry mix (Fortune 500 HQ in TX)
| Industry | F500 HQs | Revenue |
|---|---|---|
| Energy | 16 | $1,198B |
|
||
| Technology | 5 | $198B |
|
||
| Engineering / Construction | 4 | $72B |
|
||
| Energy Services | 3 | $60B |
|
||
| Utilities | 3 | $41B |
|
||
| Healthcare | 2 | $330B |
|
||
Price history
4 events — show timeline
- 2026-05-13 Listed $110,000 HARMLS
- 2023-02-27 Sold (Public Records) — Public Records
- 2016-10-06 Sold (Public Records) — Public Records
- 2007-02-23 Sold (Public Records) — Public Records
Property tax history
+10.3%/yrLatest (2025): $3,080 · +7.3% YoY. Source: county tax records.
Cash-flow waterfall
monthlySold comps — $/sqft
last 12 mo · ≤1 miLoading sold comps…