11686 E State Road 450 · Shoals, IN
Flood risk 9/10 · Severe
- FEMA flood zone
- X (unshaded)
- Chance of flooding over 30 yrs
- 0.99%
- Est. flood insurance / yr
- $507 – $1,088
Fire risk 1/10 · Minimal
- Est. fire insurance / yr
- $717 – $1,331
Heat risk 4/10 · Minor
- Hot days now (above 104°F)
- 7 days/yr
- Hot days in 30 yrs
- 19 days/yr
Wind risk 2/10 · Minimal
- Chance of severe wind over 30 yrs
- 1.0%
Air-quality risk 2/10 · Minimal
- Unhealthy air days now
- 1 days/yr
- Unhealthy air days in 30 yrs
- 2 days/yr
Risk factors via First Street. Map © Google.
Why this score? — see what drove the D+ grade
The composite is a weighted blend of 9 inputs, each scored 0–100. Each bar is that input's sub-score; the figure is the points it added to the 100-point composite (weight × sub-score).
- Cash flow +14.5/30.0
- ARV discount +7.5/15.0
- Appreciation +7.1/10.0
- DSCR +4.4/10.0
- 1% rule +4.0/10.0
- Livability +3.1/5.0
- Rent growth +2.5/5.0
- Schools +2.5/10.0
- Condition / age +2.2/5.0
$89,900
🖨 Deal sheet (PDF) 📄 Offer letter ✓ Due diligence
Listing remarks MLS
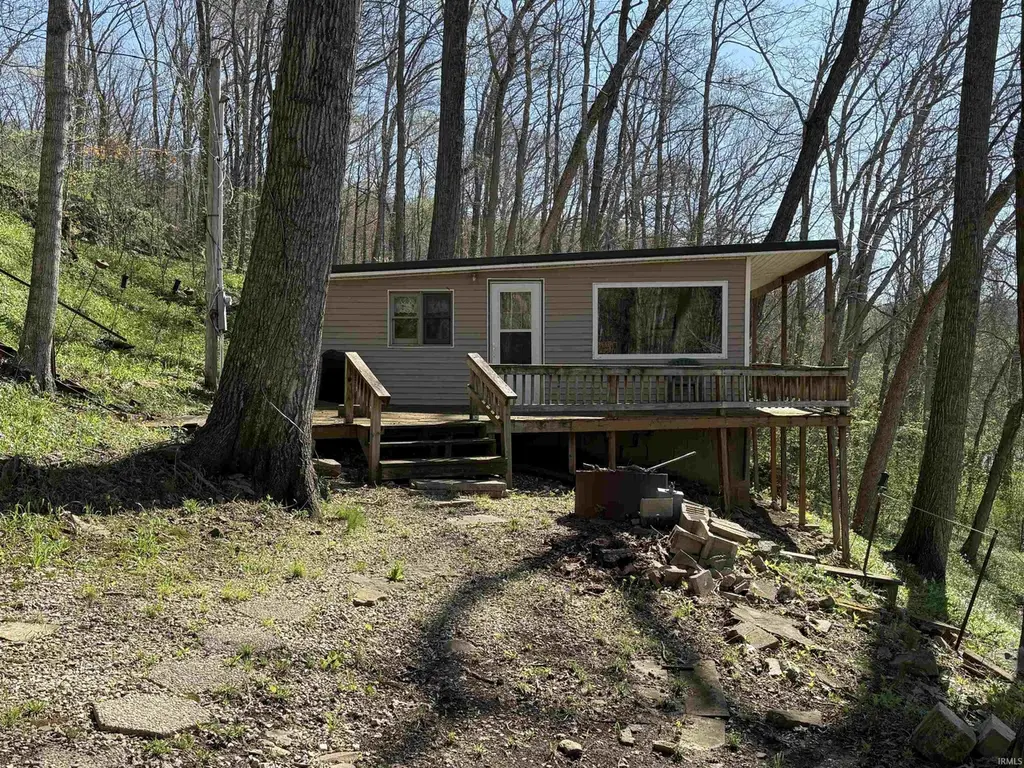
Escape to the White River with this cozy cabin located just 13 miles from Bedford. Featuring 1 bedroom, 1 bath, and an open concept living room and kitchen, this property is designed to maximize the views with large windows and a spacious deck overlooking the water and beautiful natural stone formations. Situated on a private road with shared ramp access, this is the perfect spot for relaxation, recreation, or investment potential!
Key facts
- Private road
- Views of water
- Spacious deck
Tags
Neighborhood map
What this means for you Summary
Snapshot
- This is a 1-bed/1.0-bath single-family listed at $90k. Condition is rated fair.
Deal economics
- At list price, monthly cash flow is $-46 ($-552/yr) — negative.
- To cash-flow at today's rent, offer at most $83k (7.4% below list).
- To meet the 1% rule (rent ≥ 1% of price), the offer needs to be $81k (9.6% below list).
- Recommended offer: $81k (9.6% below list) — sets the bar for 1% rule.
Location & tenants
- Location reads 62/100 on livability (#484 in IN) — a middle-class / working-renter tenant base. Strengths: cost of living A+, housing A+; Watch: crime C-, health & safety C-, amenities F.
- Shoals Community School Corporation (rural): math 24% / reading 34% proficiency, ranked #248 of 301 in IN (top 82%) — low school quality limits family demand, transient renter base, plan for 1-2y turnover.
- Zoned schools: Shoals Community Elementary School (math 32% / reading 32%, grade F, #652 of 994 statewide, top 68%, 314 students, 52% FRL); Shoals Middle School (math 17% / reading 32%, grade F, #251 of 330 statewide, top 77%, 163 students, 62% FRL); Shoals Community High School (math 15% / reading 54%, grade F, #269 of 369 statewide, top 73%, 192 students, 54% FRL).
- Market conditions: 19 active listings in the ZIP; 2 units permitted in Martin County in 2024 (0 in 5+ unit buildings).
Forward outlook
- In year one you build about $4k of equity ($622 loan paydown + $4k appreciation (4.2% local appreciation)).
- Martin County population projected at -22% by 2050 — secular population decline; favor cash flow + early exit over multi-decade hold.
- At projected returns (4.2% appreciation + 3.0% rent growth), your $25k cash investment doubles in ~6 years — after that, you're playing with house money.
- By year 8, paydown + projected appreciation supports a ~$33k cash-out refi (75% LTV) — recoverable capital for the next deal without selling this one.
Negotiation context
- It's been on market 75 days — a 6% lower offer ($85k) is reasonable based on typical stale-listing flexibility.
Risks & watch-outs
- Watch-outs: flood insurance adds $66/mo; built in 1955 — expect roof / HVAC / electrical / plumbing capex.
- Climate carrying-cost: severe flood risk — expect insurance premiums to compound above CPI over the hold.
Questions for the listing agent
- What do current leases actually rent for vs. the listed asking? Can we see a recent rent roll and the last 12 months of T-12 income?
- It's been on market 75 days. Have you received any prior offers? Is the seller open to a 10% concession, seller financing, or rate buy-down credit?
- Have any recent inspections been done? Can we get a copy of the seller's disclosures and any deferred-maintenance estimates?
- Built in 1955 — when were the roof, HVAC, electrical panel, plumbing, and water heater last replaced?
- What's the actual annual flood-insurance premium (NFIP or private), and is the property in a SFHA with mandatory coverage?
- Why hasn't it sold? Are there any deal-killer items the seller is aware of (foundation, flood, title, zoning, code violations)?
- Is there a deadline driving the sale (1031 exchange, divorce, estate, relocation)? That informs how much negotiation room exists.
- Schools are F-rated, which usually means shorter tenancies and higher turnover. Who's the typical renter profile here, and what's been the actual vacancy rate?
- The area grade is low — what's the realistic commute time and amenity access for the typical tenant pool here? Any planned neighborhood developments (good or bad) we should know about?
- What's the average days-on-market for RENTAL listings here right now (not sales)? A rising rental-DOM trend means longer vacancies and softer asking-rent achievability than the comps imply.
- What's the recent tenant-quality profile in this submarket — average credit score on applications, eviction rate, late-payment / NSF rate, and stable-employment percentage? A property-management company in the area should have these aggregated.
- How much new for-sale + rental construction is in the pipeline within 1–3 miles? Heavy new supply typically softens prices + rents 12–24 months out; constrained supply supports both.
Investment metrics
- 1% rule
- 0.90% ✗
- Cap rate
- 6.57%
- Cash-on-cash
- 0.98%
- DSCR
- 1.04
- GRM
- 9.2
CMA / ARV
No comps found within radius.
Projected returns pro-forma
4.24% appreciation · 3.0% rent growth · sell at horizon
- IRR
- 9.0%
- Equity multiple
- 1.56×
- Total profit
- $13,987
- Equity at exit
- $46,840
- IRR
- 11.0%
- Equity multiple
- 2.86×
- Total profit
- $46,924
- Equity at exit
- $77,632
Cash invested: $25,172 (down + closing). Projections, not guarantees.
Landlord ↔ Tenant lean methodology
- Overall (STATE)
- 90 Strongly Landlord-Friendly
- State Indiana
- 90 Strongly Landlord-Friendly · R+11
- County
- — inherits STATE
- City
- — inherits STATE
ZIP-level market 47581
- Home prices YoY
- 1.7%
- Active inventory
- 19
- Price-to-rent
- 9.2×
Monthly cashflow live
- Estimated rent
- $812 medium interval (Pro) →
- Mortgage (P&I)
- −$471
- Tax est. 1.5%
- −$112 /mo · $1,348/yr
- Insurance
- −$37
- Flood insurance flood zone
- −$66 /mo · $798/yr
- HOA
- −$0
- Vacancy / Maint / Mgmt
- −$171
- Net cashflow
- $-46
Break-even live
Sensitivity live
| Price | -10% $16 | -5% $-15 | +0% $-46 | +5% $-77 | +10% $-108 |
|---|---|---|---|---|---|
| Rent | -10% $-110 | -5% $-78 | +0% $-46 | +5% $-14 | +10% $18 |
| Rate | -1.0pp $-1 | -0.5pp $-23 | base $-46 | +0.5pp $-69 | +1.0pp $-93 |
UW: 25.0% down · 7.5% · 30yr · 1.5% tax · 5.0% vac · 8.0% maint · 8.0% mgmt
Financing live
Cash to close
- Down payment
- $22,475
- Closing costs
- $2,697
- Reserves months
- —
- Total cash needed
- —
Loan-product check · same deal, 3 products live
Conventional
25% down · 7.5% · 30yr
- Down + closing
- —
- Monthly P&I
- —
- Monthly cashflow
- —
- DSCR
- —
- Eligible?
- —
Personal DTI + credit; lowest rate.
DSCR
20% down · 8.5% · 30yr
- Down + closing
- —
- Monthly P&I
- —
- Monthly cashflow
- —
- DSCR
- —
- Eligible?
- —
No personal income docs; deal must DSCR.
Hard money
10% down · 12.0% · 12mo
- Down + closing
- —
- Monthly P&I
- —
- Monthly cashflow
- —
- DSCR
- —
- Eligible?
- —
Short-term bridge; refi at stabilization.
Listing history 19 events
-
2026-06-21days on market $89,900 Active 75 DOM
-
2026-06-21days on market $89,900 Active 74 DOM
-
2026-06-18days on market $89,900 Active 72 DOM
-
2026-06-17days on market $89,900 Active 71 DOM
-
2026-06-16days on market $89,900 Active 70 DOM
-
2026-06-15days on market $89,900 Active 69 DOM
-
2026-06-13days on market $89,900 Active 67 DOM
-
2026-06-12days on market $89,900 Active 66 DOM
-
2026-06-09days on market $89,900 Active 63 DOM
-
2026-06-08days on market $89,900 Active 62 DOM
-
2026-06-07days on market $89,900 Active 61 DOM
-
2026-06-07days on market $89,900 Active 60 DOM
-
2026-06-04days on market $89,900 Active 57 DOM
-
2026-06-02days on market $89,900 Active 56 DOM
-
2026-06-01days on market $89,900 Active 55 DOM
-
2026-05-31days on market $89,900 Active 54 DOM
-
2026-05-31days on market $89,900 Active 53 DOM
-
2026-04-28price $89,900 435-char remark
Show marketing remark (435 chars)
Escape to the White River with this cozy cabin located just 13 miles from Bedford. Featuring 1 bedroom, 1 bath, and an open concept living room and kitchen, this property is designed to maximize the views with large windows and a spacious deck overlooking the water and beautiful natural stone formations. Situated on a private road with shared ramp access, this is the perfect spot for relaxation, recreation, or investment potential!
-
2026-04-07$99,900 Active 435-char remark
Show marketing remark (435 chars)
Escape to the White River with this cozy cabin located just 13 miles from Bedford. Featuring 1 bedroom, 1 bath, and an open concept living room and kitchen, this property is designed to maximize the views with large windows and a spacious deck overlooking the water and beautiful natural stone formations. Situated on a private road with shared ramp access, this is the perfect spot for relaxation, recreation, or investment potential!
ⓘ Source: listings_history table (triggers on properties + properties_extension) + one-shot
backfill from property_details.listing_events for pre-trigger history.
Climate risk First Street
- Flood 9/10 Extreme FEMA zone X (unshaded) · 99% chance over 30 yrs
- Wildfire 1/10 Low
- Heat 4/10 Moderate 7 d/yr ≥104°F today · 19 d/yr by 30 yrs out
- Wind 2/10 Low 100% chance of damaging wind over 30 yrs
- Air quality 2/10 Low 1 unhealthy d/yr today · 2 by 30 yrs out
Nearby sold comps map
Loading sold comps map…
Walkable amenities ~0.75 mi
Loading nearby amenities…
Taxation est. · year 1
- Rental income
- $9,748
- − Mortgage interest
- −$5,036
- − Property taxes
- −$1,348
- − Insurance
- −$1,247
- − Repairs & maintenance
- −$780
- − Management
- −$780
- − Depreciation
- −$2,615
- Taxable loss
- −$2,058
- Est. tax savings @ 24.0%
- +$494
- After-tax cash flow
- $-58/yr
For passive investors: Depreciation is non-cash, so a rental often shows a tax loss while cash-flowing — sheltering income. Rental losses are passive: they offset passive income freely, and up to $25,000/yr can offset ordinary (W-2) income if you actively participate and your MAGI is under $100k (phasing out to $0 by $150k); unused losses carry forward. On sale, claimed depreciation is recaptured at up to 25%, and gains may owe capital-gains tax (a 1031 exchange can defer both). Figures are a year-1 estimate at your 24.0% rate — not tax advice; consult a CPA.
Condition & rehab AI · 13 photos
A cozy cabin with average condition, requiring minor repairs and maintenance to enhance its curb appeal and value.
Repairs flagged
- Minor Paint — Paint appears faded in some areas.
- Minor Siding — Siding appears weathered, but no major damage.
- Minor Landscaping — Basic landscaping with some overgrowth
Value-add opportunities
- Both Painting and staining — Enhances curb appeal and interior aesthetics.
- Both Landscaping — Improves curb appeal and enhances natural beauty.
- Rental HVAC maintenance — Ensures comfort and energy efficiency for tenants.
Renovation cost estimate screening
| Repair item | Severity | Est. cost |
|---|---|---|
| Paint · Paint appears faded in some areas. | Minor | $500–3,000 |
| Siding · Siding appears weathered, but no major damage. | Minor | $500–3,000 |
| Landscaping · Basic landscaping with some overgrowth | Minor | $500–3,000 |
| Total estimated repair cost · 3 items | $1,500–9,000 |
Value-add ROI direction
- Both Painting and staining — Enhances curb appeal and interior aesthetics. ↑
- Both Landscaping — Improves curb appeal and enhances natural beauty. ↑
- Rental HVAC maintenance — Ensures comfort and energy efficiency for tenants. ↑
ⓘ Cost ranges are severity-bucket heuristics (US national rule-of-thumb). Get contractor quotes + a written scope before underwriting a rehab budget.
Schools (NCES district)
- District
- Shoals Community School Corporation
- NCES district ID
- 1810170
- Math proficiency
- 24% ▼ -9.00%
- Reading proficiency
- 34% ▼ -3.00%
- Median HH income
- $43,155
- Composite
- 24.69/100
- National rank
- #7614
- State rank
- #248 of 301 in IN
Livability — Shoals
- Score
- 62/100
- State rank
- #484
- US rank
- #17159
Category grades
Schools grade is shown separately in the Schools card above.
Census & demographics
- Population (ZIP)
- 2,828
Population outlook (Martin County) Hauer SSP2
- Today (2025)
- 9,585 people
- By 2030
- 9,198 · -4.0%
- By 2040
- 8,365 · -12.7%
- By 2050
- 7,518 · -21.6%
- By 2075
- 5,674 · -40.8%
- By 2100
- 3,916 · -59.1%
Race, ethnicity, and origin ACS 2023
- Neighborhood character
- Predominantly White (95%)
- Race & ethnicity
- White 95% Two or more races 4%
- Common ancestry
- Slovak 4% Iranian 3% Italian 2%
- Foreign-born
- 0%
- Languages at home
- 99% English-only · Spanish 1%
Political lean MEDSL · Martin
- 2024 margin
- Solid R (+60.7) · D 18.7% · R 79.4% · Other 1.9%
- 2008→2024 swing
- -31.8pp toward R · 2008: -28.9pp · 2024: -60.7pp
- All cycles
- 2024: R+60.7 2020: R+58.7 2016: R+58.5 2012: R+40.3 2008: R+28.9
Not yet ingested
- Civics
- —
Market trends
- HPI YoY
- ▲ 4.24%
- Current HPI
- 252.4425
- Rent YoY
- —
- Metro
- —
- State GDP YoY
- ▲ 2.90%
- F500 in state
- 18
Industry mix (Fortune 500 HQ in IN)
| Industry | F500 HQs | Revenue |
|---|---|---|
| Industrial Machinery | 2 | $37B |
|
||
| Healthcare | 1 | $177B |
|
||
| Pharmaceuticals | 1 | $45B |
|
||
| Metals / Steel | 1 | $18B |
|
||
| Agriculture | 1 | $17B |
|
||
| Packaging | 1 | $12B |
|
||
Price history
-10.0% since first listed2 events — show timeline
- 2026-04-28 Price Changed $89,900 IRMLS
- 2026-04-07 Listed $99,900 IRMLS
Cash-flow waterfall
monthlySold comps — $/sqft
last 12 mo · ≤1 miLoading sold comps…