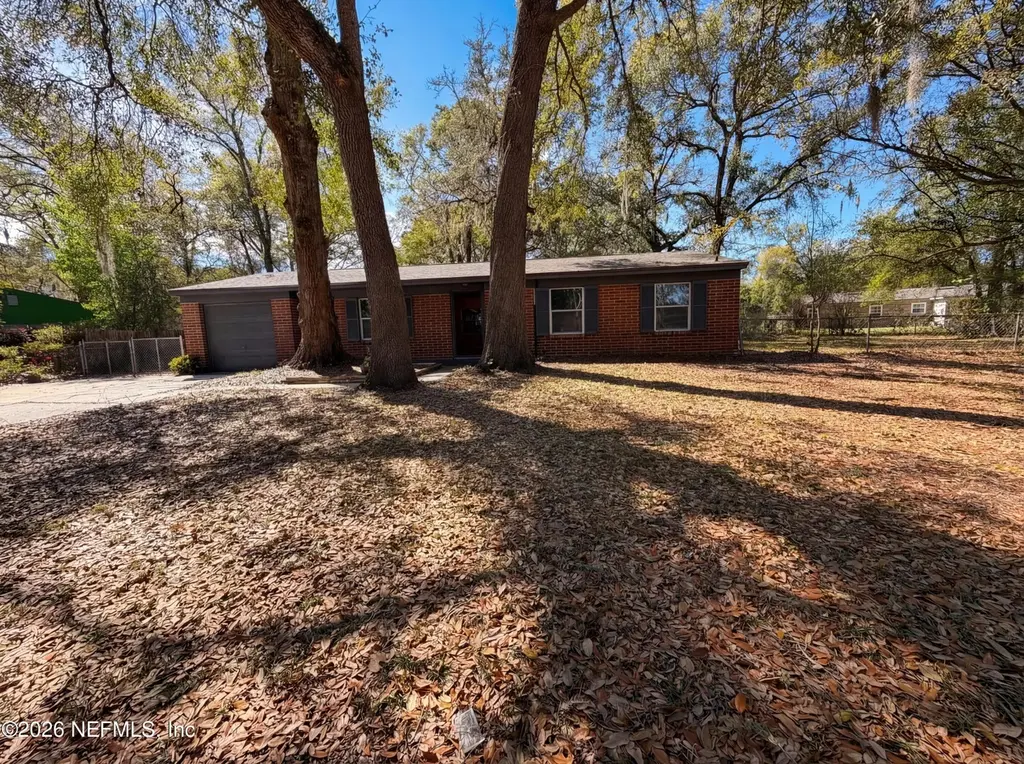
4240 Key Vega Ct · Jacksonville, FL
Flood risk 1/10 · Minimal
- FEMA flood zone
- X (unshaded)
- Chance of flooding over 30 yrs
- 0.0%
- Est. flood insurance / yr
- $507 – $1,088
Fire risk 5/10 · Moderate
- Est. fire insurance / yr
- $947 – $1,759
Heat risk 9/10 · Severe
- Hot days now (above 107°F)
- 7 days/yr
- Hot days in 30 yrs
- 20 days/yr
Wind risk 9/10 · Severe
- Chance of severe wind over 30 yrs
- 99.0%
Air-quality risk 4/10 · Minor
- Unhealthy air days now
- 6 days/yr
- Unhealthy air days in 30 yrs
- 6 days/yr
Risk factors via First Street. Map © Google.
Why this score? — see what drove the D+ grade
The composite is a weighted blend of 9 inputs, each scored 0–100. Each bar is that input's sub-score; the figure is the points it added to the 100-point composite (weight × sub-score).
- Cash flow +13.5/30.0
- ARV discount +12.9/15.0
- Livability +4.2/5.0
- DSCR +4.1/10.0
- 1% rule +3.9/10.0
- Schools +3.9/10.0
- Condition / age +2.5/5.0
- Rent growth +2.4/5.0
- Appreciation +0.0/10.0
$205,000
🖨 Deal sheet (PDF) 📄 Offer letter ✓ Due diligence
Listing remarks
Situated on a corner lot, 4240 Key Vega Ct features a covered patio and a fenced in backyard. The residence displays fresh interior paint and fresh exterior paint. Updates include new flooring throughout home and new appliances. These improvements provide a functional foundation for any resident. This home is a perfect blend of style and comfort. Don't miss out on this stunning property! Included 100-Day Home Warranty with buyer activation
Key facts
- Fenced in backyard
- New flooring
- Covered patio
Tags
Property features AI
Finance
- Financial info: Annual property tax noted (details available in listing)
- HOA & community: Not a senior community
Exterior
- Parking: Garage (1 car)
- Utilities: Public sewer; Electricity connected; Sewer connected; Water connected
- Home design: Single family residence; One story
- Exterior features: Shingle roof; Lot approximately 0.28 acres
Interior
- Kitchen: Appliances included (other)
- Bedrooms: 3 bedrooms
- Flooring: Carpet; Vinyl
- Bathrooms: 1 full bathroom; 1 half bathroom
- Heating & cooling: Central heating (electric); Central air conditioning
- Interior features: Other appliances (unspecified)
Neighborhood map
What this means for you Summary
Snapshot
- This is a 3-bed/1.0-bath single-family listed at $205k.
Deal economics
- At list price, monthly cash flow is $7 ($82/yr) — positive.
- The deal already cash-flows at list — no discount required.
- To meet the 1% rule (rent ≥ 1% of price), the offer needs to be $183k (10.9% below list).
- Recommended offer: $183k (10.9% below list) — sets the bar for 1% rule.
- Cap rate 6.3% vs local median 3.9% in Jacksonville — top-decile yield for the area; either an underpriced asset or a hidden risk that comps aren't pricing in. Stress-test before assuming the spread holds.
Location & tenants
- Location reads 83/100 on livability (#50 in FL, #911 nationally) — a professional / high-income tenant draw. Strengths: amenities A+, commute A+, housing A+.
- Duval (urban): math 46% / reading 45% proficiency, ranked #48 of 73 in FL (top 66%) — families likely to look elsewhere, expect single-tenant / working-renter base with shorter leases.
- Zoned schools: Garden City Elementary School (math 62% / reading 37%, grade D, #1,088 of 2,144 statewide, top 53%, 377 students, 68% FRL); Highlands Middle School (math 31% / reading 21%, grade F, #506 of 571 statewide, top 89%, 697 students, 73% FRL); Jean Ribault High School (math 22% / reading 25%, grade F, #533 of 667 statewide, top 80%, 1,385 students, 71% FRL) — zoned schools average 71% FRL vs 49% district-wide (21 pts higher); higher-poverty schools than district average — tighter screening recommended.
- Zoned-school proficiency averages 33% at this address vs 46% district-wide (-12 pts) — the specific schools serving this property underperform the Duval average; the district grade overstates school quality for this exact location.
- Market conditions: Rents soft (-0.4%/yr); 736 active listings in the ZIP; 8 comparable units currently listed for rent nearby; rentals at typical pace (median 22d on market — plan ~3-4 weeks tenant-placement turnaround); 6,503 units permitted in Duval County in 2024 (1,131 in 5+ unit buildings).
- This rent runs 31% of the median local income ($70k/yr) — at the standard rent-burdened threshold; future hikes will face affordability resistance.
Forward outlook
- Local home prices are declining (-3.0%/yr); year-one equity from $1k of loan paydown is wiped out by about $6k of value loss. Plan a longer hold.
- Duval County population projected at +19% by 2050 — long-run rental-demand tailwind backs the buy-and-hold thesis.
Negotiation context
- It's been on market 86 days — a 6% lower offer ($193k) is reasonable based on typical stale-listing flexibility.
- 2 sale attempts; this cycle's ask has dropped $17k (8%) from the opening price — seller is motivated, your offer sets the floor, not the list.
Risks & watch-outs
- Climate carrying-cost: severe wind risk, 99% chance of damaging wind over 30y; moderate wildfire risk; extreme-heat days projected 7→20/yr by 2055 (HVAC capex compounding) — expect insurance premiums to compound above CPI over the hold.
Questions for the listing agent
- It's been on market 86 days. Have you received any prior offers? Is the seller open to a 11% concession, seller financing, or rate buy-down credit?
- Why hasn't it sold? Are there any deal-killer items the seller is aware of (foundation, flood, title, zoning, code violations)?
- Is there a deadline driving the sale (1031 exchange, divorce, estate, relocation)? That informs how much negotiation room exists.
- Schools are B-rated — typically a magnet for longer-tenancy family renters. What's the average tenant stay here, and is there a school-zone premium baked into asking?
- The area grade is low — what's the realistic commute time and amenity access for the typical tenant pool here? Any planned neighborhood developments (good or bad) we should know about?
- What's the average days-on-market for RENTAL listings here right now (not sales)? A rising rental-DOM trend means longer vacancies and softer asking-rent achievability than the comps imply.
- What's the recent tenant-quality profile in this submarket — average credit score on applications, eviction rate, late-payment / NSF rate, and stable-employment percentage? A property-management company in the area should have these aggregated.
- How much new for-sale + rental construction is in the pipeline within 1–3 miles? Heavy new supply typically softens prices + rents 12–24 months out; constrained supply supports both.
Investment metrics
- 1% rule
- 0.89% ✗
- Cap rate
- 6.33%
- Cash-on-cash
- 0.14%
- DSCR
- 1.01
- GRM
- 9.4
CMA / ARV
- ARV (on-the-fly)
- $232,944
- Comps found
- 5
Show comp detail 5 sales within ~0.75 mi
| Address | Dist | Beds/Ba | Sqft | Sold | Price | $/sf | Match |
|---|---|---|---|---|---|---|---|
| 10924 Key Haven Blvd | 0.12mi | 3/2.0 | 1,054 (-4%) | 1mo | $145,000 | $138 | 82 |
| 4242 Key Vega Dr S | 0.08mi | 3/1.0 | 1,153 (+4%) | 16mo | $242,000 | $210 | 76 |
| 4248 Key Vega Ct | 0.02mi | 4/2.0 (+1) | 1,184 (+7%) | 11mo | $250,000 | $211 | 69 |
| 10955 Key Vega Dr | 0.08mi | 3/2.0 | 1,040 (-6%) | 20mo | $239,000 | $230 | 66 |
| 10959 Naples Ct N | 0.10mi | 3/2.0 | 1,160 (+5%) | 20mo | $282,000 | $243 | 66 |
Match score weights: distance 35% · size 25% · config 20% · recency 20%. Top-matched comps best support the ARV.
Projected returns pro-forma
-3.0% appreciation · 0.0% rent growth · sell at horizon
- IRR
- -19.5%
- Equity multiple
- 0.34×
- Total profit
- $-38,097
- Equity at exit
- $30,566
- IRR
- -20.5%
- Equity multiple
- 0.07×
- Total profit
- $-53,139
- Equity at exit
- $17,725
Cash invested: $57,400 (down + closing). Projections, not guarantees.
Landlord ↔ Tenant lean methodology
- Overall (STATE)
- 87 Strongly Landlord-Friendly
- State Florida
- 87 Strongly Landlord-Friendly · R+3
- County
- — inherits STATE
- City
- — inherits STATE
ZIP-level market 32218
- Home prices YoY
- -25.7%
- Rents YoY
- -0.4%
- Active inventory
- 736
- Price-to-rent
- 9.4×
Monthly cashflow live
- Estimated rent
- $1,826 high interval (Pro) →
- Mortgage (P&I)
- −$1,075
- Tax from tax record
- −$275 /mo · $3,306/yr
- Insurance
- −$85
- HOA
- −$0
- Lot rent
- −$0
- Vacancy / Maint / Mgmt
- −$384
- Net cashflow
- $7
Break-even live
Sensitivity live
| Price | -10% $123 | -5% $65 | +0% $7 | +5% $-51 | +10% $-109 |
|---|---|---|---|---|---|
| Rent | -10% $-137 | -5% $-65 | +0% $7 | +5% $79 | +10% $151 |
| Rate | -1.0pp $110 | -0.5pp $59 | base $7 | +0.5pp $-46 | +1.0pp $-100 |
UW: 25.0% down · 7.5% · 30yr · 1.5% tax · 5.0% vac · 8.0% maint · 8.0% mgmt
Financing live
Cash to close
- Down payment
- $51,250
- Closing costs
- $6,150
- Reserves months
- —
- Total cash needed
- —
Loan-product check · same deal, 3 products live
Conventional
25% down · 7.5% · 30yr
- Down + closing
- —
- Monthly P&I
- —
- Monthly cashflow
- —
- DSCR
- —
- Eligible?
- —
Personal DTI + credit; lowest rate.
DSCR
20% down · 8.5% · 30yr
- Down + closing
- —
- Monthly P&I
- —
- Monthly cashflow
- —
- DSCR
- —
- Eligible?
- —
No personal income docs; deal must DSCR.
Hard money
10% down · 12.0% · 12mo
- Down + closing
- —
- Monthly P&I
- —
- Monthly cashflow
- —
- DSCR
- —
- Eligible?
- —
Short-term bridge; refi at stabilization.
Rent comps 8 comps
| Address | Beds | Baths | Sqft | Rent | $/sqft | DOM | Units | Dist |
|---|---|---|---|---|---|---|---|---|
| 4212 Pointe Haven Dr N Jacksonville, FL | 3.0 | 1.5 | 1054 | $1,800 | $1.71 | 26d | 1 | 0.13mi |
| 10881 Key Coral Dr Jacksonville, FL | 4.0 | 2.0 | 1304 | $1,695 | $1.30 | 26d | 1 | 0.16mi |
| 11075 Key Coral Dr Jacksonville, FL | 4.0 | 2.0 | 1470 | $1,423 | $0.97 | 5d | 1 | 0.16mi |
| 10838 Naples Ct S Jacksonville, FL | 3.0 | 2.0 | 1285 | $1,755 | $1.37 | 26d | 1 | 0.21mi |
| 3216 Duane Ave Jacksonville, FL | 2.0 | 1.0 | 748 | $1,098 | $1.47 | 10d | 1 | 1.13mi |
| 4819 Arrowsmith Rd Unit 1 Jacksonville, FL | 3.0 | 2.0 | 1285 | $1,500 | $1.17 | 17d | 1 | 1.36mi |
| 10871 Copper Creek Ct Jacksonville, FL | 3.0 | 2.0 | 1457 | $2,145 | $1.47 | 17d | 1 | 1.38mi |
| 3025 Armstrong St Jacksonville, FL | 3.0 | 2.0 | 1120 | $1,461 | $1.30 | 22d | 1 | 1.38mi |
Listing history 21 events
-
2026-06-22days on market $205,000 Active 86 DOM
-
2026-06-21days on market $205,000 Active 85 DOM
-
2026-06-18days on market $205,000 Active 82 DOM
-
2026-06-17days on market $205,000 Active 81 DOM
-
2026-06-16days on market $205,000 Active 80 DOM
-
2026-06-15days on market $205,000 Active 79 DOM
-
2026-06-13pricedays on market $205,000 Active 76 DOM
-
2026-06-10days on market $210,000 Active 73 DOM
-
2026-06-08days on market $210,000 Active 72 DOM
-
2026-06-07days on market $210,000 Active 71 DOM
-
2026-06-03days on market $210,000 Active 67 DOM
-
2026-06-02days on market $210,000 Active 66 DOM
-
2026-06-01days on market $210,000 Active 65 DOM
-
2026-05-31days on market $210,000 Active 64 DOM
-
2026-05-18status Active
-
2026-05-12status Pending
-
2026-04-30price $210,000
-
2026-04-16price $215,000
-
2026-03-22$222,000 Active
-
2026-03-06soldstatus $190,600
-
1988-11-01soldstatus $54,800
ⓘ Source: listings_history table (triggers on properties + properties_extension) + one-shot
backfill from property_details.listing_events for pre-trigger history.
Tax reassessment forecast FL · Resets to sale price
- Current annual tax
- $3,306 · $275/mo
- Projected year-2 tax
- $3,306 · $275/mo
- Expected delta
- $0/yr ($0/mo · 0.0%)
ⓘ Screening estimate from a state-policy table — verify with the county assessor before closing.
Climate risk First Street
- Flood 1/10 Low FEMA zone X (unshaded) · 0% chance over 30 yrs
- Wildfire 5/10 Major
- Heat 9/10 Extreme 7 d/yr ≥107°F today · 20 d/yr by 30 yrs out
- Wind 9/10 Extreme 99% chance of damaging wind over 30 yrs
- Air quality 4/10 Moderate 6 unhealthy d/yr today · 6 by 30 yrs out
Nearby sold comps map
Loading sold comps map…
Walkable amenities ~0.75 mi
Loading nearby amenities…
Taxation est. · year 1
- Rental income
- $21,915
- − Mortgage interest
- −$11,483
- − Property taxes
- −$3,306
- − Insurance
- −$1,025
- − Repairs & maintenance
- −$1,753
- − Management
- −$1,753
- − Depreciation
- −$5,964
- Taxable loss
- −$3,369
- Est. tax savings @ 24.0%
- +$808
- After-tax cash flow
- $890/yr
For passive investors: Depreciation is non-cash, so a rental often shows a tax loss while cash-flowing — sheltering income. Rental losses are passive: they offset passive income freely, and up to $25,000/yr can offset ordinary (W-2) income if you actively participate and your MAGI is under $100k (phasing out to $0 by $150k); unused losses carry forward. On sale, claimed depreciation is recaptured at up to 25%, and gains may owe capital-gains tax (a 1031 exchange can defer both). Figures are a year-1 estimate at your 24.0% rate — not tax advice; consult a CPA.
Schools (NCES district)
- District
- Duval
- NCES district ID
- 1200480
- Math proficiency
- 46% ▼ -11.00%
- Reading proficiency
- 45% ▼ -4.00%
- Median HH income
- $48,987
- Composite
- 38.97/100
- National rank
- #4076
- State rank
- #48 of 73 in FL
Livability — Jacksonville
- Score
- 83/100
- State rank
- #50
- US rank
- #911
Category grades
Schools grade is shown separately in the Schools card above.
Census & demographics
- Census place
- Jacksonville, FL
- County
- Duval County · 1,015,274 people
- City population
- 979,034
- Metro
- Jacksonville, FL
- Population (ZIP)
- 72,905
- Household income
- $69,638
- Rent vs Own
- Severe rent burden
- 2289.0
Population outlook (Duval County) Hauer SSP2
- Today (2025)
- 1,013,010 people
- By 2030
- 1,059,228 · +4.6%
- By 2040
- 1,141,439 · +12.7%
- By 2050
- 1,205,258 · +19.0%
- By 2075
- 1,324,282 · +30.7%
- By 2100
- 1,319,620 · +30.3%
Race, ethnicity, and origin ACS 2023
- Neighborhood character
- Diverse neighborhood (Simpson 0.64)
- Race & ethnicity
- Black 48% White 35% Hispanic / Latino 9% Two or more races 8% Asian 2%
- Hispanic origin (detail)
- Mexican 2% Puerto Rican 4%
- Common ancestry
- Slovak 1% Lithuanian 1% Italian 1%
- Foreign-born
- 6% · Canada, Jamaica, Vietnam
- Languages at home
- 89% English-only · Spanish 6% French/Haitian/Cajun 1% Tagalog/Filipino 1%
Political lean MEDSL · Duval
- 2024 margin
- Toss-up / Even · D 48.7% · R 50.1% · Other 1.2%
- 2008→2024 swing
- +0.4pp no change · 2008: -1.9pp · 2024: -1.5pp
- All cycles
- 2024: R+1.5 2020: D+3.8 2016: R+1.5 2012: R+3.6 2008: R+1.9
Not yet ingested
- Civics
- —
Market trends
- HPI YoY
- ▼ -90.73%
- Current HPI
- 262.2329
- Rent YoY
- ▼ -0.40%
- Metro
- Jacksonville, FL
- State GDP YoY
- ▲ 3.28%
- F500 in state
- 36
Industry mix (Fortune 500 HQ in FL)
| Industry | F500 HQs | Revenue |
|---|---|---|
| Industrial Technology | 2 | $29B |
|
||
| Insurance | 2 | $17B |
|
||
| Retail | 1 | $60B |
|
||
| Technology Distribution | 1 | $58B |
|
||
| Homebuilding | 1 | $35B |
|
||
| Technology Manufacturing | 1 | $35B |
|
||
Price history
+283.2% since first listed7 events — show timeline
- 2026-05-18 Relisted — realMLS
- 2026-05-12 Pending — realMLS
- 2026-04-30 Price Changed $210,000 realMLS
- 2026-04-16 Price Changed $215,000 realMLS
- 2026-03-22 Listed $222,000 realMLS
- 2026-03-06 Sold (Public Records) $190,600 Public Records
- 1988-11-01 Sold (Public Records) $54,800 Public Records
Property tax history
+8.7%/yrLatest (2025): $3,306 · +14.1% YoY. Source: county tax records.
Cash-flow waterfall
monthlySold comps — $/sqft
last 12 mo · ≤1 miLoading sold comps…