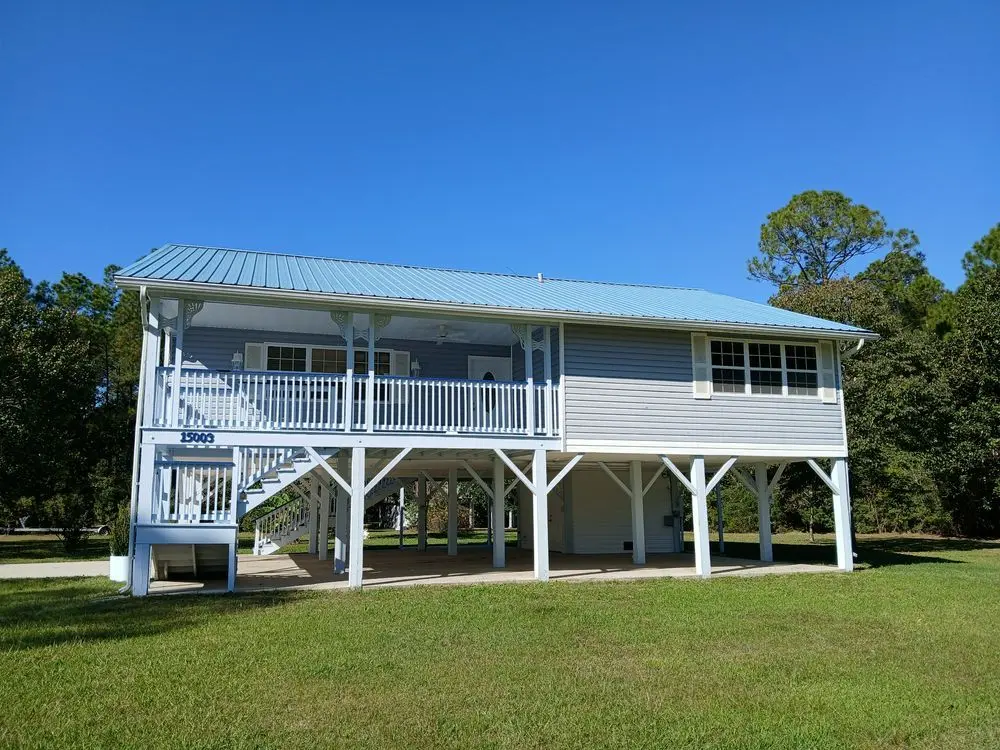
15003 Ponotoc Dr · Kiln, MS
Flood risk 9/10 · Severe
- FEMA flood zone
- AE
- Chance of flooding over 30 yrs
- 0.99%
- Est. flood insurance / yr
- $1,737 – $8,500
Fire risk 5/10 · Moderate
- Est. fire insurance / yr
- $1,241 – $2,305
Heat risk 10/10 · Severe
- Hot days now (above 107°F)
- 7 days/yr
- Hot days in 30 yrs
- 21 days/yr
Wind risk 9/10 · Severe
- Chance of severe wind over 30 yrs
- 99.0%
Air-quality risk 1/10 · Minimal
- Unhealthy air days now
- 0 days/yr
- Unhealthy air days in 30 yrs
- 0 days/yr
Risk factors via First Street. Map © Google.
Why this score? — see what drove the C- grade
The composite is a weighted blend of 9 inputs, each scored 0–100. Each bar is that input's sub-score; the figure is the points it added to the 100-point composite (weight × sub-score).
- Cash flow +17.8/30.0
- ARV discount +15.0/15.0
- DSCR +5.6/10.0
- 1% rule +4.2/10.0
- Schools +3.9/10.0
- Livability +3.4/5.0
- Rent growth +2.5/5.0
- Condition / age +2.5/5.0
- Appreciation +0.0/10.0
$244,000
🖨 Deal sheet (PDF) 📄 Offer letter ✓ Due diligence
Listing remarks MLS
This move-in-ready country home is situated on the corner of three consolidated lots in the Jourdan River Shores subdivision. Its open floor plan has abundant natural lighting, and the living room features a textured, decorative accent wall. New hot water heater and outdoor A/C unit (2024) and new vinyl flooring throughout (2025). Assumable flood insurance policy. Half-bath in downstairs storage shed/workshop. Boat launch is just down the street! Elevator is great for transporting groceries upstairs. Spacious front and back porches for sitting out in the evening. Minutes away from the beaches of Bay St. Louis!
Key facts
- Natural lighting
- Open floor plan
- New hot water heater
Tags
Neighborhood map
What this means for you Summary
Snapshot
- This is a 2-bed/2.5-bath single-family listed at $244k.
Deal economics
- At list price, monthly cash flow is $-225 ($-3k/yr) — negative.
- To cash-flow at today's rent, offer at most $204k (16.3% below list).
- To meet the 1% rule (rent ≥ 1% of price), the offer needs to be $223k (8.4% below list).
- Recommended offer: $204k (16.3% below list) — sets the bar for cash-flow.
- Cap rate 7.3% vs local median 3.4% in Kiln — top-decile yield for the area; either an underpriced asset or a hidden risk that comps aren't pricing in. Stress-test before assuming the spread holds.
Location & tenants
- Location reads 68/100 on livability (#69 in MS) — a middle-class / working-renter tenant base. Strengths: crime A+, cost of living A+, housing A; Watch: amenities F, commute F, health & safety F.
- Hancock County School District (rural): math 47% / reading 44% proficiency, ranked #23 of 130 in MS (top 18%) — families likely to look elsewhere, expect single-tenant / working-renter base with shorter leases.
- Zoned schools: East Hancock Elementary School (math 64% / reading 59%, grade B, #22 of 375 statewide, top 6%, 639 students, 100% FRL); Hancock Middle School (math 48% / reading 44%, grade D+, #39 of 179 statewide, top 22%, 958 students, 100% FRL); Hancock High School (math 42% / reading 43%, grade F, #42 of 197 statewide, top 21%, 1,187 students, 100% FRL) — zoned schools average 100% FRL vs 58% district-wide (41 pts higher); higher-poverty schools than district average — tighter screening recommended.
- Market conditions: 141 active listings in the ZIP; 2 comparable units currently listed for rent nearby; 248 units permitted in Hancock County in 2024 (0 in 5+ unit buildings).
Forward outlook
- Local home prices are declining (-3.0%/yr); year-one equity from $2k of loan paydown is wiped out by about $7k of value loss. Plan a longer hold.
- Hancock County population projected at +20% by 2050 — long-run rental-demand tailwind backs the buy-and-hold thesis.
Negotiation context
- It's been on market 227 days — a 12% lower offer ($215k) is reasonable based on typical stale-listing flexibility.
- 5 sale attempts since 14y ago; this cycle's ask has dropped $16k (6%) from the opening price — seller is motivated, your offer sets the floor, not the list.
Risks & watch-outs
- Watch-outs: flood insurance adds $427/mo.
- Climate carrying-cost: in FEMA flood zone AE (mandatory federal flood insurance); severe wind risk, 99% chance of damaging wind over 30y; moderate wildfire risk; extreme-heat days projected 7→21/yr by 2055 (HVAC capex compounding) — expect insurance premiums to compound above CPI over the hold.
Questions for the listing agent
- What do current leases actually rent for vs. the listed asking? Can we see a recent rent roll and the last 12 months of T-12 income?
- It's been on market 227 days. Have you received any prior offers? Is the seller open to a 16% concession, seller financing, or rate buy-down credit?
- What's the actual annual flood-insurance premium (NFIP or private), and is the property in a SFHA with mandatory coverage?
- Why hasn't it sold? Are there any deal-killer items the seller is aware of (foundation, flood, title, zoning, code violations)?
- Is there a deadline driving the sale (1031 exchange, divorce, estate, relocation)? That informs how much negotiation room exists.
- What's the average days-on-market for RENTAL listings here right now (not sales)? A rising rental-DOM trend means longer vacancies and softer asking-rent achievability than the comps imply.
- What's the recent tenant-quality profile in this submarket — average credit score on applications, eviction rate, late-payment / NSF rate, and stable-employment percentage? A property-management company in the area should have these aggregated.
- How much new for-sale + rental construction is in the pipeline within 1–3 miles? Heavy new supply typically softens prices + rents 12–24 months out; constrained supply supports both.
Investment metrics
- 1% rule
- 0.92% ✗
- Cap rate
- 7.29%
- Cash-on-cash
- 3.55%
- DSCR
- 1.16
- GRM
- 9.1
CMA / ARV
- ARV (median comp)
- $357,954
- List price
- $244,000
- Delta
- -31.83%
- Verdict
- UNDERPRICED
- Comps
- 20 within 1.0 mi
Show comp detail 5 sales within ~0.75 mi
| Address | Dist | Beds/Ba | Sqft | Sold | Price | $/sf | Match |
|---|---|---|---|---|---|---|---|
| 6110 Kiowa St | 0.17mi | 3/2.5 (+1) | 1,500 (-2%) | 1mo | $359,000 | $239 | 83 |
| 6371 Shawnee St | 0.13mi | 3/2.0 (+1) | 1,680 (+10%) | 0mo | $326,900 | $195 | 70 |
| 6079 Kiowa St | 0.14mi | 3/2.0 (+1) | 1,750 (+14%) | 1mo | $465,000 | $266 | 62 |
| 6036 Pontiac Dr | 0.29mi | 3/3.0 (+1) | 1,586 (+4%) | 21mo | $400,000 | $252 | 56 |
| 6093 Apache Dr | 0.34mi | 3/2.0 (+1) | 1,652 (+8%) | 22mo | $339,000 | $205 | 46 |
Match score weights: distance 35% · size 25% · config 20% · recency 20%. Top-matched comps best support the ARV.
Projected returns pro-forma
-3.0% appreciation · 3.0% rent growth · sell at horizon
- IRR
- -22.8%
- Equity multiple
- 0.22×
- Total profit
- $-53,622
- Equity at exit
- $36,381
- IRR
- -16.9%
- Equity multiple
- 0.06×
- Total profit
- $-64,217
- Equity at exit
- $21,097
Cash invested: $68,320 (down + closing). Projections, not guarantees.
Landlord ↔ Tenant lean methodology
- Overall (STATE)
- 90 Strongly Landlord-Friendly
- State Mississippi
- 90 Strongly Landlord-Friendly · R+11
- County
- — inherits STATE
- City
- — inherits STATE
ZIP-level market 39556
- Home prices YoY
- -19.4%
- Active inventory
- 141
- Price-to-rent
- 9.1×
Monthly cashflow live
- Estimated rent
- $2,234 medium interval (Pro) →
- Mortgage (P&I)
- −$1,280
- Tax from tax record
- −$182 /mo · $2,180/yr
- Insurance
- −$102
- Flood insurance flood zone
- −$427 /mo · $5,118/yr
- HOA
- −$0
- Vacancy / Maint / Mgmt
- −$469
- Net cashflow
- $-225
Break-even live
Sensitivity live
| Price | -10% $-86 | -5% $-156 | +0% $-225 | +5% $-294 | +10% $-363 |
|---|---|---|---|---|---|
| Rent | -10% $-401 | -5% $-313 | +0% $-225 | +5% $-136 | +10% $-48 |
| Rate | -1.0pp $-102 | -0.5pp $-163 | base $-225 | +0.5pp $-288 | +1.0pp $-352 |
UW: 25.0% down · 7.5% · 30yr · 1.5% tax · 5.0% vac · 8.0% maint · 8.0% mgmt
Financing live
Cash to close
- Down payment
- $61,000
- Closing costs
- $7,320
- Reserves months
- —
- Total cash needed
- —
Loan-product check · same deal, 3 products live
Conventional
25% down · 7.5% · 30yr
- Down + closing
- —
- Monthly P&I
- —
- Monthly cashflow
- —
- DSCR
- —
- Eligible?
- —
Personal DTI + credit; lowest rate.
DSCR
20% down · 8.5% · 30yr
- Down + closing
- —
- Monthly P&I
- —
- Monthly cashflow
- —
- DSCR
- —
- Eligible?
- —
No personal income docs; deal must DSCR.
Hard money
10% down · 12.0% · 12mo
- Down + closing
- —
- Monthly P&I
- —
- Monthly cashflow
- —
- DSCR
- —
- Eligible?
- —
Short-term bridge; refi at stabilization.
Rent comps 2 comps
| Address | Beds | Baths | Sqft | Rent | $/sqft | DOM | Units | Dist |
|---|---|---|---|---|---|---|---|---|
| 6293 Pontiac Dr Kiln, MS | 3.0 | 2.0 | 1640 | $2,670 | $1.63 | 15d | 1 | 0.29mi |
| 16016 Highway 603 Kiln, MS | 3.0 | 2.0 | 1216 | $1,200 | $0.99 | 45d | 1 | 0.58mi |
Listing history 29 events
-
2026-06-21days on market $244,000 Active 227 DOM
-
2026-06-18days on market $244,000 Active 224 DOM
-
2026-06-17days on market $244,000 Active 223 DOM
-
2026-06-16days on market $244,000 Active 222 DOM
-
2026-06-15days on market $244,000 Active 221 DOM
-
2026-06-14days on market $244,000 Active 219 DOM
-
2026-06-13days on market $244,000 Active 218 DOM
-
2026-06-10days on market $244,000 Active 216 DOM
-
2026-06-09days on market $244,000 Active 215 DOM
-
2026-06-08days on market $244,000 Active 214 DOM
-
2026-06-07days on market $244,000 Active 213 DOM
-
2026-06-05pricedays on market $244,000 Active 210 DOM
-
2026-06-03days on market $252,200 Active 209 DOM
-
2026-06-02days on market $252,200 Active 208 DOM
-
2026-06-01days on market $252,200 Active 207 DOM
-
2026-05-31days on market $252,200 Active 206 DOM
-
2026-05-30days on market $252,200 Active 205 DOM
-
2026-01-07price $252,200 618-char remark
Show marketing remark (618 chars)
This move-in-ready country home is situated on the corner of three consolidated lots in the Jourdan River Shores subdivision. Its open floor plan has abundant natural lighting, and the living room features a textured, decorative accent wall. New hot water heater and outdoor A/C unit (2024) and new vinyl flooring throughout (2025). Assumable flood insurance policy. Half-bath in downstairs storage shed/workshop. Boat launch is just down the street! Elevator is great for transporting groceries upstairs. Spacious front and back porches for sitting out in the evening. Minutes away from the beaches of Bay St. Louis!
-
2025-11-06$260,000 Active 618-char remark
Show marketing remark (618 chars)
This move-in-ready country home is situated on the corner of three consolidated lots in the Jourdan River Shores subdivision. Its open floor plan has abundant natural lighting, and the living room features a textured, decorative accent wall. New hot water heater and outdoor A/C unit (2024) and new vinyl flooring throughout (2025). Assumable flood insurance policy. Half-bath in downstairs storage shed/workshop. Boat launch is just down the street! Elevator is great for transporting groceries upstairs. Spacious front and back porches for sitting out in the evening. Minutes away from the beaches of Bay St. Louis!
-
2024-01-08soldstatus
-
2021-10-02historical
-
2021-10-01historical
-
2021-09-15historical
-
2021-09-15historical
-
2015-07-20$180,000
-
2015-07-18$150,000
-
2014-07-17$148,000
-
2012-12-01$164,500
-
1998-09-24soldstatus
ⓘ Source: listings_history table (triggers on properties + properties_extension) + one-shot
backfill from property_details.listing_events for pre-trigger history.
Tax reassessment forecast MS · Resets to sale price
- Current annual tax
- $2,180 · $182/mo
- Projected year-2 tax
- $2,180 · $182/mo
- Expected delta
- $0/yr ($0/mo · 0.0%)
ⓘ Screening estimate from a state-policy table — verify with the county assessor before closing.
Climate risk First Street
- Flood 9/10 Extreme FEMA zone AE · 99% chance over 30 yrs
- Wildfire 5/10 Major
- Heat 10/10 Extreme 7 d/yr ≥107°F today · 21 d/yr by 30 yrs out
- Wind 9/10 Extreme 99% chance of damaging wind over 30 yrs
- Air quality 1/10 Low 0 unhealthy d/yr today · 0 by 30 yrs out
Nearby sold comps map
Loading sold comps map…
Walkable amenities ~0.75 mi
Loading nearby amenities…
Taxation est. · year 1
- Rental income
- $26,808
- − Mortgage interest
- −$13,668
- − Property taxes
- −$2,180
- − Insurance
- −$6,338
- − Repairs & maintenance
- −$2,145
- − Management
- −$2,145
- − Depreciation
- −$7,098
- Taxable loss
- −$6,766
- Est. tax savings @ 24.0%
- +$1,624
- After-tax cash flow
- $-1,071/yr
For passive investors: Depreciation is non-cash, so a rental often shows a tax loss while cash-flowing — sheltering income. Rental losses are passive: they offset passive income freely, and up to $25,000/yr can offset ordinary (W-2) income if you actively participate and your MAGI is under $100k (phasing out to $0 by $150k); unused losses carry forward. On sale, claimed depreciation is recaptured at up to 25%, and gains may owe capital-gains tax (a 1031 exchange can defer both). Figures are a year-1 estimate at your 24.0% rate — not tax advice; consult a CPA.
Schools (NCES district)
- District
- Hancock County School District
- NCES district ID
- 2801740
- Math proficiency
- 47% ▼ -11.00%
- Reading proficiency
- 44% ▼ -9.00%
- Median HH income
- $47,971
- Composite
- 38.88/100
- National rank
- #4099
- State rank
- #23 of 130 in MS
Livability — Kiln
- Score
- 68/100
- State rank
- #69
- US rank
- #9853
Category grades
Schools grade is shown separately in the Schools card above.
Census & demographics
- Census place
- Kiln, MS
- City population
- 7,583
- Population (ZIP)
- 7,583
Population outlook (Hancock County) Hauer SSP2
- Today (2025)
- 52,161 people
- By 2030
- 54,753 · +5.0%
- By 2040
- 59,242 · +13.6%
- By 2050
- 62,417 · +19.7%
- By 2075
- 68,168 · +30.7%
- By 2100
- 69,212 · +32.7%
Race, ethnicity, and origin ACS 2023
- Neighborhood character
- Predominantly White (92%)
- Race & ethnicity
- White 92% Two or more races 7% Hispanic / Latino 4%
- Common ancestry
- Lithuanian 16% Hungarian 1% Slovak 1%
- Foreign-born
- 0%
- Languages at home
- 98% English-only · French/Haitian/Cajun 1% Spanish 1%
Political lean MEDSL · Hancock
- 2024 margin
- Solid R (+58.7) · D 20.1% · R 78.8% · Other 1.1%
- 2008→2024 swing
- -4.4pp toward R · 2008: -54.2pp · 2024: -58.7pp
- All cycles
- 2024: R+58.7 2020: R+55.5 2016: R+59.4 2012: R+52.8 2008: R+54.2
Not yet ingested
- Civics
- —
Market trends
- HPI YoY
- ▼ -45.52%
- Current HPI
- 188.5373
- Rent YoY
- —
- Metro
- —
- State GDP YoY
- —
- F500 in state
- 0
Price history
+53.3% since first listed12 events — show timeline
- 2026-01-07 Price Changed $252,200 ForSaleByOwner.com
- 2025-11-06 Listed $260,000 ForSaleByOwner.com
- 2024-01-08 Sold (Public Records) — Public Records
- 2021-10-02 Listing Removed — MLSU
- 2021-10-01 Listing Removed — MLSU
- 2021-09-15 Listing Removed — MLSU
- 2021-09-15 Listing Removed — MLSU
- 2015-07-20 Listed $180,000 MLSU
- 2015-07-18 Listed $150,000 MLSU
- 2014-07-17 Listed $148,000 MLSU
- 2012-12-01 Listed $164,500 MLSU
- 1998-09-24 Sold (Public Records) — Public Records
Property tax history
+16.9%/yrLatest (2025): $2,180 · +197.3% YoY. Source: county tax records.
Cash-flow waterfall
monthlySold comps — $/sqft
last 12 mo · ≤1 miLoading sold comps…