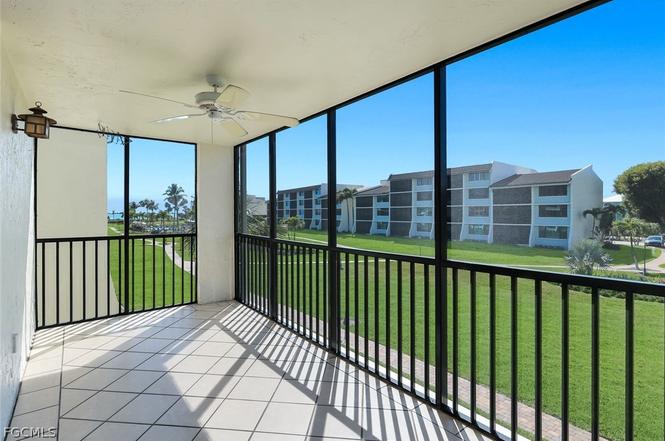
979 E Gulf Dr Unit D452 · Sanibel, FL
Flood risk 9/10 · Severe
- FEMA flood zone
- AE
- Chance of flooding over 30 yrs
- 0.99%
- Est. flood insurance / yr
- $1,737 – $8,500
Fire risk 1/10 · Minimal
- Est. fire insurance / yr
- $947 – $1,759
Heat risk 10/10 · Severe
- Hot days now (above 112°F)
- 7 days/yr
- Hot days in 30 yrs
- 27 days/yr
Wind risk 10/10 · Severe
- Chance of severe wind over 30 yrs
- 99.0%
Air-quality risk 2/10 · Minimal
- Unhealthy air days now
- 1 days/yr
- Unhealthy air days in 30 yrs
- 1 days/yr
Risk factors via First Street. Map © Google.
Why this score? — see what drove the B- grade
The composite is a weighted blend of 9 inputs, each scored 0–100. Each bar is that input's sub-score; the figure is the points it added to the 100-point composite (weight × sub-score).
- Cash flow +27.5/30.0
- DSCR +9.6/10.0
- 1% rule +8.8/10.0
- ARV discount +7.5/15.0
- Schools +4.1/10.0
- Livability +3.4/5.0
- Rent growth +2.5/5.0
- Condition / age +2.5/5.0
- Appreciation +0.0/10.0
$759,000
🖨 Deal sheet 📄 Offer letter ✓ Due diligence
Listing remarks
A great gulf view from this condo in the sought after Loggerhead Cay gulf front complex-Sanibel's favorite family vacation destination. Loggerhead condos are open and spacious with generous sized living areas and bedrooms. Condo D452 has a corner lanai with direct views to the gulf, 2 bedroom split floorplan, guest bath, private primary bath, dining/living area, full size washer & dryer, large eat in kitchen and lanai. Beautifully updated in pleasant neutral colors. Newimpact rated windows and doors for storm security-the building also has a new roof. Storage closets are located on each floor. Loggerhead amenities include aheated pool, tennis & pickle ball, grills, on site manag
Key facts
- Gulf view
- Corner lanai
- New roof
Tags
Property features AI
Finance
- Other: Pets allowed conditionally (maximum 2 pets, max 25 lb; breed restrictions may apply)
- Financial info: Community contains 168 units
- HOA & community: Part of HOA (monthly fee); HOA fee includes cable TV and internet; HOA fee includes legal/accounting, grounds maintenance, pest control, recreation facilities and reserve fund; Association amenities: beach rights, bike storage, barbecue, picnic area, pickleball, shuffleboard court, storage, tennis courts, management; Condo hotel community; Elevator; Near hotel/motel
Exterior
- Security: Security/high-impact doors
- Utilities: Cable available; Public water (assessment paid); Sewer via assessment paid
- Home design: Condo (multi-story community); 4 total stories; Entry on level 2; West-facing; East exposure; Has waterfront view (Gulf); Has view; Resale property
- Construction: Block, concrete and stucco construction; Built-up and flat roof
- Exterior features: Courtyard; Security/high-impact doors; Outdoor grill; Patio; Storage; Tennis court(s); Lanai; Screened porch; Porch
Interior
- Kitchen: Dishwasher; Disposal; Icemaker; Refrigerator (with ice maker); Self-cleaning oven
- Bedrooms: Guest quarters
- Flooring: Carpet; Tile
- Bathrooms: 2 full bathrooms
- Heating & cooling: Central heating (electric); Central air; Ceiling fans; Electric cooling
- Interior features: Furnished; Breakfast bar; Built-in features; Living/dining room; Tub with shower; High-speed internet; Split bedroom layout; Display windows; Impact glass
- Laundry & utility: Washer; Dryer; Laundry inside
Neighborhood map
What this means for you Summary
Snapshot
- This is a 2-bed/2.0-bath condo listed at $759k.
Deal economics
- At list price, monthly cash flow is $2k ($22k/yr) — positive.
- The deal already cash-flows at list — no discount required.
- Meets the 1% rule at list price ($10k rent vs $759k).
- Recommended offer: $691k (9.0% below list) — sets the bar for market timing.
- Cap rate 9.8% vs local median 3.8% in Sanibel — top-decile yield for the area; either an underpriced asset or a hidden risk that comps aren't pricing in. Stress-test before assuming the spread holds.
Location & tenants
- Location reads 67/100 on livability (#541 in FL) — a middle-class / working-renter tenant base. Strengths: schools A+, crime A+, employment A+; Watch: housing D+, amenities F, commute F.
- Lee (suburban): math 47% / reading 50% proficiency, ranked #42 of 73 in FL (top 58%) — families likely to look elsewhere, expect single-tenant / working-renter base with shorter leases.
- Market conditions: 526 active listings in the ZIP; 1 comparable units currently listed for rent nearby; 15,411 units permitted in Lee County in 2024 (4,686 in 5+ unit buildings).
Forward outlook
- Local home prices are declining (-3.0%/yr); year-one equity from $5k of loan paydown is wiped out by about $23k of value loss. Plan a longer hold.
- Lee County population projected at +44% by 2050 — long-run rental-demand tailwind backs the buy-and-hold thesis.
Negotiation context
- It's been on market 99 days — a 9% lower offer ($691k) is reasonable based on typical stale-listing flexibility.
- 2 sale attempts with the ask held roughly flat each time — persistent listings suggest the price (not the market) is what's stuck; bring a comps-based counter.
- Current owner paid $520k; 46% above their basis — modest negotiation headroom, anchor on the comps not their cost.
Risks & watch-outs
- Watch-outs: flood insurance adds $427/mo.
- Climate carrying-cost: in FEMA flood zone AE (mandatory federal flood insurance); severe wind risk, 99% chance of damaging wind over 30y; extreme-heat days projected 7→27/yr by 2055 (HVAC capex compounding) — expect insurance premiums to compound above CPI over the hold.
Questions for the listing agent
- It's been on market 99 days. Have you received any prior offers? Is the seller open to a 9% concession, seller financing, or rate buy-down credit?
- Built in 1976 — when were the roof, HVAC, electrical panel, plumbing, and water heater last replaced?
- What's the actual annual flood-insurance premium (NFIP or private), and is the property in a SFHA with mandatory coverage?
- What does the HOA fee cover, when was the last increase, and are there any pending special assessments or reserve-fund shortfalls?
- Any open or pending special assessments — roof, HVAC, plumbing, elevator, façade? What's the per-unit balance and payoff schedule, and is the seller paying it off at close or rolling it to the buyer?
- Why hasn't it sold? Are there any deal-killer items the seller is aware of (foundation, flood, title, zoning, code violations)?
- Is there a deadline driving the sale (1031 exchange, divorce, estate, relocation)? That informs how much negotiation room exists.
- Schools are A-rated — typically a magnet for longer-tenancy family renters. What's the average tenant stay here, and is there a school-zone premium baked into asking?
- What's the average days-on-market for RENTAL listings here right now (not sales)? A rising rental-DOM trend means longer vacancies and softer asking-rent achievability than the comps imply.
- What's the recent tenant-quality profile in this submarket — average credit score on applications, eviction rate, late-payment / NSF rate, and stable-employment percentage? A property-management company in the area should have these aggregated.
- How much new apartment / multifamily construction is in the pipeline within 1–3 miles? Heavy new supply (>2% of stock underway) typically softens rents 12–24 months out; light construction supports rent growth.
Investment metrics
- 1% rule
- 1.38% ✓
- Cap rate
- 9.84%
- Cash-on-cash
- 12.65%
- DSCR
- 1.56
- GRM
- 6.0
CMA / ARV
No comps found within radius.
Projected returns pro-forma
-3.0% appreciation · 3.0% rent growth · sell at horizon
- IRR
- -0.8%
- Equity multiple
- 0.97×
- Total profit
- $-6,506
- Equity at exit
- $113,169
- IRR
- 9.0%
- Equity multiple
- 1.69×
- Total profit
- $146,873
- Equity at exit
- $65,624
Cash invested: $212,520 (down + closing). Projections, not guarantees.
Landlord ↔ Tenant lean methodology
- Overall (STATE)
- 87 Strongly Landlord-Friendly
- State Florida
- 87 Strongly Landlord-Friendly · R+3
- County
- — inherits STATE
- City
- — inherits STATE
ZIP-level market 33957
- Home prices YoY
- -15.7%
- Active inventory
- 526
- Price-to-rent
- 6.0×
Monthly cashflow live
- Estimated rent
- $10,500 medium interval (Pro) →
- Mortgage (P&I)
- −$3,980
- Tax from tax record
- −$657 /mo · $7,889/yr
- Insurance
- −$316
- Flood insurance flood zone
- −$427 /mo · $5,118/yr
- HOA
- −$1,100
- Vacancy / Maint / Mgmt
- −$2,205
- Net cashflow
- $1,815
Break-even live
UW: 25.0% down · 7.5% · 30yr · 1.5% tax · 5.0% vac · 8.0% maint · 8.0% mgmt
Financing live
Cash to close
- Down payment
- $189,750
- Closing costs
- $22,770
- Reserves months
- —
- Total cash needed
- —
Loan-product check · same deal, 3 products live
Conventional
25% down · 7.5% · 30yr
- Down + closing
- —
- Monthly P&I
- —
- Monthly cashflow
- —
- DSCR
- —
- Eligible?
- —
Personal DTI + credit; lowest rate.
DSCR
20% down · 8.5% · 30yr
- Down + closing
- —
- Monthly P&I
- —
- Monthly cashflow
- —
- DSCR
- —
- Eligible?
- —
No personal income docs; deal must DSCR.
Hard money
10% down · 12.0% · 12mo
- Down + closing
- —
- Monthly P&I
- —
- Monthly cashflow
- —
- DSCR
- —
- Eligible?
- —
Short-term bridge; refi at stabilization.
Rent comps 1 comps
| Address | Beds | Baths | Sqft | Rent | $/sqft | DOM | Units | Dist |
|---|---|---|---|---|---|---|---|---|
| 827 E Gulf Dr Unit G8 Sanibel, FL | 2.0 | 2.0 | 1040 | $10,500 | $10.10 | 23d | 1 | 0.36mi |
HOA detail condo
- Monthly dues
- $1,100 · $13,200/yr
- Likely covers
- poolsecurity
- Assessments
- None detected in remarks — confirm with the listing agent.
Listing history 21 events
-
2026-06-17days on market $759,000 Active 99 DOM
-
2026-06-16days on market $759,000 Active 98 DOM
-
2026-06-15days on market $759,000 Active 97 DOM
-
2026-06-13days on market $759,000 Active 95 DOM
-
2026-06-10days on market $759,000 Active 92 DOM
-
2026-06-09days on market $759,000 Active 91 DOM
-
2026-06-07days on market $759,000 Active 89 DOM
-
2026-06-03days on market $759,000 Active 85 DOM
-
2026-06-02days on market $759,000 Active 84 DOM
-
2026-06-01days on market $759,000 Active 83 DOM
-
2026-06-01days on market $759,000 Active 82 DOM
-
2026-03-10$759,000 Active
-
2025-08-17historical
-
2025-03-17price $849,000
-
2025-02-17$895,000 Active
-
2016-12-05soldstatus $520,000
-
2006-03-09soldstatus $657,000
-
2004-07-23soldstatus $500,000
-
1999-10-12soldstatus $405,000
-
1996-01-08soldstatus $246,000
-
1995-12-01soldstatus $246,000
ⓘ Source: listings_history table (triggers on properties + properties_extension) + one-shot
backfill from property_details.listing_events for pre-trigger history.
Tax reassessment forecast FL · Resets to sale price
- Current annual tax
- $7,889 · $657/mo
- Projected year-2 tax
- $7,889 · $657/mo
- Expected delta
- $0/yr ($0/mo · 0.0%)
ⓘ Screening estimate from a state-policy table — verify with the county assessor before closing.
Climate risk First Street
- Flood 9/10 Extreme FEMA zone AE · 99% chance over 30 yrs
- Wildfire 1/10 Low
- Heat 10/10 Extreme 7 d/yr ≥112°F today · 27 d/yr by 30 yrs out
- Wind 10/10 Extreme 99% chance of damaging wind over 30 yrs
- Air quality 2/10 Low 1 unhealthy d/yr today · 1 by 30 yrs out
Nearby sold comps map
Loading sold comps map…
Walkable amenities ~0.75 mi
Loading nearby amenities…
Taxation est. · year 1
- Rental income
- $126,000
- − Mortgage interest
- −$42,516
- − Property taxes
- −$7,889
- − Insurance
- −$8,914
- − Repairs & maintenance
- −$10,080
- − Management
- −$10,080
- − HOA
- −$13,200
- − Depreciation
- −$22,080
- Taxable income
- $11,242
- Est. tax owed @ 24.0%
- −$2,698
- After-tax cash flow
- $19,076/yr
For passive investors: Depreciation is non-cash, so a rental often shows a tax loss while cash-flowing — sheltering income. Rental losses are passive: they offset passive income freely, and up to $25,000/yr can offset ordinary (W-2) income if you actively participate and your MAGI is under $100k (phasing out to $0 by $150k); unused losses carry forward. On sale, claimed depreciation is recaptured at up to 25%, and gains may owe capital-gains tax (a 1031 exchange can defer both). Figures are a year-1 estimate at your 24.0% rate — not tax advice; consult a CPA.
Schools (NCES district)
- District
- Lee
- NCES district ID
- 1201080
- Math proficiency
- 47% ▼ -11.00%
- Reading proficiency
- 50% ▼ -4.00%
- Median HH income
- $49,518
- Composite
- 41.49/100
- National rank
- #3458
- State rank
- #42 of 73 in FL
Livability — Sanibel
- Score
- 67/100
- State rank
- #541
- US rank
- #10166
Category grades
Schools grade is shown separately in the Schools card above.
Census & demographics
- Census place
- Sanibel, FL
- City population
- 6,402
- Population (ZIP)
- 6,402
Population outlook (Lee County) Hauer SSP2
- Today (2025)
- 871,946 people
- By 2030
- 955,468 · +9.6%
- By 2040
- 1,113,587 · +27.7%
- By 2050
- 1,256,891 · +44.1%
- By 2075
- 1,560,270 · +78.9%
- By 2100
- 1,726,848 · +98.0%
Race, ethnicity, and origin ACS 2023
- Neighborhood character
- Predominantly White (95%)
- Race & ethnicity
- White 95% Two or more races 2% Asian 1%
- Common ancestry
- Italian 4% Romanian 4% Slovak 2%
- Foreign-born
- 5% · Canada, China
- Languages at home
- 96% English-only · German/W. Germanic 1% Spanish 1% French/Haitian/Cajun 1%
Political lean MEDSL · Lee
- 2024 margin
- Strong R (+28.4) · D 35.5% · R 63.9%
- 2008→2024 swing
- -18.0pp toward R · 2008: -10.4pp · 2024: -28.4pp
- All cycles
- 2024: R+28.4 2020: R+19.2 2016: R+20.4 2012: R+16.6 2008: R+10.4
Not yet ingested
- Civics
- —
Market trends
- HPI YoY
- ▼ -93.08%
- Current HPI
- 501.0
- Rent YoY
- —
- Metro
- —
- State GDP YoY
- ▲ 3.28%
- F500 in state
- 36
Industry mix (Fortune 500 HQ in FL)
| Industry | F500 HQs | Revenue |
|---|---|---|
| Industrial Technology | 2 | $29B |
|
||
| Insurance | 2 | $17B |
|
||
| Retail | 1 | $60B |
|
||
| Technology Distribution | 1 | $58B |
|
||
| Homebuilding | 1 | $35B |
|
||
| Technology Manufacturing | 1 | $35B |
|
||
Price history
+208.5% since first listed10 events — show timeline
- 2026-03-10 Listed $759,000 FORTMLS
- 2025-08-17 Listing Removed — FORTMLS
- 2025-03-17 Price Changed $849,000 FORTMLS
- 2025-02-17 Listed $895,000 FORTMLS
- 2016-12-05 Sold (Public Records) $520,000 Public Records
- 2006-03-09 Sold (Public Records) $657,000 Public Records
- 2004-07-23 Sold (Public Records) $500,000 Public Records
- 1999-10-12 Sold (Public Records) $405,000 Public Records
- 1996-01-08 Sold (Public Records) $246,000 Public Records
- 1995-12-01 Sold (Public Records) $246,000 Public Records
Property tax history
+2.2%/yrLatest (2025): $7,889 · +1020.7% YoY. Source: county tax records.
Cash-flow waterfall
monthlySold comps — $/sqft
last 12 mo · ≤1 miLoading sold comps…