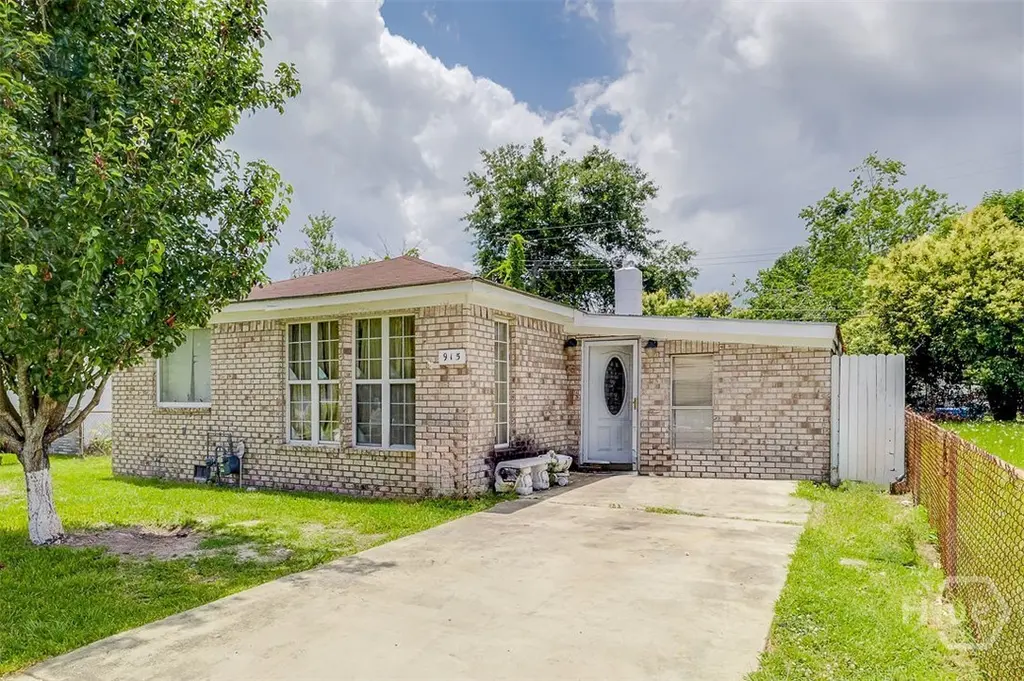
915 Porter St · Savannah, GA
Flood risk 1/10 · Minimal
- FEMA flood zone
- X (unshaded)
- Chance of flooding over 30 yrs
- 0.0%
- Est. flood insurance / yr
- $507 – $1,088
Fire risk 2/10 · Minimal
- Est. fire insurance / yr
- $963 – $1,789
Heat risk 10/10 · Severe
- Hot days now (above 109°F)
- 7 days/yr
- Hot days in 30 yrs
- 18 days/yr
Wind risk 9/10 · Severe
- Chance of severe wind over 30 yrs
- 99.0%
Air-quality risk 5/10 · Moderate
- Unhealthy air days now
- 7 days/yr
- Unhealthy air days in 30 yrs
- 8 days/yr
Risk factors via First Street. Map © Google.
Why this score? — see what drove the D- grade
The composite is a weighted blend of 9 inputs, each scored 0–100. Each bar is that input's sub-score; the figure is the points it added to the 100-point composite (weight × sub-score).
- Cash flow +18.0/30.0
- DSCR +5.6/10.0
- 1% rule +4.5/10.0
- Livability +4.3/5.0
- Rent growth +2.5/5.0
- Condition / age +2.5/5.0
- Schools +2.0/10.0
- ARV discount +0.0/15.0
- Appreciation +0.0/10.0
$200,000
🖨 Deal sheet (PDF) 📄 Offer letter ✓ Due diligence
Listing remarks MLS
This 1950s ranch bungalow offers four bedrooms and two full living areas, giving it a surprisingly spacious layout. The home’s design is practical, with a front living room and a separate den area, each with access to direct bathrooms for added privacy. While the property is filled with years of history, it has a solid foundation and good bones that can be brought back to life with updates. The floor plan can easily be reimagined into an open-concept design, multi-generational living, or even a multi-unit rental setup. Located near Enmarket Arena, this home benefits from the area quickly growing in activity and appeal. With some renovation, it has the potential to become a modern, comfortable home, perfect for a savvy investor or visionary homeowner. This property is ideal for buyers looking for space, potential, and a location positioned for future growth. Bring your creativity, roll up your sleeves, and unlock the hidden potential in one of Savannah’s most promising neighborhoods.
Key facts
- Direct bathrooms
- Separate den area
- Solid foundation
Tags
Neighborhood map
What this means for you Summary
Snapshot
- This is a 2-bed/1.0-bath single-family listed at $200k.
Deal economics
- At list price, monthly cash flow is $171 ($2k/yr) — positive.
- The deal already cash-flows at list — no discount required.
- To meet the 1% rule (rent ≥ 1% of price), the offer needs to be $191k (4.6% below list).
- Recommended offer: $176k (12.0% below list) — sets the bar for market timing.
- Cap rate 7.3% vs local median 4.0% in Savannah — top-decile yield for the area; either an underpriced asset or a hidden risk that comps aren't pricing in. Stress-test before assuming the spread holds.
Location & tenants
- Location reads 86/100 on livability (#1 in GA, #397 nationally) — a professional / high-income tenant draw. Strengths: crime A+, amenities A+, commute A+; Watch: employment D, schools F.
- Savannah-Chatham County (urban): math 20% / reading 26% proficiency, ranked #134 of 174 in GA (top 77%) — low school quality limits family demand, transient renter base, plan for 1-2y turnover.
- Market conditions: 78 active listings in the ZIP; 40 comparable units currently listed for rent nearby; rentals at typical pace (median 26d on market — plan ~3-4 weeks tenant-placement turnaround); lower-income renter base — watch delinquency; 2,694 units permitted in Chatham County in 2024 (973 in 5+ unit buildings).
- At $1,907/mo this rent would consume 62% of the median local household income ($37k/yr) (locally 613% of renters already pay >50% of income on rent) — very limited rent-growth headroom before tenants either downsize or default.
Forward outlook
- Local home prices are declining (-3.0%/yr); year-one equity from $1k of loan paydown is wiped out by about $6k of value loss. Plan a longer hold.
- Chatham County population projected at +33% by 2050 — long-run rental-demand tailwind backs the buy-and-hold thesis.
Negotiation context
- It's been on market 192 days — a 12% lower offer ($176k) is reasonable based on typical stale-listing flexibility.
- 4 sale attempts since 16y ago with the ask held roughly flat each time — persistent listings suggest the price (not the market) is what's stuck; bring a comps-based counter.
- Current owner paid $22k; list at $200k implies a 809% gain — meaningful room to come down on a strong offer.
Risks & watch-outs
- Watch-outs: built in 1958 — expect roof / HVAC / electrical / plumbing capex.
- Climate carrying-cost: severe wind risk, 99% chance of damaging wind over 30y; extreme-heat days projected 7→18/yr by 2055 (HVAC capex compounding) — expect insurance premiums to compound above CPI over the hold.
Questions for the listing agent
- It's been on market 192 days. Have you received any prior offers? Is the seller open to a 12% concession, seller financing, or rate buy-down credit?
- Built in 1958 — when were the roof, HVAC, electrical panel, plumbing, and water heater last replaced?
- Why hasn't it sold? Are there any deal-killer items the seller is aware of (foundation, flood, title, zoning, code violations)?
- Is there a deadline driving the sale (1031 exchange, divorce, estate, relocation)? That informs how much negotiation room exists.
- Schools are F-rated, which usually means shorter tenancies and higher turnover. Who's the typical renter profile here, and what's been the actual vacancy rate?
- The area grade is low — what's the realistic commute time and amenity access for the typical tenant pool here? Any planned neighborhood developments (good or bad) we should know about?
- What's the average days-on-market for RENTAL listings here right now (not sales)? A rising rental-DOM trend means longer vacancies and softer asking-rent achievability than the comps imply.
- What's the recent tenant-quality profile in this submarket — average credit score on applications, eviction rate, late-payment / NSF rate, and stable-employment percentage? A property-management company in the area should have these aggregated.
- How much new for-sale + rental construction is in the pipeline within 1–3 miles? Heavy new supply typically softens prices + rents 12–24 months out; constrained supply supports both.
Investment metrics
- 1% rule
- 0.95% ✗
- Cap rate
- 7.32%
- Cash-on-cash
- 3.67%
- DSCR
- 1.16
- GRM
- 8.7
CMA / ARV
- ARV (median comp)
- $145,620
- List price
- $200,000
- Delta
- 37.34%
- Verdict
- OVERPRICED
- Comps
- 20 within 1.0 mi
Show comp detail 12 sales within ~0.75 mi
| Address | Dist | Beds/Ba | Sqft | Sold | Price | $/sf | Match |
|---|---|---|---|---|---|---|---|
| 923 Wexler St | 0.10mi | 3/2.0 (+1) | 1,517 (+0%) | 11mo | $95,000 | $63 | 77 |
| 910 Carroll St | 0.11mi | 3/1.5 (+1) | 1,365 (-10%) | 10mo | $195,000 | $143 | 63 |
| 1606 Rosemary St | 0.60mi | 3/2.0 (+1) | 1,500 (-1%) | 10mo | $225,000 | $150 | 54 |
| 1518 Heron St | 0.29mi | 2/1.5 | 1,300 (-14%) | 11mo | $125,000 | $96 | 52 |
| 1004 Hearn St | 0.55mi | 3/2.0 (+1) | 1,520 (+0%) | 15mo | $150,000 | $99 | 52 |
| 1504 Cathy St | 0.29mi | 3/2.0 (+1) | 1,724 (+14%) | 3mo | $130,000 | $75 | 51 |
| 1640 Cloverdale Dr | 0.57mi | 3/2.0 (+1) | 1,525 (+1%) | 20mo | $284,900 | $187 | 47 |
| 1520 Audubon Dr | 0.35mi | 3/2.0 (+1) | 1,325 (-12%) | 18mo | $105,500 | $80 | 39 |
| 1015 Hearn St | 0.52mi | 2/1.5 | 1,296 (-14%) | 14mo | $72,000 | $56 | 38 |
| 1640 Eleanor St | 0.52mi | 3/1.5 (+1) | 1,330 (-12%) | 13mo | $175,000 | $132 | 38 |
| 1328 Comer St | 0.74mi | 3/2.5 (+1) | 1,300 (-14%) | 16mo | $260,000 | $200 | 17 |
| 1326 Comer St | 0.74mi | 3/2.5 (+1) | 1,300 (-14%) | 18mo | $260,000 | $200 | 16 |
Match score weights: distance 35% · size 25% · config 20% · recency 20%. Top-matched comps best support the ARV.
Projected returns pro-forma
-3.0% appreciation · 3.0% rent growth · sell at horizon
- IRR
- -10.5%
- Equity multiple
- 0.62×
- Total profit
- $-21,512
- Equity at exit
- $29,821
- IRR
- -1.2%
- Equity multiple
- 0.92×
- Total profit
- $-4,700
- Equity at exit
- $17,292
Cash invested: $56,000 (down + closing). Projections, not guarantees.
Landlord ↔ Tenant lean methodology
- Overall (STATE)
- 90 Strongly Landlord-Friendly
- State Georgia
- 90 Strongly Landlord-Friendly · R+3
- County
- — inherits STATE
- City
- — inherits STATE
ZIP-level market 31415
- Home prices YoY
- -21.4%
- Active inventory
- 78
- Price-to-rent
- 8.7×
Monthly cashflow live
- Estimated rent
- $1,907 high interval (Pro) →
- Mortgage (P&I)
- −$1,049
- Tax from tax record
- −$204 /mo · $2,442/yr
- Insurance
- −$83
- HOA
- −$0
- Vacancy / Maint / Mgmt
- −$401
- Net cashflow
- $171
Break-even live
Sensitivity live
| Price | -10% $284 | -5% $228 | +0% $171 | +5% $114 | +10% $58 |
|---|---|---|---|---|---|
| Rent | -10% $20 | -5% $96 | +0% $171 | +5% $246 | +10% $322 |
| Rate | -1.0pp $272 | -0.5pp $222 | base $171 | +0.5pp $119 | +1.0pp $67 |
UW: 25.0% down · 7.5% · 30yr · 1.5% tax · 5.0% vac · 8.0% maint · 8.0% mgmt
Financing live
Cash to close
- Down payment
- $50,000
- Closing costs
- $6,000
- Reserves months
- —
- Total cash needed
- —
Loan-product check · same deal, 3 products live
Conventional
25% down · 7.5% · 30yr
- Down + closing
- —
- Monthly P&I
- —
- Monthly cashflow
- —
- DSCR
- —
- Eligible?
- —
Personal DTI + credit; lowest rate.
DSCR
20% down · 8.5% · 30yr
- Down + closing
- —
- Monthly P&I
- —
- Monthly cashflow
- —
- DSCR
- —
- Eligible?
- —
No personal income docs; deal must DSCR.
Hard money
10% down · 12.0% · 12mo
- Down + closing
- —
- Monthly P&I
- —
- Monthly cashflow
- —
- DSCR
- —
- Eligible?
- —
Short-term bridge; refi at stabilization.
Rent comps 40 comps
| Address | Beds | Baths | Sqft | Rent | $/sqft | DOM | Units | Dist |
|---|---|---|---|---|---|---|---|---|
| 808 Wexler St Savannah, GA | 3.0 | 1.0 | 1204 | $1,500 | $1.25 | 45d | 1 | 0.14mi |
| 911 Crosby St Savannah, GA | 3.0 | 2.0 | 1116 | $2,000 | $1.79 | 45d | 1 | 0.18mi |
| 1520 Audubon Dr Savannah, GA | 3.0 | 2.0 | 1325 | $2,000 | $1.51 | 25d | 1 | 0.37mi |
| 1603 Eleanor St Savannah, GA | 3.0 | 1.5 | 1506 | $1,795 | $1.19 | 25d | 1 | 0.39mi |
| 2807 Ryals St Savannah, GA | 3.0 | 2.0 | 1220 | $1,650 | $1.35 | 25d | 1 | 0.95mi |
| 1019 W 35th St Unit B Savannah, GA | 3.0 | 2.0 | 1071 | $2,199 | $2.05 | 16d | 1 | 1.00mi |
| 2009 Eppinger St Savannah, GA | 3.0 | 2.0 | 1144 | $1,500 | $1.31 | 25d | 1 | 1.03mi |
| 1325 Exley St Savannah, GA | 3.0 | 2.0 | 1327 | $1,156 | $0.87 | 45d | 2 | 1.04mi |
| 1325 Exley St Savannah, GA | 2.0–3.0 | 1.0–2.5 | 1193 | $879 | $0.74 | 23d | 6 | 1.04mi |
| 909 W 36th St Savannah, GA | 2.0 | 1.0 | 1404 | $1,450 | $1.03 | 45d | 1 | 1.09mi |
| 1026 W 41st St Savannah, GA | 3.0 | 1.0 | 1128 | $1,500 | $1.33 | 16d | 1 | 1.14mi |
| 1011 W 40th St Savannah, GA | 3.0 | 2.0 | 1125 | $1,995 | $1.77 | 16d | 1 | 1.15mi |
| 2014 Lewden St Savannah, GA | 3.0 | 1.0 | 1164 | $1,600 | $1.37 | 25d | 1 | 1.15mi |
| 540 Selma St Savannah, GA | 2.0–5.0 | 2.0–5.0 | 790 | $949 | $1.20 | 25d | 1 | 1.21mi |
| 714 W 38th St Savannah, GA | 3.0 | 1.5 | 1200 | $1,650 | $1.38 | 25d | 1 | 1.23mi |
| 2011 Comet Ave Savannah, GA | 3.0 | 2.0 | 1126 | $2,400 | $2.13 | 25d | 1 | 1.25mi |
| 630 W 38th St Savannah, GA | 3.0 | 2.0 | 1600 | $1,950 | $1.22 | 16d | 1 | 1.25mi |
| 1005 W Victory Dr Savannah, GA | 3.0 | 2.0 | 1056 | $1,950 | $1.85 | 25d | 1 | 1.27mi |
| 620 W 38th St Unit B Savannah, GA | 2.0 | 1.0 | 1076 | $1,600 | $1.49 | 45d | 1 | 1.28mi |
| 555 Berrien St Unit N Savannah, GA | 2.0 | 2.5 | 1487 | $3,300 | $2.22 | 45d | 1 | 1.29mi |
| 906 W Victory Dr Savannah, GA | 3.0 | 2.0 | 1176 | $2,400 | $2.04 | 25d | 1 | 1.31mi |
| 528 Martin Luther King Junior Blvd Apt 2 Savannah, GA | 2.0 | 2.5 | 1150 | $1,995 | $1.73 | 45d | 1 | 1.32mi |
| 903 Montgomery St Savannah, GA | 3.0 | 2.0 | 1300 | $2,400 | $1.85 | 16d | 1 | 1.32mi |
| 903 Montgomery St Unit 903 Savannah, GA | 3.0 | 1.5 | 1300 | $2,400 | $1.85 | 16d | 1 | 1.32mi |
| 905 Montgomery St Unit 905 Savannah, GA | 2.0 | 1.0 | 1200 | $1,950 | $1.62 | 25d | 1 | 1.32mi |
| 601 W 37th St Unit B Savannah, GA | 2.0 | 2.0 | 1300 | $2,000 | $1.54 | 45d | 1 | 1.32mi |
| 615 Montgomery St Savannah, GA | 1.0–2.0 | 1.0–2.0 | 902 | $3,164 | $3.51 | 16d | 18 | 1.34mi |
| 320 W Hall St Unit A Savannah, GA | 2.0 | 1.0 | 1200 | $1,800 | $1.50 | 45d | 1 | 1.36mi |
| 516 W 38th St Unit 1/2 Savannah, GA | 3.0 | 1.0 | 1176 | $1,500 | $1.28 | 16d | 1 | 1.37mi |
| 516 W 38th St Unit 1/2 Savannah, GA | 3.0 | 1.0 | 1176 | $1,600 | $1.36 | 25d | 1 | 1.37mi |
| 303 W Waldburg St Savannah, GA | 3.0 | 2.0 | 1400 | $2,250 | $1.61 | 45d | 1 | 1.37mi |
| 301 W Henry St Unit B Savannah, GA | 2.0 | 1.0 | 1100 | $2,100 | $1.91 | 25d | 1 | 1.38mi |
| 1409 Jefferson St Savannah, GA | 3.0 | 2.5 | 1347 | $2,699 | $2.00 | 45d | 1 | 1.39mi |
| 221 W Duffy St Unit C3 Savannah, GA | 2.0 | 2.0 | 1200 | $2,900 | $2.42 | 25d | 1 | 1.39mi |
| 1003 W 46th St Savannah, GA | 3.0 | 1.0 | 1100 | $1,625 | $1.48 | 16d | 1 | 1.39mi |
| 429 Montgomery St Unit A Savannah, GA | 2.0 | 2.5 | 1200 | $2,600 | $2.17 | 45d | 1 | 1.40mi |
| 810 Jefferson St Unit B Savannah, GA | 2.0 | 2.5 | 1400 | $3,200 | $2.29 | 16d | 1 | 1.40mi |
| 218 W Anderson St Savannah, GA | 2.0 | 1.0 | 1200 | $2,200 | $1.83 | 45d | 1 | 1.41mi |
| 217 W Anderson St Savannah, GA | 2.0 | 2.0 | 1100 | $2,800 | $2.55 | 45d | 1 | 1.42mi |
| 303 Alice St Savannah, GA | 3.0 | 3.5 | 1936 | $4,500 | $2.32 | 45d | 1 | 1.42mi |
Listing history 24 events
-
2026-06-21days on market $200,000 Active 192 DOM
-
2026-06-18days on market $200,000 Active 189 DOM
-
2026-06-17days on market $200,000 Active 188 DOM
-
2026-06-16days on market $200,000 Active 187 DOM
-
2026-06-15days on market $200,000 Active 186 DOM
-
2026-06-14days on market $200,000 Active 184 DOM
-
2026-06-13days on market $200,000 Active 183 DOM
-
2026-06-10days on market $200,000 Active 181 DOM
-
2026-06-09days on market $200,000 Active 180 DOM
-
2026-06-08days on market $200,000 Active 179 DOM
-
2026-06-07days on market $200,000 Active 178 DOM
-
2026-06-05days on market $200,000 Active 175 DOM
-
2026-06-03days on market $200,000 Active 174 DOM
-
2026-06-02days on market $200,000 Active 173 DOM
-
2026-06-01days on market $200,000 Active 172 DOM
-
2026-05-31days on market $200,000 Active 171 DOM
-
2026-05-30days on market $200,000 Active 170 DOM
-
2025-10-01$200,000 Active 1009-char remark
Show marketing remark (1009 chars)
This 1950s ranch bungalow offers four bedrooms and two full living areas, giving it a surprisingly spacious layout. The home’s design is practical, with a front living room and a separate den area, each with access to direct bathrooms for added privacy. While the property is filled with years of history, it has a solid foundation and good bones that can be brought back to life with updates. The floor plan can easily be reimagined into an open-concept design, multi-generational living, or even a multi-unit rental setup. Located near Enmarket Arena, this home benefits from the area quickly growing in activity and appeal. With some renovation, it has the potential to become a modern, comfortable home, perfect for a savvy investor or visionary homeowner. This property is ideal for buyers looking for space, potential, and a location positioned for future growth. Bring your creativity, roll up your sleeves, and unlock the hidden potential in one of Savannah’s most promising neighborhoods.
-
2025-09-01historical
-
2025-01-06$200,000
-
2024-08-07historical
-
2024-06-04$210,000
-
2010-03-16soldstatus $22,000
-
2010-02-12$20,000
ⓘ Source: listings_history table (triggers on properties + properties_extension) + one-shot
backfill from property_details.listing_events for pre-trigger history.
Tax reassessment forecast GA · Resets to sale price
- Current annual tax
- $2,442 · $204/mo
- Projected year-2 tax
- $2,442 · $204/mo
- Expected delta
- $0/yr ($0/mo · 0.0%)
ⓘ Screening estimate from a state-policy table — verify with the county assessor before closing.
Climate risk First Street
- Flood 1/10 Low FEMA zone X (unshaded) · 0% chance over 30 yrs
- Wildfire 2/10 Low
- Heat 10/10 Extreme 7 d/yr ≥109°F today · 18 d/yr by 30 yrs out
- Wind 9/10 Extreme 99% chance of damaging wind over 30 yrs
- Air quality 5/10 Major 7 unhealthy d/yr today · 8 by 30 yrs out
Nearby sold comps map
Loading sold comps map…
Walkable amenities ~0.75 mi
Loading nearby amenities…
Taxation est. · year 1
- Rental income
- $22,888
- − Mortgage interest
- −$11,203
- − Property taxes
- −$2,442
- − Insurance
- −$1,000
- − Repairs & maintenance
- −$1,831
- − Management
- −$1,831
- − Depreciation
- −$5,818
- Taxable loss
- −$1,238
- Est. tax savings @ 24.0%
- +$297
- After-tax cash flow
- $2,350/yr
For passive investors: Depreciation is non-cash, so a rental often shows a tax loss while cash-flowing — sheltering income. Rental losses are passive: they offset passive income freely, and up to $25,000/yr can offset ordinary (W-2) income if you actively participate and your MAGI is under $100k (phasing out to $0 by $150k); unused losses carry forward. On sale, claimed depreciation is recaptured at up to 25%, and gains may owe capital-gains tax (a 1031 exchange can defer both). Figures are a year-1 estimate at your 24.0% rate — not tax advice; consult a CPA.
Schools (NCES district)
- District
- Savannah-Chatham County
- NCES district ID
- 1301020
- Math proficiency
- 20% ▼ -11.00%
- Reading proficiency
- 26% ▼ -5.00%
- Median HH income
- $47,443
- Composite
- 20.14/100
- National rank
- #8639
- State rank
- #134 of 174 in GA
Livability — Savannah
- Score
- 86/100
- State rank
- #1
- US rank
- #397
Category grades
Schools grade is shown separately in the Schools card above.
Census & demographics
- Census place
- Savannah, GA
- County
- Chatham County · 271,602 people
- City population
- 216,564
- Metro
- Savannah, GA
- Population (ZIP)
- 11,082
- Household income
- $37,109
- Rent vs Own
- Severe rent burden
- 613.0
Population outlook (Chatham County) Hauer SSP2
- Today (2025)
- 332,584 people
- By 2030
- 355,508 · +6.9%
- By 2040
- 400,030 · +20.3%
- By 2050
- 443,019 · +33.2%
- By 2075
- 534,579 · +60.7%
- By 2100
- 583,863 · +75.6%
Race, ethnicity, and origin ACS 2023
- Neighborhood character
- Predominantly Black (89%)
- Race & ethnicity
- Black 89% White 5% Hispanic / Latino 5% Two or more races 3%
- Foreign-born
- 2% · Canada
- Languages at home
- 95% English-only · Spanish 4%
Political lean MEDSL · Chatham
- 2024 margin
- D (+18.0) · D 58.6% · R 40.6%
- 2008→2024 swing
- +3.6pp toward D · 2008: 14.4pp · 2024: 18.0pp
- All cycles
- 2024: D+18.0 2020: D+18.8 2016: D+14.5 2012: D+12.0 2008: D+14.4
Not yet ingested
- Civics
- —
Market trends
- HPI YoY
- ▼ -55.36%
- Current HPI
- 203.0696
- Rent YoY
- —
- Metro
- Savannah, GA
- State GDP YoY
- ▲ 2.66%
- F500 in state
- 28
Industry mix (Fortune 500 HQ in GA)
| Industry | F500 HQs | Revenue |
|---|---|---|
| Paper / Packaging | 2 | $29B |
|
||
| Retail | 1 | $160B |
|
||
| Transportation / Logistics | 1 | $91B |
|
||
| Airlines | 1 | $62B |
|
||
| Consumer Goods | 1 | $47B |
|
||
| Utilities | 1 | $25B |
|
||
Price history
+900.0% since first listed7 events — show timeline
- 2025-10-01 Listed $200,000 Hive MLS
- 2025-09-01 Listing Removed — Hive MLS
- 2025-01-06 Listed $200,000 Hive MLS
- 2024-08-07 Listing Removed — Hive MLS
- 2024-06-04 Listed $210,000 Hive MLS
- 2010-03-16 Sold (MLS) $22,000 Hive MLS
- 2010-02-12 Listed $20,000 Hive MLS
Property tax history
+14.1%/yrLatest (2025): $2,442 · -27.0% YoY. Source: county tax records.
Cash-flow waterfall
monthlySold comps — $/sqft
last 12 mo · ≤1 miLoading sold comps…