115 Country Life Ter · Midway, AR
Flood risk 1/10 · Minimal
- FEMA flood zone
- X (unshaded)
- Chance of flooding over 30 yrs
- 0.0%
- Est. flood insurance / yr
- $507 – $1,088
Fire risk 5/10 · Moderate
- Est. fire insurance / yr
- $1,499 – $2,785
Heat risk 4/10 · Minor
- Hot days now (above 105°F)
- 7 days/yr
- Hot days in 30 yrs
- 20 days/yr
Wind risk 2/10 · Minimal
- Chance of severe wind over 30 yrs
- 0.0%
Air-quality risk 1/10 · Minimal
- Unhealthy air days now
- 0 days/yr
- Unhealthy air days in 30 yrs
- 0 days/yr
Risk factors via First Street. Map © Google.
Why this score? — see what drove the B+ grade
The composite is a weighted blend of 9 inputs, each scored 0–100. Each bar is that input's sub-score; the figure is the points it added to the 100-point composite (weight × sub-score).
- Cash flow +30.0/30.0
- 1% rule +10.0/10.0
- DSCR +10.0/10.0
- ARV discount +7.5/15.0
- Appreciation +6.9/10.0
- Schools +3.7/10.0
- Livability +3.3/5.0
- Rent growth +2.5/5.0
- Condition / age +2.5/5.0
$55,000
🖨 Deal sheet (PDF) 📄 Offer letter ✓ Due diligence
Listing remarks MLS
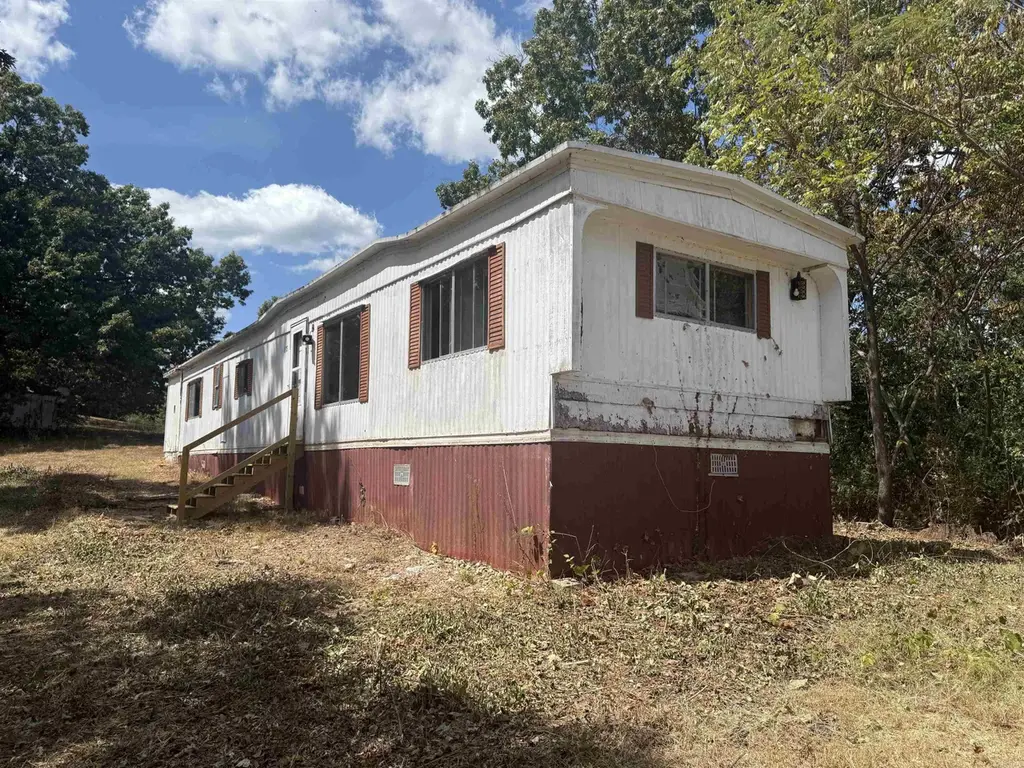
Looking for an affordable project with potential? This 2-bedroom, 2-bath single-wide sits on three lots totaling . 78 acres in Country Life Mobile Home Park. The home needs significant work and is being sold as-is, where-is, giving you the freedom to renovate or remove and start fresh. With plenty of space for a shop, garden, or future build, the oversized lots are a rare find in this community. Conveniently located in Midway, you’ll be just minutes from Bull Shoals Lake and all the outdoor recreation the Twin Lakes area has to offer. Whether you’re an investor, handyman, or simply looking for an affordable piece of property in a great location, this is a unique opportunity to create value and make it your own.
Key facts
- Oversized lots
- Outdoor recreation
- Three lots
Tags
Neighborhood map
What this means for you Summary
Snapshot
- This is a 3-bed/2.0-bath manufactured listed at $55k.
Deal economics
- At list price, monthly cash flow is $459 ($6k/yr) — positive.
- The deal already cash-flows at list — no discount required.
- Meets the 1% rule at list price ($994 rent vs $55k).
- Recommended offer: $48k (12.0% below list) — sets the bar for market timing.
- Cap rate 16.3% vs local median 2.5% in Midway — top-decile yield for the area; either an underpriced asset or a hidden risk that comps aren't pricing in. Stress-test before assuming the spread holds.
Location & tenants
- Location reads 66/100 on livability (#139 in AR) — a middle-class / working-renter tenant base. Strengths: cost of living A+, housing A+, crime A-; Watch: schools F, amenities F, commute F.
- Mountain Home School District (town): math 45% / reading 45% proficiency, ranked #40 of 238 in AR (top 17%) — families likely to look elsewhere, expect single-tenant / working-renter base with shorter leases.
- Market conditions: 17 active listings in the ZIP; 47 units permitted in Baxter County in 2024 (0 in 5+ unit buildings).
Forward outlook
- In year one you build about $3k of equity ($380 loan paydown + $2k appreciation (3.9% local appreciation)).
- Baxter County population projected to shrink 9% by 2050 — rents likely to lag national; underwrite the cash flow, not the appreciation.
- At projected returns (3.9% appreciation + 3.0% rent growth), your $15k cash investment doubles in ~2 years — after that, you're playing with house money.
Negotiation context
- It's been on market 288 days — a 12% lower offer ($48k) is reasonable based on typical stale-listing flexibility.
- 2 sale attempts with the ask held roughly flat each time — persistent listings suggest the price (not the market) is what's stuck; bring a comps-based counter.
- Current owner paid $16k; list at $55k implies a 244% gain — meaningful room to come down on a strong offer.
Risks & watch-outs
- Climate carrying-cost: moderate wildfire risk — expect insurance premiums to compound above CPI over the hold.
Questions for the listing agent
- It's been on market 288 days. Have you received any prior offers? Is the seller open to a 12% concession, seller financing, or rate buy-down credit?
- Why hasn't it sold? Are there any deal-killer items the seller is aware of (foundation, flood, title, zoning, code violations)?
- Is there a deadline driving the sale (1031 exchange, divorce, estate, relocation)? That informs how much negotiation room exists.
- Schools are F-rated, which usually means shorter tenancies and higher turnover. Who's the typical renter profile here, and what's been the actual vacancy rate?
- What's the average days-on-market for RENTAL listings here right now (not sales)? A rising rental-DOM trend means longer vacancies and softer asking-rent achievability than the comps imply.
- What's the recent tenant-quality profile in this submarket — average credit score on applications, eviction rate, late-payment / NSF rate, and stable-employment percentage? A property-management company in the area should have these aggregated.
- How much new for-sale + rental construction is in the pipeline within 1–3 miles? Heavy new supply typically softens prices + rents 12–24 months out; constrained supply supports both.
Investment metrics
- 1% rule
- 1.81% ✓
- Cap rate
- 16.32%
- Cash-on-cash
- 35.80%
- DSCR
- 2.59
- GRM
- 4.6
CMA / ARV
- ARV (median comp)
- $12,000
- List price
- $55,000
- Delta
- 358.33%
- Verdict
- OVERPRICED
- Comps
- 1 within 2.0 mi
Show comp detail 1 sale within ~0.75 mi
| Address | Dist | Beds/Ba | Sqft | Sold | Price | $/sf | Match |
|---|---|---|---|---|---|---|---|
| 49 Tafel Ln | 0.52mi | 2/2.0 (-1) | 896 (+7%) | 17mo | $115,000 | $128 | 45 |
Match score weights: distance 35% · size 25% · config 20% · recency 20%. Top-matched comps best support the ARV.
Projected returns pro-forma
3.88% appreciation · 3.0% rent growth · sell at horizon
- IRR
- 42.8%
- Equity multiple
- 3.50×
- Total profit
- $38,481
- Equity at exit
- $27,513
- IRR
- 41.8%
- Equity multiple
- 7.03×
- Total profit
- $92,853
- Equity at exit
- $44,705
Cash invested: $15,400 (down + closing). Projections, not guarantees.
Landlord ↔ Tenant lean methodology
- Overall (STATE)
- 92 Strongly Landlord-Friendly
- State Arkansas
- 92 Strongly Landlord-Friendly · R+14
- County
- — inherits STATE
- City
- — inherits STATE
ZIP-level market 72651
- Home prices YoY
- 1.7%
- Active inventory
- 17
- Price-to-rent
- 4.6×
Monthly cashflow live
- Estimated rent
- $994 medium interval (Pro) →
- Mortgage (P&I)
- −$288
- Tax from tax record
- −$14 /mo · $170/yr
- Insurance
- −$23
- HOA
- −$0
- Vacancy / Maint / Mgmt
- −$209
- Net cashflow
- $459
Break-even live
Sensitivity live
| Price | -10% $491 | -5% $475 | +0% $459 | +5% $444 | +10% $428 |
|---|---|---|---|---|---|
| Rent | -10% $381 | -5% $420 | +0% $459 | +5% $499 | +10% $538 |
| Rate | -1.0pp $487 | -0.5pp $473 | base $459 | +0.5pp $445 | +1.0pp $431 |
UW: 25.0% down · 7.5% · 30yr · 1.5% tax · 5.0% vac · 8.0% maint · 8.0% mgmt
Financing live
Cash to close
- Down payment
- $13,750
- Closing costs
- $1,650
- Reserves months
- —
- Total cash needed
- —
Loan-product check · same deal, 3 products live
Conventional
25% down · 7.5% · 30yr
- Down + closing
- —
- Monthly P&I
- —
- Monthly cashflow
- —
- DSCR
- —
- Eligible?
- —
Personal DTI + credit; lowest rate.
DSCR
20% down · 8.5% · 30yr
- Down + closing
- —
- Monthly P&I
- —
- Monthly cashflow
- —
- DSCR
- —
- Eligible?
- —
No personal income docs; deal must DSCR.
Hard money
10% down · 12.0% · 12mo
- Down + closing
- —
- Monthly P&I
- —
- Monthly cashflow
- —
- DSCR
- —
- Eligible?
- —
Short-term bridge; refi at stabilization.
Listing history 18 events
-
2026-06-19days on market $55,000 Active 288 DOM
-
2026-06-18days on market $55,000 Active 287 DOM
-
2026-06-17days on market $55,000 Active 286 DOM
-
2026-06-16days on market $55,000 Active 285 DOM
-
2026-06-15days on market $55,000 Active 284 DOM
-
2026-06-14days on market $55,000 Active 282 DOM
-
2026-06-12days on market $55,000 Active 281 DOM
-
2026-06-09days on market $55,000 Active 278 DOM
-
2026-06-08days on market $55,000 Active 277 DOM
-
2026-06-07days on market $55,000 Active 276 DOM
-
2026-06-05days on market $55,000 Active 273 DOM
-
2026-06-02days on market $55,000 Active 271 DOM
-
2026-06-01days on market $55,000 Active 270 DOM
-
2026-05-31days on market $55,000 Active 269 DOM
-
2026-05-30days on market $55,000 Active 268 DOM
-
2025-09-04$55,000 New Listing 732-char remark
Show marketing remark (736 chars)
Looking for an affordable project with potential? This 2-bedroom, 2-bath single-wide sits on three lots totaling . 78 acres m/l in Country Life Mobile Home Park. The home needs significant work and is being sold as-is, where-is, giving you the freedom to renovate or remove and start fresh. With plenty of space for a shop, garden, or future build, the oversized lots are a rare find in this community. Conveniently located in Midway, you’ll be just minutes from Bull Shoals Lake and all the outdoor recreation the Twin Lakes area has to offer. Whether you’re an investor, handyman, or simply looking for an affordable piece of property in a great location, this is a unique opportunity to create value and make it your own.
-
2025-09-04$55,000 Active 736-char remark
Show marketing remark (736 chars)
Looking for an affordable project with potential? This 2-bedroom, 2-bath single-wide sits on three lots totaling . 78 acres m/l in Country Life Mobile Home Park. The home needs significant work and is being sold as-is, where-is, giving you the freedom to renovate or remove and start fresh. With plenty of space for a shop, garden, or future build, the oversized lots are a rare find in this community. Conveniently located in Midway, you’ll be just minutes from Bull Shoals Lake and all the outdoor recreation the Twin Lakes area has to offer. Whether you’re an investor, handyman, or simply looking for an affordable piece of property in a great location, this is a unique opportunity to create value and make it your own.
-
1992-09-11soldstatus $16,000
ⓘ Source: listings_history table (triggers on properties + properties_extension) + one-shot
backfill from property_details.listing_events for pre-trigger history.
Tax reassessment forecast AR · Resets to sale price
- Current annual tax
- $170 · $14/mo
- Projected year-2 tax
- $352 · $29/mo
- Expected delta
- +$182/yr (+$15/mo · 106.9%)
ⓘ Screening estimate from a state-policy table — verify with the county assessor before closing.
Climate risk First Street
- Flood 1/10 Low FEMA zone X (unshaded) · 0% chance over 30 yrs
- Wildfire 5/10 Major
- Heat 4/10 Moderate 7 d/yr ≥105°F today · 20 d/yr by 30 yrs out
- Wind 2/10 Low 0% chance of damaging wind over 30 yrs
- Air quality 1/10 Low 0 unhealthy d/yr today · 0 by 30 yrs out
Nearby sold comps map
Loading sold comps map…
Walkable amenities ~0.75 mi
Loading nearby amenities…
Taxation est. · year 1
- Rental income
- $11,923
- − Mortgage interest
- −$3,081
- − Property taxes
- −$170
- − Insurance
- −$275
- − Repairs & maintenance
- −$954
- − Management
- −$954
- − Depreciation
- −$1,600
- Taxable income
- $4,889
- Est. tax owed @ 24.0%
- −$1,173
- After-tax cash flow
- $4,339/yr
For passive investors: Depreciation is non-cash, so a rental often shows a tax loss while cash-flowing — sheltering income. Rental losses are passive: they offset passive income freely, and up to $25,000/yr can offset ordinary (W-2) income if you actively participate and your MAGI is under $100k (phasing out to $0 by $150k); unused losses carry forward. On sale, claimed depreciation is recaptured at up to 25%, and gains may owe capital-gains tax (a 1031 exchange can defer both). Figures are a year-1 estimate at your 24.0% rate — not tax advice; consult a CPA.
Schools (NCES district)
- District
- Mountain Home School District
- NCES district ID
- 0500043
- Math proficiency
- 45% ▼ -8.00%
- Reading proficiency
- 45% ▼ -4.00%
- Median HH income
- $36,966
- Composite
- 37.4/100
- National rank
- #4424
- State rank
- #40 of 238 in AR
Livability — Midway
- Score
- 66/100
- State rank
- #139
- US rank
- #12379
Category grades
Schools grade is shown separately in the Schools card above.
Census & demographics
- Census place
- Midway, AR
- City population
- 1,422
- Population (ZIP)
- 1,422
Population outlook (Baxter County) Hauer SSP2
- Today (2025)
- 39,886 people
- By 2030
- 39,226 · -1.7%
- By 2040
- 37,810 · -5.2%
- By 2050
- 36,287 · -9.0%
- By 2075
- 32,965 · -17.4%
- By 2100
- 28,002 · -29.8%
Race, ethnicity, and origin ACS 2023
- Neighborhood character
- Predominantly White (90%)
- Race & ethnicity
- White 90% Asian 5% Two or more races 5%
- Common ancestry
- Serbian 4% Lithuanian 2% Romanian 1%
- Foreign-born
- 2% · South Korea
- Languages at home
- 97% English-only · Korean 2% German/W. Germanic 1%
Political lean MEDSL · Baxter
- 2024 margin
- Solid R (+56.9) · D 20.7% · R 77.6% · Other 1.7%
- 2008→2024 swing
- -25.3pp toward R · 2008: -31.6pp · 2024: -56.9pp
- All cycles
- 2024: R+56.9 2020: R+53.3 2016: R+53.6 2012: R+44.0 2008: R+31.6
Not yet ingested
- Civics
- —
Market trends
- HPI YoY
- ▲ 3.88%
- Current HPI
- 232.2963
- Rent YoY
- —
- Metro
- —
- State GDP YoY
- ▲ 3.80%
- F500 in state
- 10
Industry mix (Fortune 500 HQ in AR)
| Industry | F500 HQs | Revenue |
|---|---|---|
| Retail | 1 | $681B |
|
||
| Food / Agriculture | 1 | $53B |
|
||
| Retail / Energy | 1 | $22B |
|
||
| Transportation / Logistics | 1 | $12B |
|
||
| Energy | 1 | $4B |
|
||
Price history
+243.8% since first listed3 events — show timeline
- 2025-09-04 Listed $55,000 MHMLS
- 2025-09-04 Listed $55,000 CARMLS
- 1992-09-11 Sold (Public Records) $16,000 Public Records
Property tax history
+1.9%/yrLatest (2025): $170 · +0.0% YoY. Source: county tax records.
Cash-flow waterfall
monthlySold comps — $/sqft
last 12 mo · ≤1 miLoading sold comps…