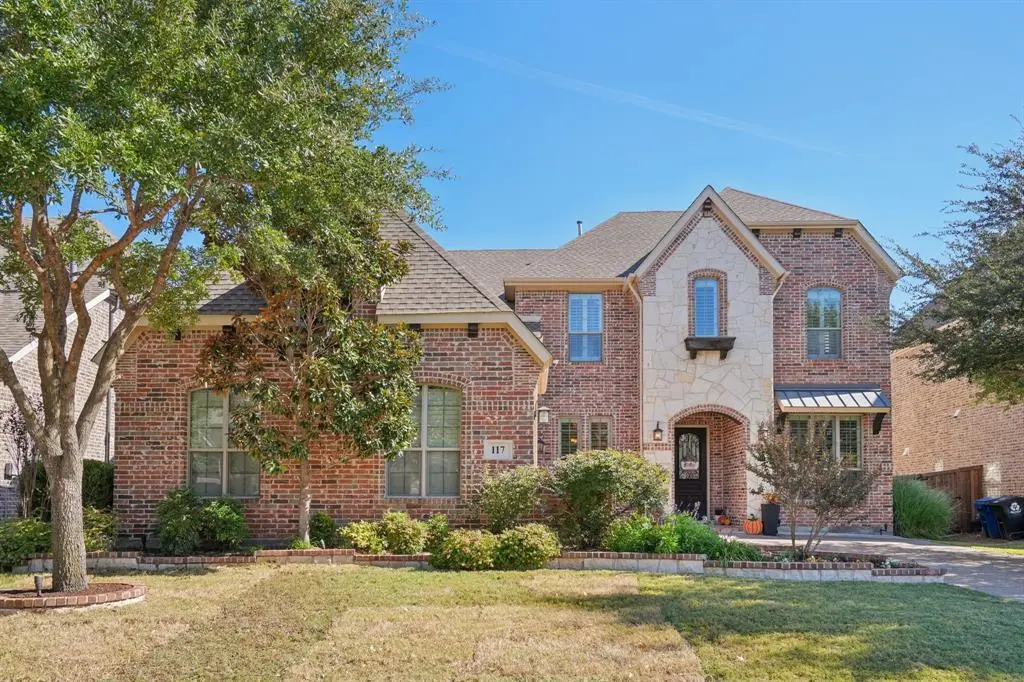
117 Crestbrook Dr · Rockwall, TX
Flood risk 1/10 · Minimal
- FEMA flood zone
- X (unshaded)
- Chance of flooding over 30 yrs
- 0.0%
- Est. flood insurance / yr
- $507 – $1,088
Fire risk 5/10 · Moderate
- Est. fire insurance / yr
- $1,222 – $2,270
Heat risk 7/10 · Major
- Hot days now (above 109°F)
- 7 days/yr
- Hot days in 30 yrs
- 24 days/yr
Wind risk 6/10 · Moderate
- Chance of severe wind over 30 yrs
- 27.0%
Air-quality risk 3/10 · Minor
- Unhealthy air days now
- 2 days/yr
- Unhealthy air days in 30 yrs
- 3 days/yr
Risk factors via First Street. Map © Google.
Why this score? — see what drove the D- grade
The composite is a weighted blend of 9 inputs, each scored 0–100. Each bar is that input's sub-score; the figure is the points it added to the 100-point composite (weight × sub-score).
- ARV discount +15.0/15.0
- Cash flow +6.4/30.0
- Schools +5.0/10.0
- Livability +3.9/5.0
- Rent growth +3.3/5.0
- Condition / age +2.5/5.0
- 1% rule +2.1/10.0
- DSCR +0.7/10.0
- Appreciation +0.0/10.0
$549,999
🖨 Deal sheet 📄 Offer letter ✓ Due diligence
Listing remarks
All OFFERS WILL BE ACCEPTED UNTIL SATURDAY MAY 8TH AT 6:00 P. M. NEARLY 100K UNDER TAX APPRAISAL!!!! WELCOME HOME to this beautifully designed 4-bedroom, 3.5-bath home in the highly desirable Stone Creek community of Rockwall. Offering over 3,600 square feet of thoughtfully designed living space, this home blends comfort, flexibility, and modern style perfect for today’s lifestyle. From the moment you walk in, you're greeted by soaring ceilings, abundant natural light, and an open layout that makes the home feel both spacious and inviting. The large living area flows seamlessly into the kitchen and dining spaces, creating the perfect setting for everyday living or hosting family an
Key facts
- Backyard patio
- Ample cabinetry
- Soaring ceilings
Tags
Property features AI
Finance
- Financial info: Listing accepts Cash, Conventional, FHA, and VA financing
- HOA & community: Mandatory homeowners association; Annual association fee; Association covers full use of facilities and management fees; HOA managed by Neighborhood Management Inc
Exterior
- Parking: Attached oversized garage with two covered spaces and two garage spaces; Garage with side-facing door and single 2-car door; Garage door opener; Carport spaces not provided
- Security: Burglar alarm; Security system; Smoke detectors
- Utilities: City water and city sewer; Electricity connected; Cable available; Curbs and sidewalks
- Home design: Single-family residence; Two-story home; Residential property
- Construction: Built in 2013; Composition roof; Slab foundation
- Exterior features: Outdoor kitchen with gas grill and outdoor grill; Gutters; Wrought iron fencing; Landscaped interior lot with a few trees; Subdivision location
Interior
- Kitchen: Dishwasher; Disposal; Gas cooktop; Double oven; Microwave; Vented exhaust fan; Walk-in pantry; Water line to refrigerator; Built-in cabinets
- Bedrooms: Primary bedroom on main level with dual sinks, garden tub, separate shower, separate vanities, ensuite bath, and walk-in closet; One bedroom on main level; Two bedrooms on second level
- Flooring: Wood flooring; Carpet; Ceramic tile
- Bathrooms: Three full bathrooms and one half bathroom
- Heating & cooling: Central heat (natural gas); Central electric air conditioning; Ceiling fans; Electric cooling
- Interior features: Open floorplan with vaulted ceilings; Decorative lighting; Flat screen wiring and sound system wiring; Cable TV and high-speed internet available; Kitchen island; Granite countertops; Walk-in closets; Eat-in kitchen
- Laundry & utility: Water line to refrigerator (kitchen); Appliances included
Neighborhood map
What this means for you Summary
Snapshot
- This is a 4-bed/3.5-bath single-family listed at $550k.
Deal economics
- At list price, monthly cash flow is $-960 ($-12k/yr) — negative.
- To cash-flow at today's rent, offer at most $380k (30.8% below list).
- To meet the 1% rule (rent ≥ 1% of price), the offer needs to be $388k (29.4% below list).
- Recommended offer: $380k (30.8% below list) — sets the bar for cash-flow.
- Cap rate 4.2% vs local median 2.9% in Rockwall — top-decile yield for the area; either an underpriced asset or a hidden risk that comps aren't pricing in. Stress-test before assuming the spread holds.
Location & tenants
- Location reads 77/100 on livability (#86 in TX, #3,043 nationally) — a middle-class / working-renter tenant base. Strengths: employment A+, housing A+, crime A-; Watch: amenities F, commute F.
- Rockwall ISD (suburban): math 54% / reading 54% proficiency, ranked #83 of 826 in TX (top 10%) — acceptable for families but not a draw, mixed tenant base, ~2y average lease.
- Zoned schools: Sherry And Paul Hamm El (math 60% / reading 58%, grade B-, #455 of 4,322 statewide, top 11%, 651 students, 12% FRL).
- Market conditions: Rents rising (+3.2%/yr); 1008 active listings in the ZIP; 18 comparable units currently listed for rent nearby; rentals at typical pace (median 24d on market — plan ~3-4 weeks tenant-placement turnaround); 44% of comp listings sitting > 30 days — soft ceiling on asking rent; high-income renter base; 1,810 units permitted in Rockwall County in 2024 (0 in 5+ unit buildings).
- This rent runs 36% of the median local income ($129k/yr) — at the standard rent-burdened threshold; future hikes will face affordability resistance.
Forward outlook
- Local home prices are declining (-3.0%/yr); year-one equity from $4k of loan paydown is wiped out by about $16k of value loss. Plan a longer hold.
- Rockwall County population projected at +56% by 2050 — long-run rental-demand tailwind backs the buy-and-hold thesis.
Negotiation context
- It's been on market 33 days — a 3% lower offer ($533k) is reasonable based on typical stale-listing flexibility.
- 7 sale attempts since 13y ago with the ask held roughly flat each time — persistent listings suggest the price (not the market) is what's stuck; bring a comps-based counter.
Risks & watch-outs
- Climate carrying-cost: major wind risk, 27% chance of damaging wind over 30y; moderate wildfire risk; extreme-heat days projected 7→24/yr by 2055 (HVAC capex compounding) — expect insurance premiums to compound above CPI over the hold.
Questions for the listing agent
- What do current leases actually rent for vs. the listed asking? Can we see a recent rent roll and the last 12 months of T-12 income?
- It's been on market 33 days. Have you received any prior offers? Is the seller open to a 31% concession, seller financing, or rate buy-down credit?
- What does the HOA fee cover, when was the last increase, and are there any pending special assessments or reserve-fund shortfalls?
- Is there a deadline driving the sale (1031 exchange, divorce, estate, relocation)? That informs how much negotiation room exists.
- Schools are B-rated — typically a magnet for longer-tenancy family renters. What's the average tenant stay here, and is there a school-zone premium baked into asking?
- The area grade is low — what's the realistic commute time and amenity access for the typical tenant pool here? Any planned neighborhood developments (good or bad) we should know about?
- What's the average days-on-market for RENTAL listings here right now (not sales)? A rising rental-DOM trend means longer vacancies and softer asking-rent achievability than the comps imply.
- What's the recent tenant-quality profile in this submarket — average credit score on applications, eviction rate, late-payment / NSF rate, and stable-employment percentage? A property-management company in the area should have these aggregated.
- How much new for-sale + rental construction is in the pipeline within 1–3 miles? Heavy new supply typically softens prices + rents 12–24 months out; constrained supply supports both.
Investment metrics
- 1% rule
- 0.71% ✗
- Cap rate
- 4.20%
- Cash-on-cash
- -7.48%
- DSCR
- 0.67
- GRM
- 11.8
CMA / ARV
- ARV (median comp)
- $692,122
- List price
- $549,999
- Delta
- -20.53%
- Verdict
- UNDERPRICED
- Comps
- 20 within 1.0 mi
Show comp detail 12 sales within ~0.75 mi
| Address | Dist | Beds/Ba | Sqft | Sold | Price | $/sf | Match |
|---|---|---|---|---|---|---|---|
| 609 Bordeaux Dr | 0.33mi | 4/3.0 | 3,245 (-5%) | 1mo | $699,500 | $216 | 74 |
| 420 Montrose Dr | 0.35mi | 4/3.5 | 3,656 (+7%) | 1mo | $600,000 | $164 | 71 |
| 786 Bordeaux Dr | 0.40mi | 4/3.5 | 3,185 (-7%) | 3mo | $670,000 | $210 | 68 |
| 902 Montrose Dr | 0.48mi | 4/4.0 | 3,598 (+6%) | 0mo | $749,900 | $208 | 66 |
| 914 Roys Dr | 0.30mi | 4/3.5 | 2,992 (-12%) | 1mo | $785,900 | $263 | 65 |
| 674 Hanover Dr | 0.36mi | 4/4.0 | 3,755 (+10%) | 0mo | $600,000 | $160 | 64 |
| 2438 Miranda Ln | 0.25mi | 4/3.0 | 2,929 (-14%) | 0mo | $699,000 | $239 | 62 |
| 2502 Judith Dr | 0.39mi | 4/4.0 | 3,738 (+10%) | 3mo | $769,999 | $206 | 61 |
| 2304 Miranda Ln | 0.40mi | 4/3.5 | 3,886 (+14%) | 1mo | $699,999 | $180 | 57 |
| 2316 Miranda Ln | 0.36mi | 4/4.0 | 2,963 (-13%) | 3mo | $599,300 | $202 | 57 |
| 2209 Laurel Dr | 0.44mi | 4/3.5 | 3,875 (+14%) | 3mo | $669,999 | $173 | 54 |
| 838 Bear Branch Ct | 0.74mi | 4/2.5 | 2,968 (-13%) | 2mo | $399,900 | $135 | 38 |
Match score weights: distance 35% · size 25% · config 20% · recency 20%. Top-matched comps best support the ARV.
Projected returns pro-forma
-3.0% appreciation · 3.23% rent growth · sell at horizon
- IRR
- -29.0%
- Equity multiple
- 0.03×
- Total profit
- $-149,151
- Equity at exit
- $82,007
- IRR
- -27.9%
- Equity multiple
- -0.33×
- Total profit
- $-204,071
- Equity at exit
- $47,554
Cash invested: $154,000 (down + closing). Projections, not guarantees.
Landlord ↔ Tenant lean methodology
- Overall (STATE)
- 87 Strongly Landlord-Friendly
- State Texas
- 87 Strongly Landlord-Friendly · R+5
- County
- — inherits STATE
- City
- — inherits STATE
ZIP-level market 75087
- Rents YoY
- 3.2%
- Active inventory
- 1008
- Price-to-rent
- 11.8×
Monthly cashflow live
- Estimated rent
- $3,883 high interval (Pro) →
- Mortgage (P&I)
- −$2,884
- Tax from tax record
- −$843 /mo · $10,114/yr
- Insurance
- −$229
- HOA
- −$71
- Vacancy / Maint / Mgmt
- −$815
- Net cashflow
- $-960
Break-even live
UW: 25.0% down · 7.5% · 30yr · 1.5% tax · 5.0% vac · 8.0% maint · 8.0% mgmt
Financing live
Cash to close
- Down payment
- $137,500
- Closing costs
- $16,500
- Reserves months
- —
- Total cash needed
- —
Loan-product check · same deal, 3 products live
Conventional
25% down · 7.5% · 30yr
- Down + closing
- —
- Monthly P&I
- —
- Monthly cashflow
- —
- DSCR
- —
- Eligible?
- —
Personal DTI + credit; lowest rate.
DSCR
20% down · 8.5% · 30yr
- Down + closing
- —
- Monthly P&I
- —
- Monthly cashflow
- —
- DSCR
- —
- Eligible?
- —
No personal income docs; deal must DSCR.
Hard money
10% down · 12.0% · 12mo
- Down + closing
- —
- Monthly P&I
- —
- Monthly cashflow
- —
- DSCR
- —
- Eligible?
- —
Short-term bridge; refi at stabilization.
Rent comps 18 comps
| Address | Beds | Baths | Sqft | Rent | $/sqft | DOM | Units | Dist |
|---|---|---|---|---|---|---|---|---|
| 545 Goose Lake Dr Rockwall, TX | 5.0 | 5.5 | 4002 | $4,500 | $1.12 | 43d | 1 | 0.09mi |
| 586 Mountcastle Dr Rockwall, TX | 4.0 | 3.5 | 3087 | $3,950 | $1.28 | 43d | 1 | 0.19mi |
| 439 Montrose Dr Rockwall, TX | 4.0 | 4.5 | 3811 | $3,900 | $1.02 | 4d | 1 | 0.33mi |
| 1927 Pebble Ln Rockwall, TX | 5.0 | 5.5 | 4242 | $4,800 | $1.13 | 5d | 1 | 0.59mi |
| 1468 Red Wolf Dr Rockwall, TX | 4.0 | 3.0 | 2835 | $2,999 | $1.06 | 5d | 1 | 0.65mi |
| 3537 Ridgecross Dr Rockwall, TX | 4.0 | 3.5 | 3542 | $3,825 | $1.08 | 43d | 1 | 0.65mi |
| 3526 Ridgecross Dr Rockwall, TX | 5.0 | 4.5 | 3485 | $7,200 | $2.07 | 43d | 1 | 0.69mi |
| 1980 Creekside Dr Rockwall, TX | 4.0 | 4.0 | 4279 | $3,849 | $0.90 | 2d | 1 | 0.79mi |
| 1150 Potter Ave Rockwall, TX | 4.0 | 2.5 | 2739 | $2,850 | $1.04 | 20d | 1 | 1.11mi |
| 1369 Crescent Cove Dr Rockwall, TX | 5.0 | 3.0 | 2828 | $2,895 | $1.02 | 22d | 1 | 1.12mi |
| 1369 Crescent Cove Dr Rockwall, TX | 5.0 | 3.0 | 2828 | $2,895 | $1.02 | 5d | 1 | 1.12mi |
| 449 Sausalito Dr Rockwall, TX | 5.0 | 3.0 | 3036 | $2,795 | $0.92 | 18d | 1 | 1.17mi |
| 7132 Hunt Ln Unit 1019551P Rockwall, TX | 5.0 | 2.5 | 2906 | $15,524 | $5.34 | 21d | 1 | 1.18mi |
| 7132 Hunt Ln Rockwall, TX | 5.0 | 2.5 | 2910 | $8,750 | $3.01 | 43d | 1 | 1.18mi |
| 1360 Shores Blvd Rockwall, TX | 4.0 | 3.5 | 3145 | $3,450 | $1.10 | 43d | 1 | 1.30mi |
| 1391 Riverside Oaks Dr Rockwall, TX | 4.0 | 4.0 | 3224 | $3,250 | $1.01 | 43d | 1 | 1.36mi |
| 4602 Lorion Dr Rockwall, TX | 4.0 | 3.0 | 3144 | $4,100 | $1.30 | 43d | 1 | 1.39mi |
| 4602 Lorion Dr Rockwall, TX | 4.0 | 3.0 | 3144 | $4,100 | $1.30 | 24d | 1 | 1.39mi |
HOA detail
- Monthly dues
- $71 · $852/yr
Listing history 24 events
-
2026-06-02statusdays on market $549,999 Pending 33 DOM
-
2026-06-01days on market $549,999 Active Option Contract 32 DOM
-
2026-05-31days on market $549,999 Active Option Contract 31 DOM
-
2026-04-30$549,999 Active 1725-char remark
-
2026-04-28historical
-
2026-04-08$599,999 Active
-
2026-03-31historical
-
2026-03-12price $629,500
-
2026-01-29$629,999 Active
-
2026-01-13historical
-
2025-12-23price $649,750
-
2025-12-09price $649,900
-
2025-11-06$650,000 Active
-
2018-11-09soldstatus Sold
-
2018-10-05status Pending
-
2018-09-11historical Active Option Contract
-
2018-08-27price $449,000
-
2018-08-05status Active
-
2018-07-15historical Active Option Contract
-
2018-07-13price $459,000
-
2018-06-18$469,000 Active
-
2013-11-01soldstatus Closed
-
2013-06-13$388,990 Active
-
2013-05-20soldstatus
ⓘ Source: listings_history table (triggers on properties + properties_extension) + one-shot
backfill from property_details.listing_events for pre-trigger history.
Tax reassessment forecast TX · Resets to sale price
- Current annual tax
- $10,114 · $843/mo
- Projected year-2 tax
- $10,114 · $843/mo
- Expected delta
- $0/yr ($0/mo · 0.0%)
ⓘ Screening estimate from a state-policy table — verify with the county assessor before closing.
Climate risk First Street
- Flood 1/10 Low FEMA zone X (unshaded) · 0% chance over 30 yrs
- Wildfire 5/10 Major
- Heat 7/10 Severe 7 d/yr ≥109°F today · 24 d/yr by 30 yrs out
- Wind 6/10 Major 27% chance of damaging wind over 30 yrs
- Air quality 3/10 Moderate 2 unhealthy d/yr today · 3 by 30 yrs out
Nearby sold comps map
Loading sold comps map…
Walkable amenities ~0.75 mi
Loading nearby amenities…
Taxation est. · year 1
- Rental income
- $46,595
- − Mortgage interest
- −$30,808
- − Property taxes
- −$10,114
- − Insurance
- −$2,750
- − Repairs & maintenance
- −$3,728
- − Management
- −$3,728
- − HOA
- −$852
- − Depreciation
- −$16,000
- Taxable loss
- −$21,384
- Est. tax savings @ 24.0%
- +$5,132
- After-tax cash flow
- $-6,384/yr
For passive investors: Depreciation is non-cash, so a rental often shows a tax loss while cash-flowing — sheltering income. Rental losses are passive: they offset passive income freely, and up to $25,000/yr can offset ordinary (W-2) income if you actively participate and your MAGI is under $100k (phasing out to $0 by $150k); unused losses carry forward. On sale, claimed depreciation is recaptured at up to 25%, and gains may owe capital-gains tax (a 1031 exchange can defer both). Figures are a year-1 estimate at your 24.0% rate — not tax advice; consult a CPA.
Schools (NCES district)
- District
- Rockwall ISD
- NCES district ID
- 4837650
- Math proficiency
- 54% ▼ -13.00%
- Reading proficiency
- 54% ▼ -8.00%
- Median HH income
- $88,800
- Composite
- 49.82/100
- National rank
- #1952
- State rank
- #83 of 826 in TX
Livability — Rockwall
- Score
- 77/100
- State rank
- #86
- US rank
- #3043
Category grades
Schools grade is shown separately in the Schools card above.
Census & demographics
- Census place
- Rockwall, TX
- County
- Rockwall County · 132,930 people
- City population
- 84,191
- Metro
- Dallas-Fort Worth-Arlington, TX
- Population (ZIP)
- 44,326
- Household income
- $129,484
- Rent vs Own
- Severe rent burden
- 646.0
Population outlook (Rockwall County) Hauer SSP2
- Today (2025)
- 118,396 people
- By 2030
- 132,209 · +11.7%
- By 2040
- 159,538 · +34.7%
- By 2050
- 185,299 · +56.5%
- By 2075
- 243,489 · +105.7%
- By 2100
- 277,814 · +134.6%
Race, ethnicity, and origin ACS 2023
- Neighborhood character
- Predominantly White (69%)
- Race & ethnicity
- White 69% Hispanic / Latino 17% Two or more races 12% Black 7% Asian 4%
- Hispanic origin (detail)
- Mexican 12%
- Common ancestry
- Slovak 2% Italian 2% Iranian 2%
- Foreign-born
- 8% · Canada, Vietnam, South Korea
- Languages at home
- 88% English-only · Spanish 8% Other Indo-European 1% Vietnamese 1%
Political lean MEDSL · Rockwall
- 2024 margin
- Solid R (+40.9) · D 29.1% · R 70.0%
- 2008→2024 swing
- +5.3pp toward D · 2008: -46.2pp · 2024: -40.9pp
- All cycles
- 2024: R+40.9 2020: R+37.7 2016: R+47.5 2012: R+53.3 2008: R+46.2
Not yet ingested
- Civics
- —
Market trends
- HPI YoY
- ▼ -188.34%
- Current HPI
- 208.2221
- Rent YoY
- ▲ 3.23%
- Metro
- Dallas-Fort Worth-Arlington, TX
- State GDP YoY
- ▲ 3.95%
- F500 in state
- 110
Industry mix (Fortune 500 HQ in TX)
| Industry | F500 HQs | Revenue |
|---|---|---|
| Energy | 16 | $1,198B |
|
||
| Technology | 5 | $198B |
|
||
| Engineering / Construction | 4 | $72B |
|
||
| Energy Services | 3 | $60B |
|
||
| Utilities | 3 | $41B |
|
||
| Healthcare | 2 | $330B |
|
||
Price history
+41.4% since first listed23 events — show timeline
- 2026-06-02 Pending — NTREIS
- 2026-05-25 Contingent — NTREIS
- 2026-04-30 Listed $549,999 NTREIS
- 2026-04-28 Listing Removed — NTREIS
- 2026-04-08 Listed $599,999 NTREIS
- 2026-03-31 Listing Removed — NTREIS
- 2026-03-12 Price Changed $629,500 NTREIS
- 2026-01-29 Listed $629,999 NTREIS
- 2026-01-13 Listing Removed — NTREIS
- 2025-12-23 Price Changed $649,750 NTREIS
- 2025-12-09 Price Changed $649,900 NTREIS
- 2025-11-06 Listed $650,000 NTREIS
- 2018-11-09 Sold (MLS) — NTREIS
- 2018-10-05 Pending — NTREIS
- 2018-09-11 Contingent — NTREIS
- 2018-08-27 Price Changed $449,000 NTREIS
- 2018-08-05 Relisted — NTREIS
- 2018-07-15 Contingent — NTREIS
- 2018-07-13 Price Changed $459,000 NTREIS
- 2018-06-18 Listed $469,000 NTREIS
- 2013-11-01 Sold (MLS) — NTREIS
- 2013-06-13 Listed $388,990 NTREIS
- 2013-05-20 Sold (Public Records) — Public Records
Property tax history
+37.8%/yrLatest (2025): $10,114 · +5.1% YoY. Source: county tax records.
Cash-flow waterfall
monthlySold comps — $/sqft
last 12 mo · ≤1 miLoading sold comps…