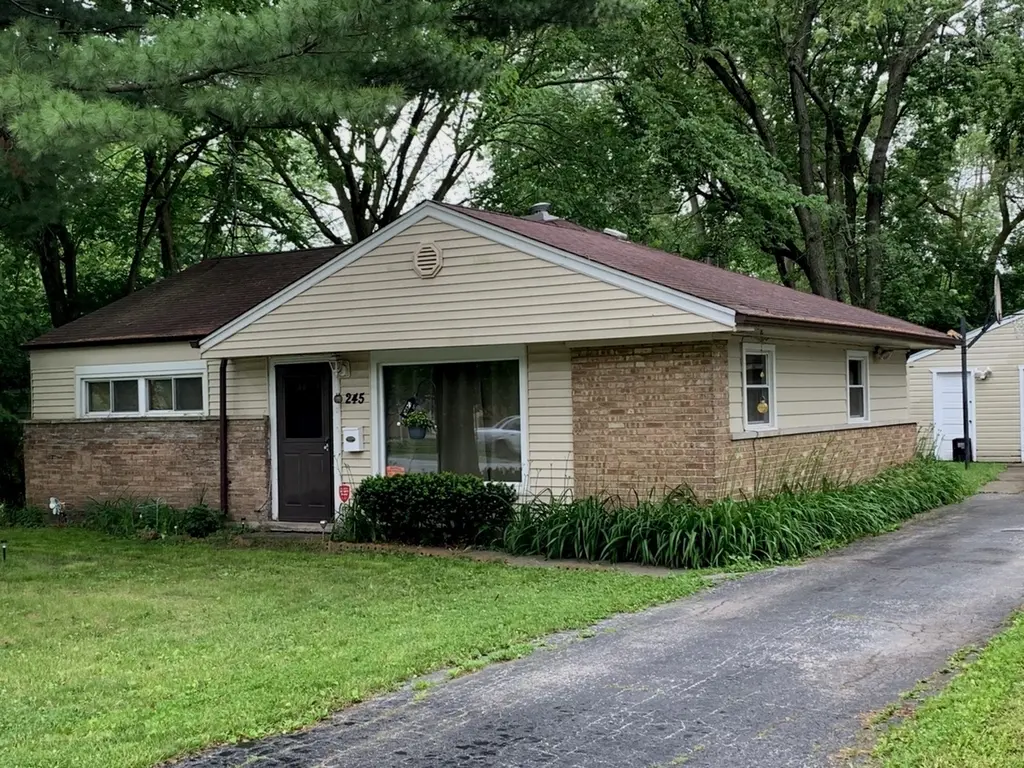
245 Blackhawk Dr · Park Forest, IL
Flood risk 1/10 · Minimal
- FEMA flood zone
- X (unshaded)
- Chance of flooding over 30 yrs
- 0.0%
- Est. flood insurance / yr
- $473 – $860
Fire risk 1/10 · Minimal
- Est. fire insurance / yr
- $804 – $1,492
Heat risk 3/10 · Minor
- Hot days now (above 101°F)
- 7 days/yr
- Hot days in 30 yrs
- 16 days/yr
Wind risk 2/10 · Minimal
- Chance of severe wind over 30 yrs
- —
Air-quality risk 2/10 · Minimal
- Unhealthy air days now
- 1 days/yr
- Unhealthy air days in 30 yrs
- 1 days/yr
Risk factors via First Street. Map © Google.
Why this score? — see what drove the C- grade
The composite is a weighted blend of 9 inputs, each scored 0–100. Each bar is that input's sub-score; the figure is the points it added to the 100-point composite (weight × sub-score).
- Cash flow +20.9/30.0
- 1% rule +8.1/10.0
- DSCR +6.7/10.0
- ARV discount +5.8/15.0
- Livability +3.9/5.0
- Rent growth +2.5/5.0
- Condition / age +2.5/5.0
- Schools +0.9/10.0
- Appreciation +0.0/10.0
$139,900
🖨 Deal sheet 📄 Offer letter ✓ Due diligence
Listing remarks MLS
GREAT INVESTMENT OPPORTUNITY! CHARMING PROPERTY NESTLED IN THE PEACEFUL NEIGHBORHOOD OF PARK FOREST. THIS HOME OFFERS TWO COZY BEDROOMS AND ONE FULL BATHROOM, MAKING IT A PERFECT CHOICE FOR SMALL FAMILIES OR ROOMMATES SEEKING COMFORTABLE LIVING ARRANGEMENTS. THE WELL-LIT LIVING AREA ON THE MAIN LEVEL BOASTS LARGE WINDOWS THAT PROVIDE AMPLE NATURAL LIGHT AND CREATE A WARM AND INVITING AMBIANCE. THE PROPERTY ALSO FEATURES A SPACIOUS BACKYARD, IDEAL FOR HOSTING OUTDOOR GATHERINGS WITH FAMILY AND FRIENDS. AN EXCELLENT INVESTMENT OPPORTUNITY THAT YOU DON'T WANT TO MISS.
Key facts
- New flooring
- Large backyard
- New appliances
Tags
Property features AI
Finance
- Other: Parcel number 31354130190000
- Financial info: Special service area: No
- HOA & community: No master association fee required
Exterior
- Parking: Detached garage (1 garage space, 1 total parking space); Garage owned
- Utilities: Public water; Public sewer
- Home design: Detached single-family home; One-story; Fee simple ownership; Rehab completed in 2026; Property built before 1978
- Construction: Aluminum siding and brick exterior; Estimated age 71–80 years; Not rebuilt
- Exterior features: Lot dimensions approximately 60 x 120; Lot under 0.25 acre; Commuter train access nearby
Interior
- Kitchen: Kitchen (12 x 10); Range; Dishwasher; Refrigerator
- Bedrooms: Master bedroom on main level (13 x 10); Second bedroom on main level (11 x 10); Additional bedrooms listed
- Bathrooms: One full bathroom
- Heating & cooling: Natural gas heating
- Interior features: Four total rooms; Dining room; Family room; Living room (21 x 13)
- Laundry & utility: Laundry room
Neighborhood map
What this means for you Summary
Snapshot
- This is a 2-bed/1.0-bath single-family listed at $140k.
Deal economics
- At list price, monthly cash flow is $195 ($2k/yr) — positive.
- The deal already cash-flows at list — no discount required.
- Meets the 1% rule at list price ($2k rent vs $140k).
- Recommended offer: $132k (6.0% below list) — sets the bar for market timing.
Location & tenants
- Location reads 78/100 on livability (#148 in IL, #2,726 nationally) — a middle-class / working-renter tenant base. Strengths: commute A+, cost of living A+, housing A+; Watch: schools D+, amenities F.
- Rich Twp Hsd 227 (suburban): math 5% / reading 12% proficiency, ranked #577 of 620 in IL (top 93%) — low school quality limits family demand, transient renter base, plan for 1-2y turnover.
- Market conditions: 102 active listings in the ZIP; 20 comparable units currently listed for rent nearby; rentals leasing fast (median 7d on market — plan ~1-2 weeks tenant-placement turnaround); 6,272 units permitted in Cook County in 2024 (4,658 in 5+ unit buildings).
- This rent runs 36% of the median local income ($62k/yr) — at the standard rent-burdened threshold; future hikes will face affordability resistance.
Forward outlook
- Local home prices are declining (-3.0%/yr); year-one equity from $967 of loan paydown is wiped out by about $4k of value loss. Plan a longer hold.
Negotiation context
- It's been on market 73 days — a 6% lower offer ($132k) is reasonable based on typical stale-listing flexibility.
- 8 sale attempts since 19y ago; this cycle's ask has dropped $10k (7%) from the opening price — seller is motivated, your offer sets the floor, not the list.
- Current owner paid $75k; list at $140k implies a 87% gain — meaningful room to come down on a strong offer.
Risks & watch-outs
- Watch-outs: property tax is 4.0% of price; built in 1952 — expect roof / HVAC / electrical / plumbing capex.
Questions for the listing agent
- It's been on market 73 days. Have you received any prior offers? Is the seller open to a 6% concession, seller financing, or rate buy-down credit?
- Built in 1952 — when were the roof, HVAC, electrical panel, plumbing, and water heater last replaced?
- Property tax is high relative to price — has the assessment been appealed recently, and will the sale trigger a re-assessment?
- Why hasn't it sold? Are there any deal-killer items the seller is aware of (foundation, flood, title, zoning, code violations)?
- Is there a deadline driving the sale (1031 exchange, divorce, estate, relocation)? That informs how much negotiation room exists.
- Schools are D-rated, which usually means shorter tenancies and higher turnover. Who's the typical renter profile here, and what's been the actual vacancy rate?
- What's the average days-on-market for RENTAL listings here right now (not sales)? A rising rental-DOM trend means longer vacancies and softer asking-rent achievability than the comps imply.
- What's the recent tenant-quality profile in this submarket — average credit score on applications, eviction rate, late-payment / NSF rate, and stable-employment percentage? A property-management company in the area should have these aggregated.
- How much new for-sale + rental construction is in the pipeline within 1–3 miles? Heavy new supply typically softens prices + rents 12–24 months out; constrained supply supports both.
Investment metrics
- 1% rule
- 1.31% ✓
- Cap rate
- 7.96%
- Cash-on-cash
- 5.97%
- DSCR
- 1.27
- GRM
- 6.3
CMA / ARV
- ARV (on-the-fly)
- $134,758
- Comps found
- 12
Show comp detail 12 sales within ~0.75 mi
| Address | Dist | Beds/Ba | Sqft | Sold | Price | $/sf | Match |
|---|---|---|---|---|---|---|---|
| 254 Blackhawk Dr | 0.06mi | 2/1.0 | 1,000 (+5%) | 2mo | $105,000 | $105 | 87 |
| 209 Miami St | 0.20mi | 2/1.0 | 974 (+3%) | 1mo | $108,000 | $111 | 86 |
| 314 Seminole St | 0.31mi | 2/1.0 | 949 (0%) | 1mo | $135,000 | $142 | 85 |
| 316 Mohawk St | 0.35mi | 2/1.0 | 949 (0%) | 2mo | $141,000 | $149 | 82 |
| 318 Minocqua St | 0.40mi | 2/1.0 | 974 (+3%) | 1mo | $145,000 | $149 | 76 |
| 353 Miami St | 0.51mi | 2/1.0 | 949 (0%) | 4mo | $112,000 | $118 | 73 |
| 354 Marquette St | 0.55mi | 2/1.0 | 973 (+2%) | 2mo | $131,000 | $135 | 69 |
| 136 Peach St | 0.61mi | 2/1.0 | 974 (+3%) | 3mo | $163,000 | $167 | 65 |
| 208 Miami St | 0.22mi | 3/1.5 (+1) | 1,053 (+11%) | 2mo | $175,000 | $166 | 63 |
| 310 Nassau St | 0.65mi | 3/1.0 (+1) | 953 (+0%) | 1mo | $129,000 | $135 | 63 |
| 429 Natoma St | 0.41mi | 3/1.0 (+1) | 1,035 (+9%) | 0mo | $159,000 | $154 | 60 |
| 314 Windsor St | 0.60mi | 3/1.0 (+1) | 1,014 (+7%) | 2mo | $141,000 | $139 | 54 |
Match score weights: distance 35% · size 25% · config 20% · recency 20%. Top-matched comps best support the ARV.
Projected returns pro-forma
-3.0% appreciation · 3.0% rent growth · sell at horizon
- IRR
- -6.9%
- Equity multiple
- 0.74×
- Total profit
- $-10,048
- Equity at exit
- $20,860
- IRR
- 2.8%
- Equity multiple
- 1.21×
- Total profit
- $8,076
- Equity at exit
- $12,096
Cash invested: $39,172 (down + closing). Projections, not guarantees.
Landlord ↔ Tenant lean methodology
- Overall (STATE)
- 43 Moderately Tenant-Leaning
- State Illinois
- 43 Moderately Tenant-Leaning · D+7
- County
- — inherits STATE
- City
- — inherits STATE
ZIP-level market 60466
- Home prices YoY
- -21.1%
- Active inventory
- 102
- Price-to-rent
- 6.3×
Monthly cashflow live
- Estimated rent
- $1,840 high interval (Pro) →
- Mortgage (P&I)
- −$734
- Tax from tax record
- −$466 /mo · $5,597/yr
- Insurance
- −$58
- HOA
- −$0
- Vacancy / Maint / Mgmt
- −$386
- Net cashflow
- $195
Break-even live
UW: 25.0% down · 7.5% · 30yr · 1.5% tax · 5.0% vac · 8.0% maint · 8.0% mgmt
Financing live
Cash to close
- Down payment
- $34,975
- Closing costs
- $4,197
- Reserves months
- —
- Total cash needed
- —
Loan-product check · same deal, 3 products live
Conventional
25% down · 7.5% · 30yr
- Down + closing
- —
- Monthly P&I
- —
- Monthly cashflow
- —
- DSCR
- —
- Eligible?
- —
Personal DTI + credit; lowest rate.
DSCR
20% down · 8.5% · 30yr
- Down + closing
- —
- Monthly P&I
- —
- Monthly cashflow
- —
- DSCR
- —
- Eligible?
- —
No personal income docs; deal must DSCR.
Hard money
10% down · 12.0% · 12mo
- Down + closing
- —
- Monthly P&I
- —
- Monthly cashflow
- —
- DSCR
- —
- Eligible?
- —
Short-term bridge; refi at stabilization.
Rent comps 20 comps
| Address | Beds | Baths | Sqft | Rent | $/sqft | DOM | Units | Dist |
|---|---|---|---|---|---|---|---|---|
| 411 Huron St Park Forest, IL | 3.0 | 1.0 | 1092 | $2,300 | $2.11 | 24d | 1 | 0.17mi |
| 277 Somonauk St Park Forest, IL | 3.0 | 1.0 | 966 | $2,000 | $2.07 | 3d | 1 | 0.25mi |
| 194 Monee Rd Park Forest, IL | 3.0 | 1.0 | 1092 | $1,971 | $1.80 | 21d | 1 | 0.61mi |
| 235 Tampa St Park Forest, IL | 3.0 | 1.0 | 1092 | $2,000 | $1.83 | 24d | 1 | 0.63mi |
| 3484 Western Ave Unit 3484-B Park Forest, IL | 1.0 | 1.0 | 600 | $1,300 | $2.17 | 1d | 1 | 1.15mi |
| 3905 Tower Dr Richton Park, IL | 1.0–2.0 | 1.0–2.0 | 905 | $1,795 | $1.98 | 1d | 19 | 1.17mi |
| 3324 Western Ave Park Forest, IL | 1.0–3.0 | 1.0 | 1026 | $1,680 | $1.64 | 1d | 11 | 1.26mi |
| 22501 Butterfield Rd Unit 22411-514 Richton Park, IL | 2.0 | 1.5 | 1021 | $1,365 | $1.34 | 7d | 1 | 1.28mi |
| 22501 Butterfield Rd Unit 22411-506 Richton Park, IL | 2.0 | 1.0 | 882 | $1,325 | $1.50 | 7d | 1 | 1.28mi |
| 22501 Butterfield Rd Unit 22407-202 Richton Park, IL | 1.0 | 1.0 | 667 | $1,210 | $1.81 | 7d | 1 | 1.28mi |
| 22501 Butterfield Rd Unit 22400-311 Richton Park, IL | 2.0 | 1.0 | 882 | $1,360 | $1.54 | 7d | 1 | 1.28mi |
| 22501 Butterfield Rd Unit 22415-207 Richton Park, IL | 2.0 | 1.5 | 944 | $1,360 | $1.44 | 7d | 1 | 1.28mi |
| 22501 Butterfield Rd Unit 22411-304 Richton Park, IL | 1.0 | 1.0 | 688 | $1,215 | $1.77 | 7d | 1 | 1.28mi |
| 22501 Butterfield Rd Unit 22419-109 Richton Park, IL | 2.0 | 1.0 | 798 | $1,310 | $1.64 | 7d | 1 | 1.28mi |
| 22501 Butterfield Rd Unit 22407-104 Richton Park, IL | 1.0 | 1.0 | 621 | $1,195 | $1.92 | 7d | 1 | 1.28mi |
| 4014 Euclid Ln Richton Park, IL | 2.0 | 1.0 | 1100 | $2,100 | $1.91 | 7d | 1 | 1.29mi |
| 4014 Euclid Ln Richton Park, IL | 3.0 | 1.0 | 1100 | $2,100 | $1.91 | 12d | 1 | 1.29mi |
| 4014 Euclid Ln Richton Park, IL | 2.0 | 1.0 | 1100 | $2,100 | $1.91 | 21d | 1 | 1.29mi |
| 23439 Western Ave Unit K12 Park Forest, IL | 1.0 | 1.0 | 800 | $1,415 | $1.77 | 1d | 1 | 1.32mi |
| 23439 Western Ave Unit C29 Park Forest, IL | 2.0 | 2.0 | 975 | $1,570 | $1.61 | 1d | 1 | 1.32mi |
Listing history 27 events
-
2026-05-31days on market $139,900 Active 73 DOM
-
2026-04-06price $139,900
-
2026-03-19$149,900 Active
-
2023-07-12soldstatus $75,000
-
2023-06-16soldstatus $75,000 Closed 571-char remark
Show marketing remark (571 chars)
GREAT INVESTMENT OPPORTUNITY! CHARMING PROPERTY NESTLED IN THE PEACEFUL NEIGHBORHOOD OF PARK FOREST. THIS HOME OFFERS TWO COZY BEDROOMS AND ONE FULL BATHROOM, MAKING IT A PERFECT CHOICE FOR SMALL FAMILIES OR ROOMMATES SEEKING COMFORTABLE LIVING ARRANGEMENTS. THE WELL-LIT LIVING AREA ON THE MAIN LEVEL BOASTS LARGE WINDOWS THAT PROVIDE AMPLE NATURAL LIGHT AND CREATE A WARM AND INVITING AMBIANCE. THE PROPERTY ALSO FEATURES A SPACIOUS BACKYARD, IDEAL FOR HOSTING OUTDOOR GATHERINGS WITH FAMILY AND FRIENDS. AN EXCELLENT INVESTMENT OPPORTUNITY THAT YOU DON'T WANT TO MISS.
-
2023-05-04historical Contingent - No Showings 571-char remark
Show marketing remark (571 chars)
GREAT INVESTMENT OPPORTUNITY! CHARMING PROPERTY NESTLED IN THE PEACEFUL NEIGHBORHOOD OF PARK FOREST. THIS HOME OFFERS TWO COZY BEDROOMS AND ONE FULL BATHROOM, MAKING IT A PERFECT CHOICE FOR SMALL FAMILIES OR ROOMMATES SEEKING COMFORTABLE LIVING ARRANGEMENTS. THE WELL-LIT LIVING AREA ON THE MAIN LEVEL BOASTS LARGE WINDOWS THAT PROVIDE AMPLE NATURAL LIGHT AND CREATE A WARM AND INVITING AMBIANCE. THE PROPERTY ALSO FEATURES A SPACIOUS BACKYARD, IDEAL FOR HOSTING OUTDOOR GATHERINGS WITH FAMILY AND FRIENDS. AN EXCELLENT INVESTMENT OPPORTUNITY THAT YOU DON'T WANT TO MISS.
-
2023-05-01$89,900 Active 571-char remark
Show marketing remark (571 chars)
GREAT INVESTMENT OPPORTUNITY! CHARMING PROPERTY NESTLED IN THE PEACEFUL NEIGHBORHOOD OF PARK FOREST. THIS HOME OFFERS TWO COZY BEDROOMS AND ONE FULL BATHROOM, MAKING IT A PERFECT CHOICE FOR SMALL FAMILIES OR ROOMMATES SEEKING COMFORTABLE LIVING ARRANGEMENTS. THE WELL-LIT LIVING AREA ON THE MAIN LEVEL BOASTS LARGE WINDOWS THAT PROVIDE AMPLE NATURAL LIGHT AND CREATE A WARM AND INVITING AMBIANCE. THE PROPERTY ALSO FEATURES A SPACIOUS BACKYARD, IDEAL FOR HOSTING OUTDOOR GATHERINGS WITH FAMILY AND FRIENDS. AN EXCELLENT INVESTMENT OPPORTUNITY THAT YOU DON'T WANT TO MISS.
-
2021-07-27soldstatus $55,000 Closed 31-char remark
Show marketing remark (31 chars)
There are no remarks available.
-
2021-07-14status Active Under Contract 31-char remark
Show marketing remark (31 chars)
There are no remarks available.
-
2021-06-03status Contingent 31-char remark
Show marketing remark (31 chars)
There are no remarks available.
-
2021-05-24status Reactivated 31-char remark
Show marketing remark (31 chars)
There are no remarks available.
-
2021-05-05status Contingent 31-char remark
Show marketing remark (31 chars)
There are no remarks available.
-
2021-02-26$62,000 New 31-char remark
Show marketing remark (31 chars)
There are no remarks available.
-
2019-08-02soldstatus $29,900 Closed Sale
-
2019-07-13status Pending
-
2019-06-29$29,900 New
-
2014-09-23soldstatus $15,000 Closed Sale
-
2014-09-09status Pending
-
2014-08-18price $19,900 Price Change
-
2014-07-19$24,900 New
-
2012-11-17historical
-
2012-09-01New
-
2008-01-18historical
-
2007-09-18
-
2005-05-05soldstatus $77,000
-
1999-07-14soldstatus $63,000
-
1993-06-10soldstatus $61,000
ⓘ Source: listings_history table (triggers on properties + properties_extension) + one-shot
backfill from property_details.listing_events for pre-trigger history.
Tax reassessment forecast IL · Partial reset (capped growth)
- Current annual tax
- $5,597 · $466/mo
- Projected year-2 tax
- $5,597 · $466/mo
- Expected delta
- $0/yr ($0/mo · 0.0%)
ⓘ Screening estimate from a state-policy table — verify with the county assessor before closing.
Climate risk First Street
- Flood 1/10 Low FEMA zone X (unshaded) · 0% chance over 30 yrs
- Wildfire 1/10 Low
- Heat 3/10 Moderate 7 d/yr ≥101°F today · 16 d/yr by 30 yrs out
- Wind 2/10 Low
- Air quality 2/10 Low 1 unhealthy d/yr today · 1 by 30 yrs out
Nearby sold comps map
Loading sold comps map…
Walkable amenities ~0.75 mi
Loading nearby amenities…
Taxation est. · year 1
- Rental income
- $22,075
- − Mortgage interest
- −$7,837
- − Property taxes
- −$5,597
- − Insurance
- −$700
- − Repairs & maintenance
- −$1,766
- − Management
- −$1,766
- − Depreciation
- −$4,070
- Taxable income
- $340
- Est. tax owed @ 24.0%
- −$82
- After-tax cash flow
- $2,257/yr
For passive investors: Depreciation is non-cash, so a rental often shows a tax loss while cash-flowing — sheltering income. Rental losses are passive: they offset passive income freely, and up to $25,000/yr can offset ordinary (W-2) income if you actively participate and your MAGI is under $100k (phasing out to $0 by $150k); unused losses carry forward. On sale, claimed depreciation is recaptured at up to 25%, and gains may owe capital-gains tax (a 1031 exchange can defer both). Figures are a year-1 estimate at your 24.0% rate — not tax advice; consult a CPA.
Schools (NCES district)
- District
- Rich Twp Hsd 227
- NCES district ID
- 1733420
- Math proficiency
- 5% ▼ -3.00%
- Reading proficiency
- 12% ▬ 0.00%
- Median HH income
- $56,056
- Composite
- 8.93/100
- National rank
- #9885
- State rank
- #577 of 620 in IL
Livability — Park Forest
- Score
- 78/100
- State rank
- #148
- US rank
- #2726
Category grades
Schools grade is shown separately in the Schools card above.
Census & demographics
- Census place
- Park Forest, IL
- County
- Cook County · 4,486,803 people
- City population
- 21,461
- Metro
- Chicago-Naperville-Elgin, IL-IN-WI
- Population (ZIP)
- 21,461
- Household income
- $61,654
- Rent vs Own
- Severe rent burden
- 900.0
Population outlook (Cook County) Hauer SSP2
- Today (2025)
- 5,347,519 people
- By 2030
- 5,357,703 · +0.2%
- By 2040
- 5,324,924 · -0.4%
- By 2050
- 5,230,762 · -2.2%
- By 2075
- 4,785,735 · -10.5%
- By 2100
- 4,188,836 · -21.7%
Race, ethnicity, and origin ACS 2023
- Neighborhood character
- Predominantly Black (69%)
- Race & ethnicity
- Black 69% White 19% Hispanic / Latino 9% Two or more races 3% Native American 1%
- Hispanic origin (detail)
- Mexican 8%
- Common ancestry
- Romanian 2% Iranian 1% Italian 1%
- Foreign-born
- 6% · Canada
- Languages at home
- 90% English-only · Spanish 7% French/Haitian/Cajun 1% Russian/Polish/Slavic 1%
Political lean MEDSL · Cook
- 2024 margin
- Solid D (+42.0) · D 70.4% · R 28.4% · Other 1.2%
- 2008→2024 swing
- -11.4pp toward R · 2008: 53.4pp · 2024: 42.0pp
- All cycles
- 2024: D+42.0 2020: D+50.3 2016: D+53.0 2012: D+49.4 2008: D+53.4
Not yet ingested
- Civics
- —
Market trends
- HPI YoY
- ▼ -58.87%
- Current HPI
- 219.9692
- Rent YoY
- —
- Metro
- Chicago-Naperville-Elgin, IL-IN-WI
- State GDP YoY
- ▲ 1.59%
- F500 in state
- 60
Industry mix (Fortune 500 HQ in IL)
| Industry | F500 HQs | Revenue |
|---|---|---|
| Insurance | 4 | $201B |
|
||
| Consumer Goods | 4 | $87B |
|
||
| Industrial Machinery | 3 | $64B |
|
||
| Healthcare | 2 | $55B |
|
||
| Retail / Pharmacy | 1 | $148B |
|
||
| Agriculture / Food | 1 | $86B |
|
||
Price history
+129.3% since first listed26 events — show timeline
- 2026-04-06 Price Changed $139,900 MRED as Distributed by MLS Grid
- 2026-03-19 Listed $149,900 MRED as Distributed by MLS Grid
- 2023-07-12 Sold (Public Records) $75,000 Public Records
- 2023-06-16 Sold (MLS) $75,000 MRED as Distributed by MLS Grid
- 2023-05-04 Contingent — MRED as Distributed by MLS Grid
- 2023-05-01 Listed $89,900 MRED as Distributed by MLS Grid
- 2021-07-27 Sold (MLS) $55,000 MRED as Distributed by MLS Grid
- 2021-07-14 Pending — MRED as Distributed by MLS Grid
- 2021-06-03 Pending — MRED as Distributed by MLS Grid
- 2021-05-24 Relisted — MRED as Distributed by MLS Grid
- 2021-05-05 Pending — MRED as Distributed by MLS Grid
- 2021-02-26 Listed $62,000 MRED as Distributed by MLS Grid
- 2019-08-02 Sold (MLS) $29,900 MRED as Distributed by MLS Grid
- 2019-07-13 Pending — MRED as Distributed by MLS Grid
- 2019-06-29 Listed $29,900 MRED as Distributed by MLS Grid
- 2014-09-23 Sold (MLS) $15,000 MRED as Distributed by MLS Grid
- 2014-09-09 Pending — MRED as Distributed by MLS Grid
- 2014-08-18 Price Changed $19,900 MRED as Distributed by MLS Grid
- 2014-07-19 Listed $24,900 MRED as Distributed by MLS Grid
- 2012-11-17 Listing Removed — MRED as Distributed by MLS Grid
- 2012-09-01 Listed — MRED as Distributed by MLS Grid
- 2008-01-18 Listing Removed — MRED as Distributed by MLS Grid
- 2007-09-18 Listed — MRED as Distributed by MLS Grid
- 2005-05-05 Sold (Public Records) $77,000 Public Records
- 1999-07-14 Sold (Public Records) $63,000 Public Records
- 1993-06-10 Sold (Public Records) $61,000 Public Records
Property tax history
+5.3%/yrLatest (2023): $5,597 · +17.8% YoY. Source: county tax records.
Cash-flow waterfall
monthlySold comps — $/sqft
last 12 mo · ≤1 miLoading sold comps…