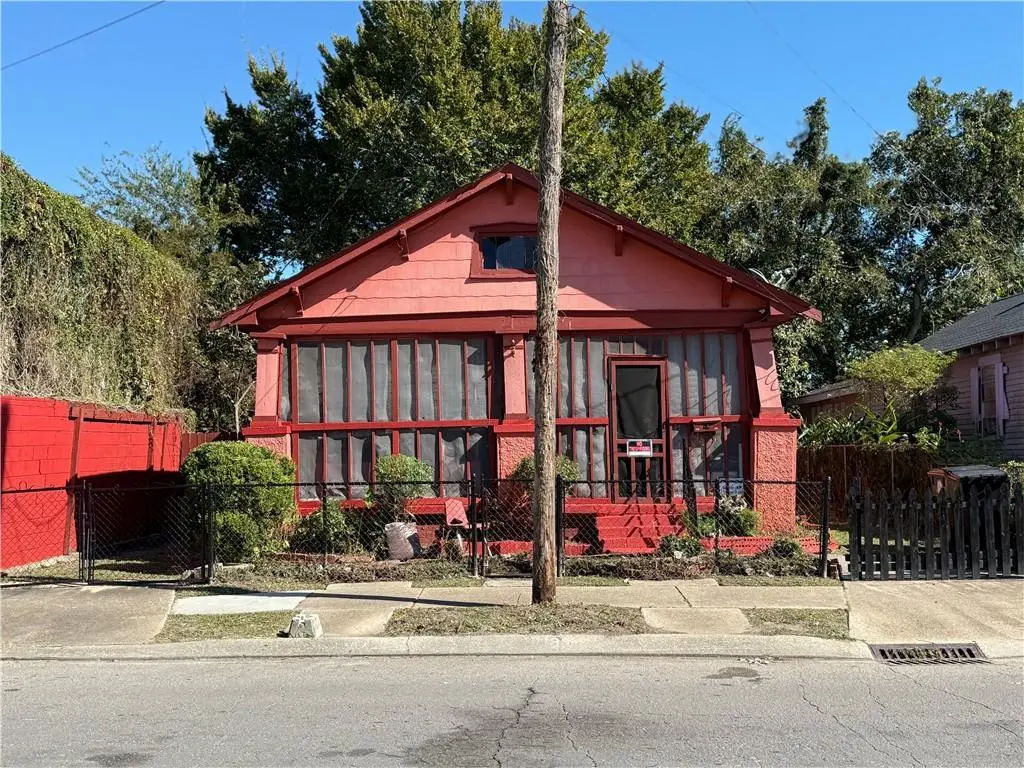
1018 Wagner St · New Orleans, LA
Flood risk 8/10 · Major
- FEMA flood zone
- X
- Chance of flooding over 30 yrs
- 0.99%
- Est. flood insurance / yr
- $507 – $1,088
Fire risk 1/10 · Minimal
- Est. fire insurance / yr
- $1,269 – $2,357
Heat risk 10/10 · Severe
- Hot days now (above 108°F)
- 7 days/yr
- Hot days in 30 yrs
- 21 days/yr
Wind risk 10/10 · Severe
- Chance of severe wind over 30 yrs
- 99.0%
Air-quality risk 2/10 · Minimal
- Unhealthy air days now
- 2 days/yr
- Unhealthy air days in 30 yrs
- 2 days/yr
Risk factors via First Street. Map © Google.
Why this score? — see what drove the B- grade
The composite is a weighted blend of 9 inputs, each scored 0–100. Each bar is that input's sub-score; the figure is the points it added to the 100-point composite (weight × sub-score).
- Cash flow +26.1/30.0
- ARV discount +15.0/15.0
- DSCR +8.8/10.0
- 1% rule +7.0/10.0
- Livability +4.0/5.0
- Condition / age +2.5/5.0
- Rent growth +2.3/5.0
- Schools +1.6/10.0
- Appreciation +0.0/10.0
$135,000
🖨 Deal sheet 📄 Offer letter ✓ Due diligence
Listing remarks MLS
Excellent Opportunity in Algiers! This property offers exceptional potential for homeowners or investors alike. With a little TLC, this home can be transformed into a true gem. Ideally located just minutes from the Algiers Ferry, shopping centers, malls, and a variety of dining options. Don't miss the opportunity to make this well-situated property your next home or renovation project.
Key facts
- Ideally located
- 5,501 sq ft lot
- Built 1938
Tags
Neighborhood map
What this means for you Summary
Snapshot
- This is a 2-bed/1.0-bath single-family listed at $135k.
Deal economics
- At list price, monthly cash flow is $276 ($3k/yr) — positive.
- The deal already cash-flows at list — no discount required.
- Meets the 1% rule at list price ($2k rent vs $135k).
- Recommended offer: $119k (12.0% below list) — sets the bar for market timing.
- Cap rate 9.3% vs local median 4.4% in New Orleans — top-decile yield for the area; either an underpriced asset or a hidden risk that comps aren't pricing in. Stress-test before assuming the spread holds.
Location & tenants
- Location reads 81/100 on livability (#3 in LA, #1,383 nationally) — a professional / high-income tenant draw. Strengths: amenities A+, commute A+, health & safety A+; Watch: crime C-, employment D.
- Orleans Parish (urban): math 11% / reading 27% proficiency, ranked #69 of 98 in LA (top 70%) — low school quality limits family demand, transient renter base, plan for 1-2y turnover; 68% free/reduced lunch — lower-income household profile, screen leases tightly.
- Market conditions: Rents soft (-0.7%/yr); 265 active listings in the ZIP; 40 comparable units currently listed for rent nearby; rentals at typical pace (median 24d on market — plan ~3-4 weeks tenant-placement turnaround); lower-income renter base — watch delinquency; 710 units permitted in Orleans Parish in 2024 (244 in 5+ unit buildings).
- This rent runs 45% of the median local income ($43k/yr) — at the standard rent-burdened threshold; future hikes will face affordability resistance.
Forward outlook
- Local home prices are declining (-3.0%/yr); year-one equity from $933 of loan paydown is wiped out by about $4k of value loss. Plan a longer hold.
- Orleans County population projected at +61% by 2050 — long-run rental-demand tailwind backs the buy-and-hold thesis.
Negotiation context
- It's been on market 223 days — a 12% lower offer ($119k) is reasonable based on typical stale-listing flexibility.
- 2 sale attempts; this cycle's ask has dropped $10k (7%) from the opening price — seller is motivated, your offer sets the floor, not the list.
Risks & watch-outs
- Watch-outs: flood insurance adds $66/mo; built in 1938 — expect roof / HVAC / electrical / plumbing capex.
- Climate carrying-cost: severe flood risk; severe wind risk, 99% chance of damaging wind over 30y; extreme-heat days projected 7→21/yr by 2055 (HVAC capex compounding) — expect insurance premiums to compound above CPI over the hold.
Questions for the listing agent
- It's been on market 223 days. Have you received any prior offers? Is the seller open to a 12% concession, seller financing, or rate buy-down credit?
- Built in 1938 — when were the roof, HVAC, electrical panel, plumbing, and water heater last replaced?
- What's the actual annual flood-insurance premium (NFIP or private), and is the property in a SFHA with mandatory coverage?
- Why hasn't it sold? Are there any deal-killer items the seller is aware of (foundation, flood, title, zoning, code violations)?
- Is there a deadline driving the sale (1031 exchange, divorce, estate, relocation)? That informs how much negotiation room exists.
- What's the average days-on-market for RENTAL listings here right now (not sales)? A rising rental-DOM trend means longer vacancies and softer asking-rent achievability than the comps imply.
- What's the recent tenant-quality profile in this submarket — average credit score on applications, eviction rate, late-payment / NSF rate, and stable-employment percentage? A property-management company in the area should have these aggregated.
- How much new for-sale + rental construction is in the pipeline within 1–3 miles? Heavy new supply typically softens prices + rents 12–24 months out; constrained supply supports both.
Investment metrics
- 1% rule
- 1.20% ✓
- Cap rate
- 9.34%
- Cash-on-cash
- 10.87%
- DSCR
- 1.48
- GRM
- 7.0
CMA / ARV
- ARV (median comp)
- $168,488
- List price
- $135,000
- Delta
- -19.88%
- Verdict
- UNDERPRICED
- Comps
- 20 within 1.0 mi
Show comp detail 12 sales within ~0.75 mi
| Address | Dist | Beds/Ba | Sqft | Sold | Price | $/sf | Match |
|---|---|---|---|---|---|---|---|
| 1056 Farragut St | 0.37mi | 3/1.0 (+1) | 1,279 (-2%) | 1mo | $85,000 | $66 | 74 |
| 532 Elmira Ave | 0.57mi | 2/2.0 | 1,300 (0%) | 1mo | $350,000 | $269 | 69 |
| 613 Pacific Ave | 0.51mi | 2/1.0 | 1,246 (-4%) | 2mo | $215,000 | $173 | 68 |
| 2024 Lamarque St | 0.26mi | 3/2.0 (+1) | 1,350 (+4%) | 6mo | $151,500 | $112 | 67 |
| 1327 Shirley Dr | 0.53mi | 3/2.0 (+1) | 1,274 (-2%) | 6mo | $70,000 | $55 | 58 |
| 1513 Shirley Dr | 0.65mi | 3/1.0 (+1) | 1,341 (+3%) | 2mo | $185,000 | $138 | 58 |
| 1410 Hendee St | 0.30mi | 3/2.5 (+1) | 1,150 (-12%) | 0mo | $90,000 | $78 | 56 |
| 1623 Shirley Dr | 0.75mi | 2/2.0 | 1,275 (-2%) | 8mo | $70,000 | $55 | 51 |
| 1509 Shirley Dr | 0.64mi | 2/1.5 | 1,482 (+14%) | 2mo | $45,000 | $30 | 43 |
| 250 Wagner St | 0.57mi | 3/2.0 (+1) | 1,174 (-10%) | 7mo | $212,000 | $181 | 42 |
| 926 Verret St | 0.62mi | 3/2.0 (+1) | 1,431 (+10%) | 6mo | $230,000 | $161 | 40 |
| 717 Nunez St | 0.75mi | 2/2.0 | 1,453 (+12%) | 6mo | $350,000 | $241 | 36 |
Match score weights: distance 35% · size 25% · config 20% · recency 20%. Top-matched comps best support the ARV.
Projected returns pro-forma
-3.0% appreciation · 0.0% rent growth · sell at horizon
- IRR
- -6.6%
- Equity multiple
- 0.76×
- Total profit
- $-8,973
- Equity at exit
- $20,129
- IRR
- -1.4%
- Equity multiple
- 0.92×
- Total profit
- $-3,209
- Equity at exit
- $11,672
Cash invested: $37,800 (down + closing). Projections, not guarantees.
Landlord ↔ Tenant lean methodology
- Overall (STATE)
- 90 Strongly Landlord-Friendly
- State Louisiana
- 90 Strongly Landlord-Friendly · R+12
- County
- — inherits STATE
- City
- — inherits STATE
ZIP-level market 70114
- Rents YoY
- -0.7%
- Active inventory
- 265
- Price-to-rent
- 7.0×
Monthly cashflow live
- Estimated rent
- $1,614 high interval (Pro) →
- Mortgage (P&I)
- −$708
- Tax est. 1.5%
- −$169 /mo · $2,025/yr
- Insurance
- −$56
- Flood insurance flood zone
- −$66 /mo · $798/yr
- HOA
- −$0
- Vacancy / Maint / Mgmt
- −$339
- Net cashflow
- $276
Break-even live
UW: 25.0% down · 7.5% · 30yr · 1.5% tax · 5.0% vac · 8.0% maint · 8.0% mgmt
Financing live
Cash to close
- Down payment
- $33,750
- Closing costs
- $4,050
- Reserves months
- —
- Total cash needed
- —
Loan-product check · same deal, 3 products live
Conventional
25% down · 7.5% · 30yr
- Down + closing
- —
- Monthly P&I
- —
- Monthly cashflow
- —
- DSCR
- —
- Eligible?
- —
Personal DTI + credit; lowest rate.
DSCR
20% down · 8.5% · 30yr
- Down + closing
- —
- Monthly P&I
- —
- Monthly cashflow
- —
- DSCR
- —
- Eligible?
- —
No personal income docs; deal must DSCR.
Hard money
10% down · 12.0% · 12mo
- Down + closing
- —
- Monthly P&I
- —
- Monthly cashflow
- —
- DSCR
- —
- Eligible?
- —
Short-term bridge; refi at stabilization.
Rent comps 40 comps
| Address | Beds | Baths | Sqft | Rent | $/sqft | DOM | Units | Dist |
|---|---|---|---|---|---|---|---|---|
| 810 Whitney Ave New Orleans, LA | 2.0 | 1.0 | 900 | $1,250 | $1.39 | 11d | 1 | 0.14mi |
| 807 Whitney Ave Unit 1 New Orleans, LA | 3.0 | 2.0 | 1262 | $1,500 | $1.19 | 3d | 1 | 0.15mi |
| 1108 Sumner St New Orleans, LA | 3.0 | 1.5 | 1197 | $1,500 | $1.25 | 11d | 1 | 0.17mi |
| 740 Thayer Unit 2A New Orleans, LA | 2.0 | 2.0 | 950 | $1,350 | $1.42 | 23d | 1 | 0.24mi |
| 701 Behrman Ave New Orleans, LA | 3.0 | 2.0 | 1368 | $2,300 | $1.68 | 3d | 1 | 0.28mi |
| 1414 Sumner St New Orleans, LA | 3.0 | 2.0 | 1800 | $1,450 | $0.81 | 16d | 1 | 0.34mi |
| 1402 Behrman Ave New Orleans, LA | 2.0 | 1.0 | 1673 | $1,500 | $0.90 | 23d | 1 | 0.36mi |
| 1418 Behrman Ave New Orleans, LA | 2.0 | 1.0 | 876 | $1,400 | $1.60 | 16d | 1 | 0.38mi |
| 1510 Sumner St New Orleans, LA | 2.0 | 1.0 | 950 | $1,474 | $1.55 | 16d | 1 | 0.40mi |
| 543 Atlantic Ave New Orleans, LA | 2.0 | 2.5 | 1430 | $2,200 | $1.54 | 23d | 1 | 0.46mi |
| 527 Atlantic Ave New Orleans, LA | 3.0 | 2.0 | 1800 | $2,050 | $1.14 | 23d | 1 | 0.48mi |
| 540 Pacific Ave New Orleans, LA | 1.0 | 1.0 | 900 | $1,200 | $1.33 | 23d | 1 | 0.48mi |
| 335 Whitney Ave New Orleans, LA | 2.0 | 1.0 | 1100 | $1,575 | $1.43 | 23d | 1 | 0.49mi |
| 718 Majestic Pl New Orleans, LA | 3.0 | 2.0 | 1164 | $1,785 | $1.53 | 21d | 1 | 0.49mi |
| 606 Drum St New Orleans, LA | 3.0 | 2.0 | 1131 | $2,350 | $2.08 | 23d | 1 | 0.58mi |
| 724 Evelina St Unit B New Orleans, LA | 2.0 | 1.0 | 1000 | $1,600 | $1.60 | 17d | 1 | 0.61mi |
| 620 Opelousas Ave Unit 103 New Orleans, LA | 2.0 | 1.5 | 1000 | $1,650 | $1.65 | 3d | 1 | 0.63mi |
| 507 Newton St New Orleans, LA | 2.0 | 2.0 | 1150 | $1,400 | $1.22 | 23d | 1 | 0.64mi |
| 336 Elmira Ave New Orleans, LA | 3.0 | 1.0 | 1250 | $1,825 | $1.46 | 23d | 1 | 0.65mi |
| 1625 Lauradale Dr New Orleans, LA | 3.0 | 2.0 | 1029 | $1,700 | $1.65 | 3d | 1 | 0.65mi |
| 325 Elmira Ave Unit 325 New Orleans, LA | 3.0 | 1.5 | 1050 | $1,525 | $1.45 | 23d | 1 | 0.68mi |
| 435 Homer St New Orleans, LA | 1.0 | 1.0 | 950 | $1,100 | $1.16 | 23d | 1 | 0.68mi |
| 513 Park Blvd New Orleans, LA | 3.0 | 2.0 | 1600 | $2,300 | $1.44 | 3d | 1 | 0.70mi |
| 329 Belleville St New Orleans, LA | 2.0 | 1.0 | 1014 | $1,500 | $1.48 | 23d | 1 | 0.71mi |
| 1140 Teche St Apt B New Orleans, LA | 3.0 | 1.0 | 1100 | $1,850 | $1.68 | 23d | 1 | 0.72mi |
| 1136 Brooklyn Ave New Orleans, LA | 3.0 | 1.0 | 913 | $1,600 | $1.75 | 23d | 1 | 0.79mi |
| 119 Vallette St New Orleans, LA | 3.0 | 2.5 | 1500 | $2,100 | $1.40 | 23d | 1 | 0.86mi |
| 519 Bouny St New Orleans, LA | 2.0 | 1.0 | 950 | $1,400 | $1.47 | 23d | 1 | 0.87mi |
| 521 Bouny St New Orleans, LA | 2.0 | 1.0 | 950 | $1,400 | $1.47 | 23d | 1 | 0.88mi |
| 500 Powder St Unit B New Orleans, LA | 2.0 | 1.0 | 1085 | $1,600 | $1.47 | 23d | 1 | 0.91mi |
| 1200 Southlawn Blvd New Orleans, LA | 3.0 | 2.0 | 950 | $1,725 | $1.82 | 23d | 1 | 0.92mi |
| 311 Delaronde St New Orleans, LA | 2.0 | 1.0 | 1120 | $1,740 | $1.55 | 23d | 1 | 0.95mi |
| 1719 Pace Blvd New Orleans, LA | 3.0 | 1.0 | 1178 | $2,000 | $1.70 | 11d | 1 | 0.98mi |
| 1622 Jo Ann Pl New Orleans, LA | 3.0 | 1.5 | 1301 | $1,500 | $1.15 | 2d | 1 | 1.00mi |
| 1565 Murl St Unit B New Orleans, LA | 2.0 | 2.0 | 1100 | $1,100 | $1.00 | 23d | 1 | 1.02mi |
| 323 Morgan St Unit G New Orleans, LA | 2.0 | 2.5 | 1700 | $2,500 | $1.47 | 43d | 1 | 1.02mi |
| 1010 Isbell St Gretna, LA | 3.0 | 1.0 | 1300 | $1,350 | $1.04 | 43d | 1 | 1.06mi |
| 3000 Americus St New Orleans, LA | 3.0 | 2.0 | 1280 | $1,400 | $1.09 | 23d | 1 | 1.09mi |
| 3102 Lawrence St New Orleans, LA | 2.0 | 1.0 | 950 | $1,500 | $1.58 | 23d | 1 | 1.10mi |
| 623 France St New Orleans, LA | 2.0 | 2.0 | 982 | $2,600 | $2.65 | 43d | 1 | 1.12mi |
Listing history 18 events
-
2026-06-18days on market $135,000 Active 223 DOM
-
2026-06-17days on market $135,000 Active 222 DOM
-
2026-06-16days on market $135,000 Active 221 DOM
-
2026-06-15days on market $135,000 Active 220 DOM
-
2026-06-13days on market $135,000 Active 218 DOM
-
2026-06-10days on market $135,000 Active 215 DOM
-
2026-06-09days on market $135,000 Active 214 DOM
-
2026-06-08days on market $135,000 Active 213 DOM
-
2026-06-07days on market $135,000 Active 212 DOM
-
2026-06-05days on market $135,000 Active 209 DOM
-
2026-06-03days on market $135,000 Active 208 DOM
-
2026-06-02days on market $135,000 Active 207 DOM
-
2026-06-01days on market $135,000 Active 206 DOM
-
2026-05-31days on market $135,000 Active 205 DOM
-
2026-03-19price $135,000 388-char remark
Show marketing remark (394 chars)
Excellent Opportunity in Algiers! This property offers exceptional potential for homeowners or investors alike. With a little TLC, this home can be transformed into a true gem. Ideally located just minutes from the Algiers Ferry, shopping centers, malls, and a variety of dining options. Don’t miss the opportunity to make this well-situated property your next home or renovation project.
-
2026-03-19price $135,000 394-char remark
Show marketing remark (394 chars)
Excellent Opportunity in Algiers! This property offers exceptional potential for homeowners or investors alike. With a little TLC, this home can be transformed into a true gem. Ideally located just minutes from the Algiers Ferry, shopping centers, malls, and a variety of dining options. Don’t miss the opportunity to make this well-situated property your next home or renovation project.
-
2025-11-07$145,000 Active 388-char remark
Show marketing remark (394 chars)
Excellent Opportunity in Algiers! This property offers exceptional potential for homeowners or investors alike. With a little TLC, this home can be transformed into a true gem. Ideally located just minutes from the Algiers Ferry, shopping centers, malls, and a variety of dining options. Don’t miss the opportunity to make this well-situated property your next home or renovation project.
-
2025-11-07$145,000 Active 394-char remark
Show marketing remark (394 chars)
Excellent Opportunity in Algiers! This property offers exceptional potential for homeowners or investors alike. With a little TLC, this home can be transformed into a true gem. Ideally located just minutes from the Algiers Ferry, shopping centers, malls, and a variety of dining options. Don’t miss the opportunity to make this well-situated property your next home or renovation project.
ⓘ Source: listings_history table (triggers on properties + properties_extension) + one-shot
backfill from property_details.listing_events for pre-trigger history.
Climate risk First Street
- Flood 8/10 Severe FEMA zone X · 99% chance over 30 yrs
- Wildfire 1/10 Low
- Heat 10/10 Extreme 7 d/yr ≥108°F today · 21 d/yr by 30 yrs out
- Wind 10/10 Extreme 99% chance of damaging wind over 30 yrs
- Air quality 2/10 Low 2 unhealthy d/yr today · 2 by 30 yrs out
Nearby sold comps map
Loading sold comps map…
Walkable amenities ~0.75 mi
Loading nearby amenities…
Taxation est. · year 1
- Rental income
- $19,371
- − Mortgage interest
- −$7,562
- − Property taxes
- −$2,025
- − Insurance
- −$1,472
- − Repairs & maintenance
- −$1,550
- − Management
- −$1,550
- − Depreciation
- −$3,927
- Taxable income
- $1,285
- Est. tax owed @ 24.0%
- −$308
- After-tax cash flow
- $3,002/yr
For passive investors: Depreciation is non-cash, so a rental often shows a tax loss while cash-flowing — sheltering income. Rental losses are passive: they offset passive income freely, and up to $25,000/yr can offset ordinary (W-2) income if you actively participate and your MAGI is under $100k (phasing out to $0 by $150k); unused losses carry forward. On sale, claimed depreciation is recaptured at up to 25%, and gains may owe capital-gains tax (a 1031 exchange can defer both). Figures are a year-1 estimate at your 24.0% rate — not tax advice; consult a CPA.
Schools (NCES district)
- District
- Orleans Parish
- NCES district ID
- 2201170
- Math proficiency
- 11% ▼ -52.00%
- Reading proficiency
- 27% ▼ -46.00%
- Median HH income
- $37,011
- Composite
- 15.78/100
- National rank
- #9271
- State rank
- #69 of 98 in LA
Livability — New Orleans
- Score
- 81/100
- State rank
- #3
- US rank
- #1383
Category grades
Schools grade is shown separately in the Schools card above.
Census & demographics
- Census place
- New Orleans, LA
- County
- Orleans Parish · 338,817 people
- City population
- 338,817
- Metro
- New Orleans-Metairie, LA
- Population (ZIP)
- 22,659
- Household income
- $43,493
- Rent vs Own
- Severe rent burden
- 2240.0
Population outlook (Orleans County) Hauer SSP2
- Today (2025)
- 513,025 people
- By 2030
- 575,781 · +12.2%
- By 2040
- 700,174 · +36.5%
- By 2050
- 826,541 · +61.1%
- By 2075
- 1,123,374 · +119.0%
- By 2100
- 1,355,609 · +164.2%
Race, ethnicity, and origin ACS 2023
- Neighborhood character
- Predominantly Black (72%)
- Race & ethnicity
- Black 72% White 16% Hispanic / Latino 8% Two or more races 5%
- Hispanic origin (detail)
- Mexican 2% Puerto Rican 1%
- Common ancestry
- Lithuanian 3% Slovak 1% Italian 1%
- Foreign-born
- 5% · Canada
- Languages at home
- 91% English-only · Spanish 6% French/Haitian/Cajun 2% Other Indo-European 1%
Political lean MEDSL · Orleans
- 2024 margin
- Solid D (+67.0) · D 82.2% · R 15.2% · Other 2.7%
- 2008→2024 swing
- +6.7pp toward D · 2008: 60.3pp · 2024: 67.0pp
- All cycles
- 2024: D+67.0 2020: D+68.2 2016: D+66.2 2012: D+62.5 2008: D+60.3
Not yet ingested
- Civics
- —
Market trends
- HPI YoY
- ▼ -98.56%
- Current HPI
- 149.0172
- Rent YoY
- ▼ -0.72%
- Metro
- New Orleans-Metairie, LA
- State GDP YoY
- ▲ 3.29%
- F500 in state
- 10
Industry mix (Fortune 500 HQ in LA)
| Industry | F500 HQs | Revenue |
|---|---|---|
| Telecommunications | 2 | $23B |
|
||
| Utilities | 1 | $12B |
|
||
| Wholesale / Distribution | 1 | $5B |
|
||
| Advertising | 1 | $2B |
|
||
Price history
-6.9% since first listed4 events — show timeline
- 2026-03-19 Price Changed $135,000 AcadianaMLS
- 2026-03-19 Price Changed $135,000 GSREIN
- 2025-11-07 Listed $145,000 GSREIN
- 2025-11-07 Listed $145,000 AcadianaMLS
Property tax history
-0.3%/yrLatest (2026): $31 · -12.5% YoY. Source: county tax records.
Cash-flow waterfall
monthlySold comps — $/sqft
last 12 mo · ≤1 miLoading sold comps…