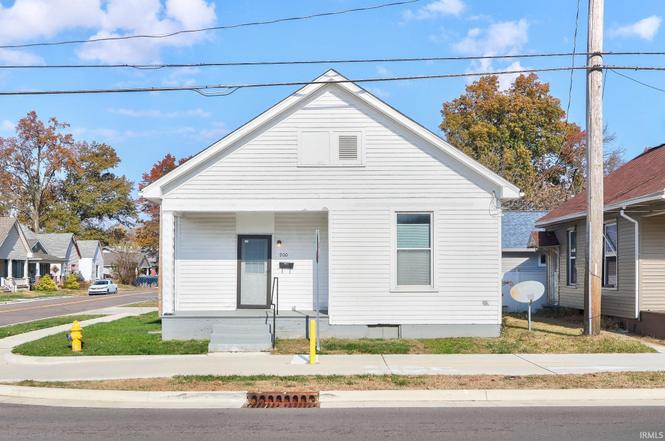
900 E Walnut St · Evansville, IN
Flood risk 4/10 · Minor
- FEMA flood zone
- X (unshaded)
- Chance of flooding over 30 yrs
- 0.22%
- Est. flood insurance / yr
- $473 – $860
Fire risk 1/10 · Minimal
- Est. fire insurance / yr
- $717 – $1,331
Heat risk 5/10 · Moderate
- Hot days now (above 107°F)
- 7 days/yr
- Hot days in 30 yrs
- 19 days/yr
Wind risk 2/10 · Minimal
- Chance of severe wind over 30 yrs
- 3.0%
Air-quality risk 3/10 · Minor
- Unhealthy air days now
- 3 days/yr
- Unhealthy air days in 30 yrs
- 4 days/yr
Risk factors via First Street. Map © Google.
Why this score? — see what drove the B- grade
The composite is a weighted blend of 9 inputs, each scored 0–100. Each bar is that input's sub-score; the figure is the points it added to the 100-point composite (weight × sub-score).
- Cash flow +30.0/30.0
- DSCR +10.0/10.0
- 1% rule +9.1/10.0
- ARV discount +5.4/15.0
- Rent growth +5.0/5.0
- Schools +3.3/10.0
- Livability +3.2/5.0
- Condition / age +2.5/5.0
- Appreciation +0.0/10.0
$73,000
🖨 Deal sheet (PDF) 📄 Offer letter ✓ Due diligence
Listing remarks
Welcome home to this move-in-ready 2 bed, 1 bath charmer featuring tall ceilings and original hardwood floors that add warmth throughout. A covered front porch leads you into a bright, spacious living room, and the eat-in kitchen offers tile flooring, a handy pantry, and an in-kitchen washer and dryer. Both bedrooms are comfortably sized, and the bathroom is well-appointed with matching tile. Additional storage is available in the partial unfinished basement. Outside, the low-maintenance yard keeps upkeep easy. Set along the new bike trails and right across from a freshly built playground, this home offers a convenient location with plenty to enjoy nearby.
Key facts
- Covered front porch
- Low-maintenance yard
- Handy pantry
Tags
Property features AI
Finance
- Other: Listing broker: Dauby Real Estate
Exterior
- Parking: No parking details provided
- Utilities: Public water; Public sewer
- Home design: Single-family residence (site-built); 1 story
- Construction: Vinyl siding; Foundation: brick/mortar and block
- Exterior features: Covered porch; Partial chain link fencing; Corner, level lot; Lot dimensions 41 x 36
Interior
- Kitchen: Eat-in kitchen; Laminate counters
- Bedrooms: Total rooms: 4
- Flooring: Hardwood; Tile
- Bathrooms: 1 full bathroom (main level)
- Heating & cooling: Forced air heating; Central air conditioning; Ceiling fans
- Interior features: Ceiling fans; Eat-in kitchen; Laminate countertops
- Laundry & utility: Laundry on main level; Basement: crawl space, partial, unfinished
Neighborhood map
What this means for you Summary
Snapshot
- This is a 2-bed/1.0-bath single-family listed at $73k.
Deal economics
- At list price, monthly cash flow is $350 ($4k/yr) — positive.
- The deal already cash-flows at list — no discount required.
- Meets the 1% rule at list price ($1k rent vs $73k).
- Recommended offer: $64k (12.0% below list) — sets the bar for market timing.
- Cap rate 12.0% vs local median 4.6% in Evansville — top-decile yield for the area; either an underpriced asset or a hidden risk that comps aren't pricing in. Stress-test before assuming the spread holds.
Location & tenants
- Location reads 63/100 on livability (#416 in IN) — a middle-class / working-renter tenant base. Strengths: cost of living A+, housing A+, health & safety A+; Watch: crime F, commute F, employment D-.
- Evansville Vanderburgh School Corporation (urban): math 36% / reading 43% proficiency, ranked #153 of 301 in IN (top 51%) — families likely to look elsewhere, expect single-tenant / working-renter base with shorter leases.
- Zoned schools: Fairlawn Elementary School (math 22% / reading 22%, grade F, #790 of 994 statewide, top 81%, 422 students, 76% FRL); Mcgary Middle School (math 8% / reading 15%, grade F, #311 of 330 statewide, top 94%, 351 students, 81% FRL); William Henry Harrison High School (math 29% / reading 54%, grade F, #211 of 369 statewide, top 58%, 1,158 students, 61% FRL) — zoned schools average 72% FRL vs 50% district-wide (23 pts higher); higher-poverty schools than district average — tighter screening recommended.
- Zoned-school proficiency averages 25% at this address vs 40% district-wide (-14 pts) — the specific schools serving this property underperform the Evansville Vanderburgh School Corporation average; the district grade overstates school quality for this exact location.
- Market conditions: Rents rising fast (+9.9%/yr); 118 active listings in the ZIP; 40 comparable units currently listed for rent nearby; rentals at typical pace (median 22d on market — plan ~3-4 weeks tenant-placement turnaround); lower-income renter base — watch delinquency; 508 units permitted in Vanderburgh County in 2024 (32 in 5+ unit buildings).
- This rent runs 30% of the median local income ($41k/yr) — at the standard rent-burdened threshold; future hikes will face affordability resistance.
Forward outlook
- Local home prices are declining (-3.0%/yr); year-one equity from $505 of loan paydown is wiped out by about $2k of value loss. Plan a longer hold.
- At projected returns (-3.0% appreciation + 8.0% rent growth), your $20k cash investment doubles in ~5 years — after that, you're playing with house money.
Negotiation context
- It's been on market 170 days — a 12% lower offer ($64k) is reasonable based on typical stale-listing flexibility.
- 2 sale attempts; this cycle's ask has dropped $32k (30%) from the opening price — seller is motivated, your offer sets the floor, not the list.
Risks & watch-outs
- Watch-outs: built in 1901 — expect roof / HVAC / electrical / plumbing capex.
- Climate carrying-cost: extreme-heat days projected 7→19/yr by 2055 (HVAC capex compounding) — expect insurance premiums to compound above CPI over the hold.
Questions for the listing agent
- It's been on market 170 days. Have you received any prior offers? Is the seller open to a 12% concession, seller financing, or rate buy-down credit?
- Built in 1901 — when were the roof, HVAC, electrical panel, plumbing, and water heater last replaced?
- Why hasn't it sold? Are there any deal-killer items the seller is aware of (foundation, flood, title, zoning, code violations)?
- Is there a deadline driving the sale (1031 exchange, divorce, estate, relocation)? That informs how much negotiation room exists.
- Schools are D-rated, which usually means shorter tenancies and higher turnover. Who's the typical renter profile here, and what's been the actual vacancy rate?
- Crime grade is F in this area — have there been break-ins, vandalism, or insurance claims at this property in the last 3 years? What carrier currently insures it and at what premium?
- What's the average days-on-market for RENTAL listings here right now (not sales)? A rising rental-DOM trend means longer vacancies and softer asking-rent achievability than the comps imply.
- What's the recent tenant-quality profile in this submarket — average credit score on applications, eviction rate, late-payment / NSF rate, and stable-employment percentage? A property-management company in the area should have these aggregated.
- How much new for-sale + rental construction is in the pipeline within 1–3 miles? Heavy new supply typically softens prices + rents 12–24 months out; constrained supply supports both.
Investment metrics
- 1% rule
- 1.41% ✓
- Cap rate
- 12.04%
- Cash-on-cash
- 20.54%
- DSCR
- 1.91
- GRM
- 5.9
CMA / ARV
- ARV (on-the-fly)
- $69,720
- Comps found
- 12
Show comp detail 12 sales within ~0.75 mi
| Address | Dist | Beds/Ba | Sqft | Sold | Price | $/sf | Match |
|---|---|---|---|---|---|---|---|
| 1152 E Chandler Ave | 0.63mi | 3/1.0 (+1) | 825 (-2%) | 4mo | $127,000 | $154 | 60 |
| 1136 E Chandler Ave | 0.61mi | 3/1.0 (+1) | 825 (-2%) | 9mo | $128,899 | $156 | 56 |
| 1133 E Chandler Ave | 0.64mi | 2/1.0 | 864 (+3%) | 12mo | $55,000 | $64 | 55 |
| 1116 E Chandler Ave | 0.60mi | 2/1.0 | 796 (-5%) | 12mo | $66,000 | $83 | 53 |
| 1237 E Illinois St | 0.54mi | 2/1.0 | 906 (+8%) | 12mo | $107,000 | $118 | 52 |
| 1308 E Walnut St | 0.45mi | 2/1.0 | 964 (+15%) | 7mo | $54,000 | $56 | 49 |
| 717 E Iowa St | 0.67mi | 2/1.0 | 768 (-9%) | 7mo | $31,700 | $41 | 48 |
| 1520 E Indiana St | 0.75mi | 2/1.0 | 800 (-5%) | 12mo | $123,000 | $154 | 47 |
| 1303 E Indiana St | 0.55mi | 2/1.0 | 962 (+14%) | 5mo | $22,000 | $23 | 46 |
| 520 Bayard Park Dr | 0.64mi | 2/1.0 | 752 (-10%) | 12mo | $115,000 | $153 | 43 |
| 1117 E Chandler Ave | 0.63mi | 2/1.0 | 732 (-13%) | 12mo | $52,500 | $72 | 39 |
| 1109 E Chandler Ave | 0.62mi | 2/1.0 | 720 (-14%) | 12mo | $52,500 | $73 | 37 |
Match score weights: distance 35% · size 25% · config 20% · recency 20%. Top-matched comps best support the ARV.
Projected returns pro-forma
-3.0% appreciation · 8.0% rent growth · sell at horizon
- IRR
- 18.1%
- Equity multiple
- 1.78×
- Total profit
- $15,892
- Equity at exit
- $10,885
- IRR
- 29.7%
- Equity multiple
- 4.29×
- Total profit
- $67,281
- Equity at exit
- $6,312
Cash invested: $20,440 (down + closing). Projections, not guarantees.
Landlord ↔ Tenant lean methodology
- Overall (STATE)
- 90 Strongly Landlord-Friendly
- State Indiana
- 90 Strongly Landlord-Friendly · R+11
- County
- — inherits STATE
- City
- — inherits STATE
ZIP-level market 47713
- Home prices YoY
- -34.1%
- Rents YoY
- 9.9%
- Active inventory
- 118
- Price-to-rent
- 5.9×
Monthly cashflow live
- Estimated rent
- $1,030 high interval (Pro) →
- Mortgage (P&I)
- −$383
- Tax from tax record
- −$51 /mo · $611/yr
- Insurance
- −$30
- HOA
- −$0
- Vacancy / Maint / Mgmt
- −$216
- Net cashflow
- $350
Break-even live
Sensitivity live
| Price | -10% $391 | -5% $371 | +0% $350 | +5% $329 | +10% $309 |
|---|---|---|---|---|---|
| Rent | -10% $268 | -5% $309 | +0% $350 | +5% $391 | +10% $431 |
| Rate | -1.0pp $387 | -0.5pp $368 | base $350 | +0.5pp $331 | +1.0pp $312 |
UW: 25.0% down · 7.5% · 30yr · 1.5% tax · 5.0% vac · 8.0% maint · 8.0% mgmt
Financing live
Cash to close
- Down payment
- $18,250
- Closing costs
- $2,190
- Reserves months
- —
- Total cash needed
- —
Loan-product check · same deal, 3 products live
Conventional
25% down · 7.5% · 30yr
- Down + closing
- —
- Monthly P&I
- —
- Monthly cashflow
- —
- DSCR
- —
- Eligible?
- —
Personal DTI + credit; lowest rate.
DSCR
20% down · 8.5% · 30yr
- Down + closing
- —
- Monthly P&I
- —
- Monthly cashflow
- —
- DSCR
- —
- Eligible?
- —
No personal income docs; deal must DSCR.
Hard money
10% down · 12.0% · 12mo
- Down + closing
- —
- Monthly P&I
- —
- Monthly cashflow
- —
- DSCR
- —
- Eligible?
- —
Short-term bridge; refi at stabilization.
Rent comps 40 comps
| Address | Beds | Baths | Sqft | Rent | $/sqft | DOM | Units | Dist |
|---|---|---|---|---|---|---|---|---|
| 304 S Grand Ave Evansville, IN | 2.0 | 1.0 | 967 | $955 | $0.99 | 22d | 1 | 0.02mi |
| 507 S Evans Ave Evansville, IN | 2.0 | 1.0 | 750 | $795 | $1.06 | 22d | 1 | 0.27mi |
| 1303 E Indiana St Evansville, IN | 2.0 | 1.0 | 975 | $1,195 | $1.23 | 14d | 1 | 0.54mi |
| 734 Bayard Park Dr Evansville, IN | 3.0 | 2.0 | 1000 | $1,425 | $1.43 | 22d | 1 | 0.55mi |
| 1321 E Indiana St Evansville, IN | 2.0 | 1.0 | 964 | $1,050 | $1.09 | 14d | 1 | 0.57mi |
| 1133 Bayard Park Dr Unit B Evansville, IN | 2.0 | 1.0 | 990 | $800 | $0.81 | 22d | 1 | 0.61mi |
| 1440 E Division St Evansville, IN | 2.0 | 1.0 | 689 | $1,250 | $1.81 | 14d | 1 | 0.67mi |
| 1415 E Indiana St Evansville, IN | 2.0 | 1.0 | 814 | $795 | $0.98 | 14d | 1 | 0.67mi |
| 1021 Jefferson Ave Evansville, IN | 1.0 | 1.0 | 798 | $795 | $1.00 | 14d | 1 | 0.91mi |
| 1680 E Franklin St #1682 Evansville, IN | 2.0 | 1.0 | 675 | $855 | $1.27 | 22d | 7 | 0.93mi |
| 827 Judson St Evansville, IN | 3.0 | 1.0 | 1008 | $1,295 | $1.28 | 14d | 1 | 0.94mi |
| 200 N Main St Evansville, IN | 2.0 | 1.0–2.0 | 857 | $1,599 | $1.86 | 14d | 7 | 0.95mi |
| 41 W Division St Unit 101 Evansville, IN | 1.0 | 1.0 | 634 | $1,100 | $1.74 | 22d | 1 | 0.95mi |
| 41 W Division St Apt 200 Evansville, IN | 2.0 | 2.0 | 1083 | $1,500 | $1.39 | 22d | 1 | 0.95mi |
| 605 Madison Ave Evansville, IN | 2.0 | 1.0 | 1069 | $1,375 | $1.29 | 22d | 1 | 1.03mi |
| 610 N Main St Evansville, IN | 2.0 | 1.0 | 751 | $675 | $0.90 | 22d | 1 | 1.04mi |
| 924 SE 6th St Unit A Evansville, IN | 1.0 | 1.0 | 800 | $875 | $1.09 | 22d | 1 | 1.06mi |
| 210 S Weinbach Ave Evansville, IN | 3.0 | 1.0 | 1080 | $1,450 | $1.34 | 22d | 1 | 1.09mi |
| 8 E Blackford Ave Evansville, IN | 1.0 | 1.0 | 750 | $825 | $1.10 | 22d | 1 | 1.14mi |
| 24 NW 6th St Apt 103 Evansville, IN | 1.0 | 1.0 | 706 | $1,300 | $1.84 | 22d | 1 | 1.14mi |
| 706 Court St Evansville, IN | 2.0 | 1.5 | 1100 | $850 | $0.77 | 22d | 1 | 1.14mi |
| 17 Washington Ave Evansville, IN | 2.0 | 1.0 | 882 | $1,455 | $1.65 | 22d | 1 | 1.18mi |
| 615 SE 3rd St Unit D Evansville, IN | 1.0 | 1.0 | 1122 | $895 | $0.80 | 22d | 1 | 1.19mi |
| 329 Main St Evansville, IN | 1.0–2.0 | 1.0–2.0 | 717 | $1,505 | $2.10 | 14d | 1 | 1.22mi |
| 1500 S Harlan Ave Evansville, IN | 2.0 | 1.0 | 712 | $900 | $1.26 | 14d | 1 | 1.22mi |
| 1231 Culver Dr Unit C Evansville, IN | 1.0 | 1.0 | 575 | $625 | $1.09 | 22d | 1 | 1.26mi |
| 300 Main St Unit 1 D3 Evansville, IN | 1.0 | 1.0 | 800 | $2,000 | $2.50 | 22d | 1 | 1.28mi |
| 1505 Jackson Ave Evansville, IN | 2.0 | 1.0 | 780 | $995 | $1.28 | 22d | 1 | 1.29mi |
| 1018 Baker Ave Unit B Evansville, IN | 1.0 | 1.0 | 800 | $625 | $0.78 | 22d | 1 | 1.30mi |
| 400 NW 5th St Unit 4 Evansville, IN | 2.0 | 1.0 | 792 | $725 | $0.92 | 22d | 1 | 1.31mi |
| 322 SE 1st St Evansville, IN | 1.0–2.0 | 1.0 | 1100 | $1,700 | $1.55 | 22d | 6 | 1.33mi |
| 101 SE 2nd St Evansville, IN | 1.0 | 1.0 | 530 | $750 | $1.42 | 14d | 1 | 1.34mi |
| 202 SE 1st St Evansville, IN | 1.0–2.0 | 1.0 | 926 | $2,449 | $2.64 | 22d | 4 | 1.35mi |
| 406 Edgar St Unit 1 Evansville, IN | 1.0 | 1.0 | 530 | $1,500 | $2.83 | 22d | 1 | 1.36mi |
| 109 E Eichel Ave Unit A Evansville, IN | 1.0 | 1.0 | 675 | $745 | $1.10 | 22d | 1 | 1.36mi |
| 100 SE 1st St Evansville, IN | 1.0–2.0 | 1.0–2.0 | 715 | $1,725 | $2.41 | 14d | 17 | 1.37mi |
| 1421 SE 2nd St Unit A Evansville, IN | 1.0 | 1.0 | 800 | $695 | $0.87 | 14d | 1 | 1.38mi |
| 32 W Tennessee St Evansville, IN | 2.0 | 1.0 | 864 | $925 | $1.07 | 14d | 1 | 1.43mi |
| 715 E Riverside Dr Evansville, IN | 2.0 | 1.0 | 806 | $895 | $1.11 | 22d | 1 | 1.43mi |
| 2151 E Columbia St #2193 Evansville, IN | 1.0 | 1.0 | 600 | $695 | $1.16 | 14d | 1 | 1.47mi |
Listing history 10 events
-
2026-05-06status Pending
-
2026-04-27price $73,000
-
2026-03-17price $79,000
-
2026-02-17price $89,900
-
2026-01-21price $94,000
-
2025-12-12price $99,000
-
2025-11-17$105,000 Active
-
2025-10-24historical $982
-
2025-10-18$982
-
2023-07-27historical
ⓘ Source: listings_history table (triggers on properties + properties_extension) + one-shot
backfill from property_details.listing_events for pre-trigger history.
Tax reassessment forecast IN · Partial reset (capped growth)
- Current annual tax
- $611 · $51/mo
- Projected year-2 tax
- $616 · $51/mo
- Expected delta
- +$5/yr ($0/mo · 0.8%)
ⓘ Screening estimate from a state-policy table — verify with the county assessor before closing.
Climate risk First Street
- Flood 4/10 Moderate FEMA zone X (unshaded) · 22% chance over 30 yrs
- Wildfire 1/10 Low
- Heat 5/10 Major 7 d/yr ≥107°F today · 19 d/yr by 30 yrs out
- Wind 2/10 Low 3% chance of damaging wind over 30 yrs
- Air quality 3/10 Moderate 3 unhealthy d/yr today · 4 by 30 yrs out
Nearby sold comps map
Loading sold comps map…
Walkable amenities ~0.75 mi
Loading nearby amenities…
Taxation est. · year 1
- Rental income
- $12,365
- − Mortgage interest
- −$4,089
- − Property taxes
- −$611
- − Insurance
- −$365
- − Repairs & maintenance
- −$989
- − Management
- −$989
- − Depreciation
- −$2,124
- Taxable income
- $3,198
- Est. tax owed @ 24.0%
- −$768
- After-tax cash flow
- $3,431/yr
For passive investors: Depreciation is non-cash, so a rental often shows a tax loss while cash-flowing — sheltering income. Rental losses are passive: they offset passive income freely, and up to $25,000/yr can offset ordinary (W-2) income if you actively participate and your MAGI is under $100k (phasing out to $0 by $150k); unused losses carry forward. On sale, claimed depreciation is recaptured at up to 25%, and gains may owe capital-gains tax (a 1031 exchange can defer both). Figures are a year-1 estimate at your 24.0% rate — not tax advice; consult a CPA.
Schools (NCES district)
- District
- Evansville Vanderburgh School Corporation
- NCES district ID
- 1803450
- Math proficiency
- 36% ▼ -7.00%
- Reading proficiency
- 43% ▼ -3.00%
- Median HH income
- $43,270
- Composite
- 33.41/100
- National rank
- #5471
- State rank
- #153 of 301 in IN
Livability — Evansville
- Score
- 63/100
- State rank
- #416
- US rank
- #15047
Category grades
Schools grade is shown separately in the Schools card above.
Census & demographics
- Census place
- Evansville, IN
- County
- Vanderburgh County · 146,793 people
- City population
- 146,793
- Metro
- Evansville, IN-KY
- Population (ZIP)
- 9,988
- Household income
- $40,873
- Rent vs Own
- Severe rent burden
- 735.0
Population outlook (Vanderburgh County) Hauer SSP2
- Today (2025)
- 187,038 people
- By 2030
- 188,907 · +1.0%
- By 2040
- 190,272 · +1.7%
- By 2050
- 188,871 · +1.0%
- By 2075
- 180,751 · -3.4%
- By 2100
- 163,015 · -12.8%
Race, ethnicity, and origin ACS 2023
- Neighborhood character
- Diverse neighborhood (Simpson 0.60)
- Race & ethnicity
- White 50% Black 39% Two or more races 7% Hispanic / Latino 3% Pacific Islander 1% Asian 1%
- Common ancestry
- Romanian 2% Lithuanian 1% Italian 1%
- Foreign-born
- 5% · Canada
- Languages at home
- 96% English-only · Spanish 2% Tagalog/Filipino 1% French/Haitian/Cajun 1%
Political lean MEDSL · Vanderburgh
- 2024 margin
- R (+12.7) · D 43.0% · R 55.6% · Other 1.4%
- 2008→2024 swing
- -15.1pp toward R · 2008: 2.5pp · 2024: -12.7pp
- All cycles
- 2024: R+12.7 2020: R+9.6 2016: R+16.9 2012: R+10.8 2008: D+2.5
Not yet ingested
- Civics
- —
Market trends
- HPI YoY
- ▼ -119.22%
- Current HPI
- 229.9312
- Rent YoY
- ▲ 9.87%
- Metro
- Evansville, IN-KY
- State GDP YoY
- ▲ 2.90%
- F500 in state
- 18
Industry mix (Fortune 500 HQ in IN)
| Industry | F500 HQs | Revenue |
|---|---|---|
| Industrial Machinery | 2 | $37B |
|
||
| Healthcare | 1 | $177B |
|
||
| Pharmaceuticals | 1 | $45B |
|
||
| Metals / Steel | 1 | $18B |
|
||
| Agriculture | 1 | $17B |
|
||
| Packaging | 1 | $12B |
|
||
Price history
-30.5% since first listed10 events — show timeline
- 2026-05-06 Pending — IRMLS
- 2026-04-27 Price Changed $73,000 IRMLS
- 2026-03-17 Price Changed $79,000 IRMLS
- 2026-02-17 Price Changed $89,900 IRMLS
- 2026-01-21 Price Changed $94,000 IRMLS
- 2025-12-12 Price Changed $99,000 IRMLS
- 2025-11-17 Listed $105,000 IRMLS
- 2025-10-24 Rental Removed $982 TENANTTURNER2
- 2025-10-18 Listed for Rent $982 TENANTTURNER2
- 2023-07-27 Rental Removed — APPFOLIO
Property tax history
+1.5%/yrLatest (2024): $611 · +3.0% YoY. Source: county tax records.
Cash-flow waterfall
monthlySold comps — $/sqft
last 12 mo · ≤1 miLoading sold comps…