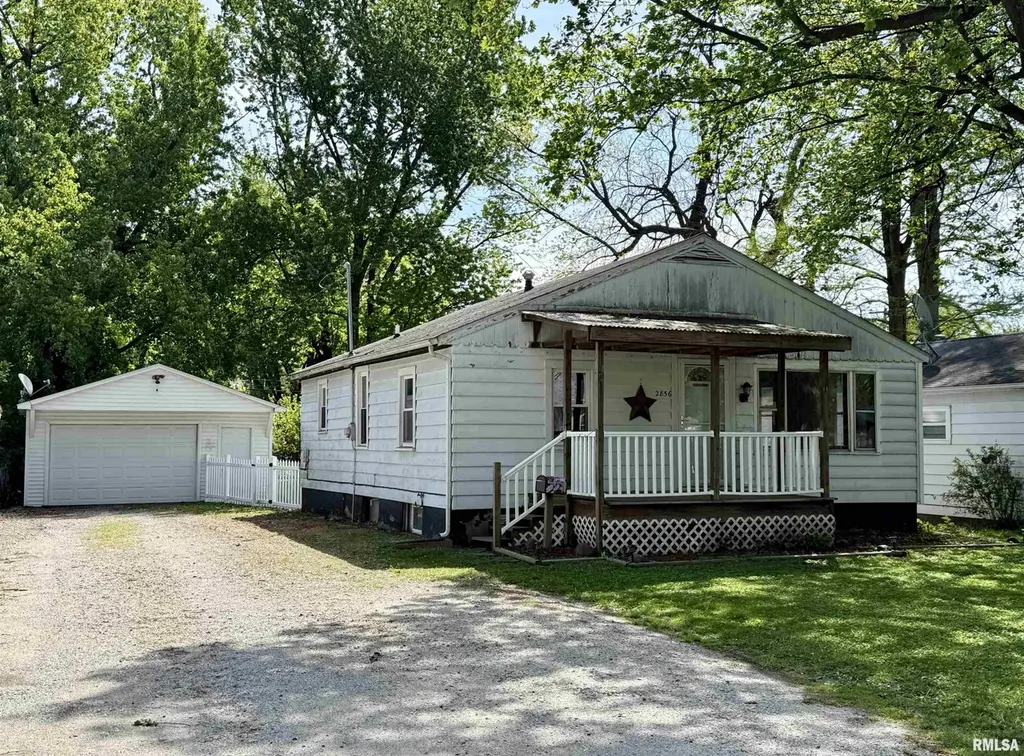
2856 Hoover Ave · Springfield, IL
Flood risk 1/10 · Minimal
- FEMA flood zone
- X (unshaded)
- Chance of flooding over 30 yrs
- 0.0%
- Est. flood insurance / yr
- $473 – $860
Fire risk 1/10 · Minimal
- Est. fire insurance / yr
- $804 – $1,492
Heat risk 4/10 · Minor
- Hot days now (above 105°F)
- 7 days/yr
- Hot days in 30 yrs
- 20 days/yr
Wind risk 2/10 · Minimal
- Chance of severe wind over 30 yrs
- 2.0%
Air-quality risk 2/10 · Minimal
- Unhealthy air days now
- 1 days/yr
- Unhealthy air days in 30 yrs
- 1 days/yr
Risk factors via First Street. Map © Google.
Why this score? — see what drove the B grade
The composite is a weighted blend of 9 inputs, each scored 0–100. Each bar is that input's sub-score; the figure is the points it added to the 100-point composite (weight × sub-score).
- Cash flow +29.8/30.0
- ARV discount +12.0/15.0
- DSCR +10.0/10.0
- 1% rule +9.2/10.0
- Rent growth +5.0/5.0
- Livability +4.0/5.0
- Condition / age +2.5/5.0
- Schools +1.7/10.0
- Appreciation +0.0/10.0
$69,900
🖨 Deal sheet 📄 Offer letter ✓ Due diligence
Listing remarks MLS
MOVE-IN-CONDITION. 1 STORY HOME- NEW FURNACE(10/2011)- A/C (2 YEARS OLD)- ROOF (5 YEARS OLD) SOME REPLACEMENT WINDOWS-GARAGE IS 2 CAR SIZE BUT 1 DOOR. MUST SEE! SQ FT BELIEVED ACCURATE NOT WARRANTED.
Key facts
- 8,000 sq ft lot
- Garage
- Listed 2 days
Property features AI
Exterior
- Parking: Detached gravel driveway; 1-car detached garage
- Utilities: Public water; Public sewer; Electric service (standard)
- Home design: Single family residence; Shingle roof
- Construction: Building area approx. 862; Partial, unfinished crawl space basement
- Exterior features: Fenced yard; Level lot; Paved road access
Interior
- Kitchen: Kitchen with vinyl flooring (approx. 19.3 × 12 ft); Refrigerator
- Bedrooms: 2 bedrooms (both on the main level; Bedroom 1 approx. 11.5 × 9 ft, Bedroom 2 approx. 11.5 × 7.8 ft)
- Flooring: Carpet in bedrooms and living room; Vinyl in kitchen
- Bathrooms: 1 full bathroom
- Heating & cooling: Forced air heating; Central air conditioning
- Interior features: Cable available; High-speed internet; Replacement windows; Has unfinished partial crawl space basement
- Laundry & utility: Washer; Dryer; Gas water heater
Neighborhood map
What this means for you Summary
Snapshot
- This is a 2-bed/1.0-bath single-family listed at $70k.
Deal economics
- At list price, monthly cash flow is $257 ($3k/yr) — positive.
- The deal already cash-flows at list — no discount required.
- Meets the 1% rule at list price ($992 rent vs $70k).
- Cap rate 10.7% vs local median 4.9% in Springfield — top-decile yield for the area; either an underpriced asset or a hidden risk that comps aren't pricing in. Stress-test before assuming the spread holds.
Location & tenants
- Location reads 79/100 on livability (#122 in IL, #2,138 nationally) — a middle-class / working-renter tenant base. Strengths: amenities A+, commute A+, cost of living A+; Watch: schools D+, crime F.
- Springfield SD 186 (urban): math 17% / reading 22% proficiency, ranked #438 of 620 in IL (top 71%) — low school quality limits family demand, transient renter base, plan for 1-2y turnover; 64% free/reduced lunch — lower-income household profile, screen leases tightly.
- Market conditions: Rents rising fast (+12.2%/yr); 107 active listings in the ZIP; 13 comparable units currently listed for rent nearby; rentals lingering (median 44d on market — plan ~5-8 weeks vacancy on turnover, expect pricing pressure); 77% of comp listings sitting > 30 days — soft ceiling on asking rent; 225 units permitted in Sangamon County in 2024 (48 in 5+ unit buildings).
Forward outlook
- Local home prices are declining (-3.0%/yr); year-one equity from $483 of loan paydown is wiped out by about $2k of value loss. Plan a longer hold.
- Sangamon County population projected to shrink 9% by 2050 — rents likely to lag national; underwrite the cash flow, not the appreciation.
- At projected returns (-3.0% appreciation + 8.0% rent growth), your $20k cash investment doubles in ~6 years — after that, you're playing with house money.
Negotiation context
- Only 2 days on market — expect competitive offers; lowballing is unlikely to land.
- 2 sale attempts since 15y ago with the ask held roughly flat each time — persistent listings suggest the price (not the market) is what's stuck; bring a comps-based counter.
- Current owner paid $45k; list at $70k implies a 55% gain — meaningful room to come down on a strong offer.
Questions for the listing agent
- Is there a deadline driving the sale (1031 exchange, divorce, estate, relocation)? That informs how much negotiation room exists.
- Schools are D-rated, which usually means shorter tenancies and higher turnover. Who's the typical renter profile here, and what's been the actual vacancy rate?
- Crime grade is F in this area — have there been break-ins, vandalism, or insurance claims at this property in the last 3 years? What carrier currently insures it and at what premium?
- What's the average days-on-market for RENTAL listings here right now (not sales)? A rising rental-DOM trend means longer vacancies and softer asking-rent achievability than the comps imply.
- What's the recent tenant-quality profile in this submarket — average credit score on applications, eviction rate, late-payment / NSF rate, and stable-employment percentage? A property-management company in the area should have these aggregated.
- How much new for-sale + rental construction is in the pipeline within 1–3 miles? Heavy new supply typically softens prices + rents 12–24 months out; constrained supply supports both.
Investment metrics
- 1% rule
- 1.42% ✓
- Cap rate
- 10.71%
- Cash-on-cash
- 15.76%
- DSCR
- 1.70
- GRM
- 5.9
CMA / ARV
- ARV (on-the-fly)
- $77,580
- Comps found
- 12
Show comp detail 12 sales within ~0.75 mi
| Address | Dist | Beds/Ba | Sqft | Sold | Price | $/sf | Match |
|---|---|---|---|---|---|---|---|
| 2856 Hoover Ave | 0.00mi | 2/1.0 | 862 (0%) | 1mo | $73,000 | $85 | 99 |
| 2828 Hoover St | 0.06mi | 3/1.0 (+1) | 939 (+9%) | 3mo | $50,000 | $53 | 75 |
| 2936 Hoover St | 0.09mi | 2/1.0 | 950 (+10%) | 6mo | $69,900 | $74 | 73 |
| 3321 Buckner St | 0.47mi | 3/1.0 (+1) | 864 (+0%) | 10mo | $69,900 | $81 | 64 |
| 3217 Buckner St | 0.46mi | 3/1.0 (+1) | 860 (-0%) | 12mo | $115,000 | $134 | 64 |
| 6 Ridge Ct | 0.54mi | 3/1.0 (+1) | 903 (+5%) | 3mo | $80,000 | $89 | 59 |
| 2652 Yale Blvd | 0.68mi | 2/1.0 | 840 (-3%) | 7mo | $76,000 | $90 | 58 |
| 2910 S 14th St | 0.31mi | 3/1.0 (+1) | 955 (+11%) | 6mo | $112,500 | $118 | 58 |
| 3217 Normandy Road East | 0.69mi | 3/1.0 (+1) | 864 (+0%) | 9mo | $120,000 | $139 | 55 |
| 2911 S 13th St | 0.40mi | 2/1.0 | 959 (+11%) | 11mo | $81,100 | $85 | 53 |
| 3218 Sherman St | 0.50mi | 2/1.5 | 791 (-8%) | 10mo | $98,000 | $124 | 53 |
| 2643 Yale Blvd | 0.71mi | 2/1.0 | 780 (-10%) | 10mo | $91,000 | $117 | 43 |
Match score weights: distance 35% · size 25% · config 20% · recency 20%. Top-matched comps best support the ARV.
Projected returns pro-forma
-3.0% appreciation · 8.0% rent growth · sell at horizon
- IRR
- 12.5%
- Equity multiple
- 1.53×
- Total profit
- $10,334
- Equity at exit
- $10,422
- IRR
- 25.2%
- Equity multiple
- 3.77×
- Total profit
- $54,118
- Equity at exit
- $6,044
Cash invested: $19,572 (down + closing). Projections, not guarantees.
Landlord ↔ Tenant lean methodology
- Overall (STATE)
- 43 Moderately Tenant-Leaning
- State Illinois
- 43 Moderately Tenant-Leaning · D+7
- County
- — inherits STATE
- City
- — inherits STATE
ZIP-level market 62703
- Home prices YoY
- -28.9%
- Rents YoY
- 12.2%
- Active inventory
- 107
- Price-to-rent
- 5.9×
Monthly cashflow live
- Estimated rent
- $992 high interval (Pro) →
- Mortgage (P&I)
- −$367
- Tax from tax record
- −$131 /mo · $1,571/yr
- Insurance
- −$29
- HOA
- −$0
- Vacancy / Maint / Mgmt
- −$208
- Net cashflow
- $257
Break-even live
UW: 25.0% down · 7.5% · 30yr · 1.5% tax · 5.0% vac · 8.0% maint · 8.0% mgmt
Financing live
Cash to close
- Down payment
- $17,475
- Closing costs
- $2,097
- Reserves months
- —
- Total cash needed
- —
Loan-product check · same deal, 3 products live
Conventional
25% down · 7.5% · 30yr
- Down + closing
- —
- Monthly P&I
- —
- Monthly cashflow
- —
- DSCR
- —
- Eligible?
- —
Personal DTI + credit; lowest rate.
DSCR
20% down · 8.5% · 30yr
- Down + closing
- —
- Monthly P&I
- —
- Monthly cashflow
- —
- DSCR
- —
- Eligible?
- —
No personal income docs; deal must DSCR.
Hard money
10% down · 12.0% · 12mo
- Down + closing
- —
- Monthly P&I
- —
- Monthly cashflow
- —
- DSCR
- —
- Eligible?
- —
Short-term bridge; refi at stabilization.
Rent comps 13 comps
| Address | Beds | Baths | Sqft | Rent | $/sqft | DOM | Units | Dist |
|---|---|---|---|---|---|---|---|---|
| 2949 Fox Bridge Rd Springfield, IL | 2.0 | 1.0 | 900 | $960 | $1.07 | 21d | 1 | 0.03mi |
| 2473 Ladley Ct Unit 2412-1 L Springfield, IL | 2.0 | 1.0 | 700 | $725 | $1.04 | 43d | 1 | 0.50mi |
| 2473 Ladley Ct Unit 2520-8 RR Springfield, IL | 1.0 | 1.0 | 580 | $600 | $1.03 | 43d | 1 | 0.50mi |
| 2473 Ladley Ct Unit 2108-2 B Springfield, IL | 2.0 | 1.0 | 700 | $825 | $1.18 | 43d | 1 | 0.50mi |
| 2473 Ladley Ct Springfield, IL | 1.0 | 1.0 | 580 | $725 | $1.25 | 43d | 1 | 0.52mi |
| 6 Ridge Ct Springfield, IL | 3.0 | 1.0 | 905 | $1,350 | $1.49 | 43d | 1 | 0.54mi |
| 110 W Lake Shore Dr Springfield, IL | 2.0 | 1.0 | 800 | $799 | $1.00 | 21d | 1 | 0.84mi |
| 2328 S 10th St Springfield, IL | 3.0 | 1.0 | 1100 | $1,200 | $1.09 | 43d | 1 | 1.03mi |
| 604 Bryn Mawr Blvd Springfield, IL | 2.0 | 1.0 | 850 | $1,100 | $1.29 | 43d | 1 | 1.04mi |
| 2257 S 10th St Springfield, IL | 2.0 | 1.0 | 1100 | $1,150 | $1.05 | 43d | 1 | 1.12mi |
| 2005 E Laurel St Springfield, IL | 2.0 | 1.0 | 900 | $1,000 | $1.11 | 43d | 1 | 1.43mi |
| 2271 E Laurel St Apt 2277 Springfield, IL | 2.0 | 1.0 | 600 | $1,145 | $1.91 | 21d | 1 | 1.49mi |
| 2277 E Laurel St Springfield, IL | 2.0 | 1.0 | 600 | $1,145 | $1.91 | 43d | 1 | 1.50mi |
Listing history 6 events
-
2026-04-25status Pending
-
2026-04-23$69,900 Active
-
2026-04-07historical $69,900
-
2012-04-23soldstatus $45,000
-
2012-04-20soldstatus $45,000 199-char remark
Show marketing remark (199 chars)
MOVE-IN-CONDITION. 1 STORY HOME- NEW FURNACE(10/2011)- A/C (2 YEARS OLD)- ROOF (5 YEARS OLD) SOME REPLACEMENT WINDOWS-GARAGE IS 2 CAR SIZE BUT 1 DOOR. MUST SEE! SQ FT BELIEVED ACCURATE NOT WARRANTED.
-
2011-12-07$49,900 199-char remark
Show marketing remark (199 chars)
MOVE-IN-CONDITION. 1 STORY HOME- NEW FURNACE(10/2011)- A/C (2 YEARS OLD)- ROOF (5 YEARS OLD) SOME REPLACEMENT WINDOWS-GARAGE IS 2 CAR SIZE BUT 1 DOOR. MUST SEE! SQ FT BELIEVED ACCURATE NOT WARRANTED.
ⓘ Source: listings_history table (triggers on properties + properties_extension) + one-shot
backfill from property_details.listing_events for pre-trigger history.
Tax reassessment forecast IL · Partial reset (capped growth)
- Current annual tax
- $1,571 · $131/mo
- Projected year-2 tax
- $1,579 · $132/mo
- Expected delta
- +$8/yr (+$1/mo · 0.5%)
ⓘ Screening estimate from a state-policy table — verify with the county assessor before closing.
Climate risk First Street
- Flood 1/10 Low FEMA zone X (unshaded) · 0% chance over 30 yrs
- Wildfire 1/10 Low
- Heat 4/10 Moderate 7 d/yr ≥105°F today · 20 d/yr by 30 yrs out
- Wind 2/10 Low 2% chance of damaging wind over 30 yrs
- Air quality 2/10 Low 1 unhealthy d/yr today · 1 by 30 yrs out
Nearby sold comps map
Loading sold comps map…
Walkable amenities ~0.75 mi
Loading nearby amenities…
Taxation est. · year 1
- Rental income
- $11,905
- − Mortgage interest
- −$3,915
- − Property taxes
- −$1,571
- − Insurance
- −$350
- − Repairs & maintenance
- −$952
- − Management
- −$952
- − Depreciation
- −$2,033
- Taxable income
- $2,131
- Est. tax owed @ 24.0%
- −$511
- After-tax cash flow
- $2,574/yr
For passive investors: Depreciation is non-cash, so a rental often shows a tax loss while cash-flowing — sheltering income. Rental losses are passive: they offset passive income freely, and up to $25,000/yr can offset ordinary (W-2) income if you actively participate and your MAGI is under $100k (phasing out to $0 by $150k); unused losses carry forward. On sale, claimed depreciation is recaptured at up to 25%, and gains may owe capital-gains tax (a 1031 exchange can defer both). Figures are a year-1 estimate at your 24.0% rate — not tax advice; consult a CPA.
Schools (NCES district)
- District
- Springfield SD 186
- NCES district ID
- 1737080
- Math proficiency
- 17% ▼ -7.00%
- Reading proficiency
- 22% ▼ -5.00%
- Median HH income
- $43,744
- Composite
- 16.89/100
- National rank
- #9142
- State rank
- #438 of 620 in IL
Livability — Springfield
- Score
- 79/100
- State rank
- #122
- US rank
- #2138
Category grades
Schools grade is shown separately in the Schools card above.
Census & demographics
- County
- Sangamon County · 115,414 people
- City population
- 59,955
- Metro
- Springfield, IL
- Population (ZIP)
- 28,922
- Household income
- $45,009
- Rent vs Own
- Severe rent burden
- 1626.0
Population outlook (Sangamon County) Hauer SSP2
- Today (2025)
- 198,317 people
- By 2030
- 196,127 · -1.1%
- By 2040
- 188,664 · -4.9%
- By 2050
- 179,624 · -9.4%
- By 2075
- 155,027 · -21.8%
- By 2100
- 122,588 · -38.2%
Race, ethnicity, and origin ACS 2023
- Neighborhood character
- Diverse neighborhood (Simpson 0.59)
- Race & ethnicity
- White 53% Black 35% Two or more races 7% Hispanic / Latino 5%
- Common ancestry
- Lithuanian 2% Romanian 2% Italian 1%
- Foreign-born
- 3% · Canada
- Languages at home
- 95% English-only · Spanish 3% Arabic 1%
Political lean MEDSL · Sangamon
- 2024 margin
- Toss-up / Even · D 46.6% · R 51.6% · Other 1.8%
- 2008→2024 swing
- -9.3pp toward R · 2008: 4.4pp · 2024: -5.0pp
- All cycles
- 2024: R+5.0 2020: R+4.4 2016: R+9.4 2012: R+8.7 2008: D+4.4
Not yet ingested
- Civics
- —
Market trends
- HPI YoY
- ▼ -59.69%
- Current HPI
- 147.0877
- Rent YoY
- ▲ 12.19%
- Metro
- Springfield, IL
- State GDP YoY
- ▲ 1.59%
- F500 in state
- 60
Industry mix (Fortune 500 HQ in IL)
| Industry | F500 HQs | Revenue |
|---|---|---|
| Insurance | 4 | $201B |
|
||
| Consumer Goods | 4 | $87B |
|
||
| Industrial Machinery | 3 | $64B |
|
||
| Healthcare | 2 | $55B |
|
||
| Retail / Pharmacy | 1 | $148B |
|
||
| Agriculture / Food | 1 | $86B |
|
||
Price history
+40.1% since first listed6 events — show timeline
- 2026-04-25 Pending — RMLSA as Distributed by MLS Grid
- 2026-04-23 Listed $69,900 RMLSA as Distributed by MLS Grid
- 2026-04-07 Coming Soon $69,900 RMLSA as Distributed by MLS Grid
- 2012-04-23 Sold (Public Records) $45,000 Public Records
- 2012-04-20 Sold (MLS) $45,000 RMLSA as Distributed by MLS Grid
- 2011-12-07 Listed $49,900 RMLSA as Distributed by MLS Grid
Property tax history
+5.9%/yrLatest (2024): $1,571 · +4.6% YoY. Source: county tax records.
Cash-flow waterfall
monthlySold comps — $/sqft
last 12 mo · ≤1 miLoading sold comps…