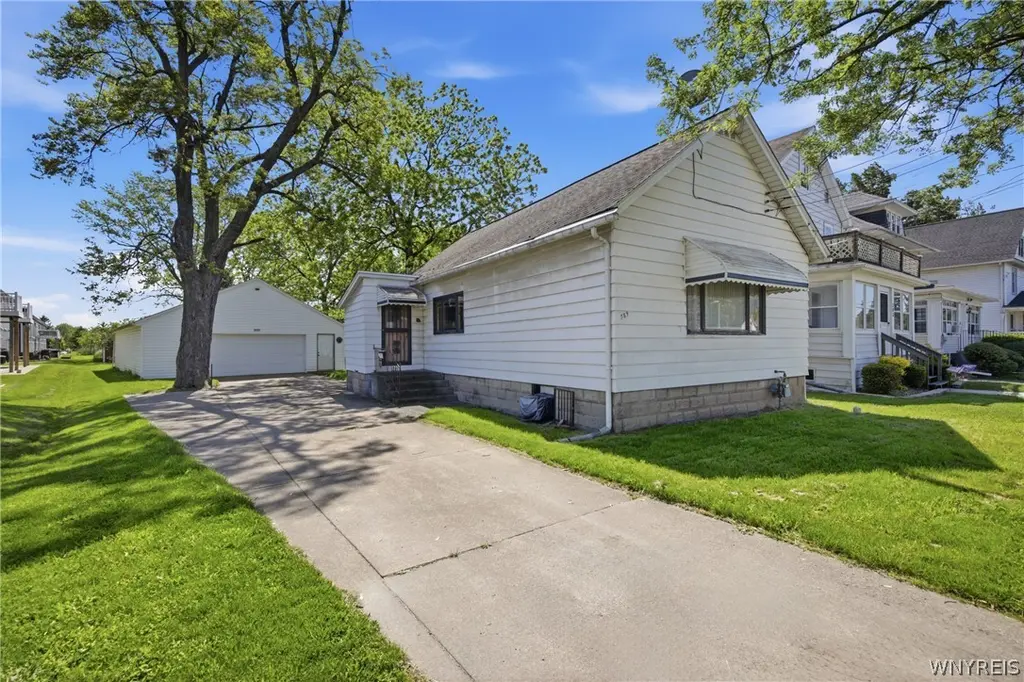
389 Delaware St · Tonawanda, NY
Flood risk 3/10 · Minor
- FEMA flood zone
- X (unshaded)
- Chance of flooding over 30 yrs
- 0.2%
- Est. flood insurance / yr
- $473 – $860
Fire risk 1/10 · Minimal
- Est. fire insurance / yr
- $691 – $1,283
Heat risk 3/10 · Minor
- Hot days now (above 93°F)
- 7 days/yr
- Hot days in 30 yrs
- 15 days/yr
Wind risk 1/10 · Minimal
- Chance of severe wind over 30 yrs
- —
Air-quality risk 3/10 · Minor
- Unhealthy air days now
- 3 days/yr
- Unhealthy air days in 30 yrs
- 4 days/yr
Risk factors via First Street. Map © Google.
Why this score? — see what drove the C grade
The composite is a weighted blend of 9 inputs, each scored 0–100. Each bar is that input's sub-score; the figure is the points it added to the 100-point composite (weight × sub-score).
- Cash flow +18.6/30.0
- ARV discount +15.0/15.0
- DSCR +5.9/10.0
- 1% rule +5.0/10.0
- Livability +4.5/5.0
- Rent growth +4.2/5.0
- Schools +3.5/10.0
- Condition / age +2.5/5.0
- Appreciation +0.0/10.0
$169,900
🖨 Deal sheet 📄 Offer letter ✓ Due diligence
Listing remarks
Rare opportunity! This unique property combines a one bedroom home with a finished basement, a massive 30' x 50' tandem garage with space for 6+ vehicles, and an additional lot, creating endless possibilities for homeowners, investors, and entrepreneurs alike. The nearly half-acre property includes a separate lot with access from Elgin Street. According to zoning regulations, the lot may be suitable for additional development, including a two-family residence or apartment building, subject to approvals and the installation of a proper driveway. The oversized tandem garage is a dream for car enthusiasts, contractors, collectors, or anyone in need of substantial storage and workspace. There's
Key facts
- Tandem garage
- Finished basement
- Additional lot
Tags
Property features AI
Exterior
- Parking: Detached garage; Second garage (additional); Garage includes storage and a workshop; Six garage spaces
- Utilities: Public water connected; Sewer connected
- Home design: Single-story home; Shingle roof; Vinyl siding; Existing/resale condition
- Construction: Block foundation; Built previously (existing)
- Exterior features: Concrete driveway; Near public transit; Rectangular lot
Interior
- Kitchen: Dishwasher; Electric cooktop; Refrigerator
- Bedrooms: One main-level bedroom (approx. 13 x 10)
- Flooring: Hardwood; Varied flooring throughout
- Bathrooms: One full bathroom on the main level
- Heating & cooling: Gas heating with baseboard; Window cooling unit(s)
- Interior features: Galley kitchen; Finished full basement; Recreation space in basement; Bedroom on main level
- Laundry & utility: Laundry in basement; Gas water heater
Neighborhood map
What this means for you Summary
Snapshot
- This is a 3-bed/1.0-bath single-family listed at $170k.
Deal economics
- At list price, monthly cash flow is $165 ($2k/yr) — positive.
- The deal already cash-flows at list — no discount required.
- Meets the 1% rule at list price ($2k rent vs $170k).
Location & tenants
- Location reads 89/100 on livability (#8 in NY, #169 nationally) — a professional / high-income tenant draw. Strengths: amenities A+, commute A+, cost of living A+.
- Tonawanda City School District (suburban): math 39% / reading 43% proficiency, ranked #508 of 590 in NY (top 86%) — families likely to look elsewhere, expect single-tenant / working-renter base with shorter leases.
- Market conditions: Rents rising fast (+6.8%/yr); 191 active listings in the ZIP; 5 comparable units currently listed for rent nearby; rentals leasing fast (median 3d on market — plan ~1-2 weeks tenant-placement turnaround); 1,244 units permitted in Erie County in 2024 (563 in 5+ unit buildings).
Forward outlook
- Local home prices are declining (-3.0%/yr); year-one equity from $1k of loan paydown is wiped out by about $5k of value loss. Plan a longer hold.
Negotiation context
- Only 9 days on market — expect competitive offers; lowballing is unlikely to land.
Risks & watch-outs
- Watch-outs: built in 1910 — expect roof / HVAC / electrical / plumbing capex.
Questions for the listing agent
- Built in 1910 — when were the roof, HVAC, electrical panel, plumbing, and water heater last replaced?
- Is there a deadline driving the sale (1031 exchange, divorce, estate, relocation)? That informs how much negotiation room exists.
- Schools are B-rated — typically a magnet for longer-tenancy family renters. What's the average tenant stay here, and is there a school-zone premium baked into asking?
- What's the average days-on-market for RENTAL listings here right now (not sales)? A rising rental-DOM trend means longer vacancies and softer asking-rent achievability than the comps imply.
- What's the recent tenant-quality profile in this submarket — average credit score on applications, eviction rate, late-payment / NSF rate, and stable-employment percentage? A property-management company in the area should have these aggregated.
- How much new for-sale + rental construction is in the pipeline within 1–3 miles? Heavy new supply typically softens prices + rents 12–24 months out; constrained supply supports both.
Investment metrics
- 1% rule
- 1.00% ✓
- Cap rate
- 7.46%
- Cash-on-cash
- 4.17%
- DSCR
- 1.19
- GRM
- 8.3
CMA / ARV
- ARV (on-the-fly)
- $203,628
- Comps found
- 8
Show comp detail 8 sales within ~0.75 mi
| Address | Dist | Beds/Ba | Sqft | Sold | Price | $/sf | Match |
|---|---|---|---|---|---|---|---|
| 128 Bannard Ave | 0.59mi | 2/1.5 (-1) | 972 (+2%) | 6mo | $168,500 | $173 | 58 |
| 205 Bannard Ave | 0.67mi | 3/1.0 | 999 (+4%) | 8mo | $186,500 | $187 | 54 |
| 30 Bannard Ave | 0.58mi | 2/1.0 (-1) | 1,032 (+8%) | 2mo | $220,000 | $213 | 53 |
| 53 Winkler Dr | 0.60mi | 3/1.0 | 1,060 (+11%) | 2mo | $210,000 | $198 | 53 |
| 346 Maldiner Ave | 0.69mi | 3/1.5 | 999 (+4%) | 9mo | $280,000 | $280 | 50 |
| 236 Newell Ave | 0.61mi | 3/1.0 | 999 (+4%) | 16mo | $237,000 | $237 | 50 |
| 18 Joseph Dr | 0.63mi | 2/1.0 (-1) | 1,096 (+15%) | 3mo | $295,000 | $269 | 39 |
| 23 Winkler Dr | 0.65mi | 3/1.0 | 1,060 (+11%) | 17mo | $215,000 | $203 | 38 |
Match score weights: distance 35% · size 25% · config 20% · recency 20%. Top-matched comps best support the ARV.
Projected returns pro-forma
-3.0% appreciation · 6.75% rent growth · sell at horizon
- IRR
- -5.6%
- Equity multiple
- 0.78×
- Total profit
- $-10,303
- Equity at exit
- $25,333
- IRR
- 8.1%
- Equity multiple
- 1.72×
- Total profit
- $34,273
- Equity at exit
- $14,690
Cash invested: $47,572 (down + closing). Projections, not guarantees.
Landlord ↔ Tenant lean methodology
- Overall (STATE)
- 15 Strongly Tenant-Friendly
- State New York
- 15 Strongly Tenant-Friendly · D+10
- County
- — inherits STATE
- City
- — inherits STATE
ZIP-level market 14150
- Rents YoY
- 6.8%
- Active inventory
- 191
- Price-to-rent
- 8.3×
Monthly cashflow live
- Estimated rent
- $1,703 high interval (Pro) →
- Mortgage (P&I)
- −$891
- Tax from tax record
- −$219 /mo · $2,624/yr
- Insurance
- −$71
- HOA
- −$0
- Vacancy / Maint / Mgmt
- −$358
- Net cashflow
- $165
Break-even live
UW: 25.0% down · 7.5% · 30yr · 1.5% tax · 5.0% vac · 8.0% maint · 8.0% mgmt
Financing live
Cash to close
- Down payment
- $42,475
- Closing costs
- $5,097
- Reserves months
- —
- Total cash needed
- —
Loan-product check · same deal, 3 products live
Conventional
25% down · 7.5% · 30yr
- Down + closing
- —
- Monthly P&I
- —
- Monthly cashflow
- —
- DSCR
- —
- Eligible?
- —
Personal DTI + credit; lowest rate.
DSCR
20% down · 8.5% · 30yr
- Down + closing
- —
- Monthly P&I
- —
- Monthly cashflow
- —
- DSCR
- —
- Eligible?
- —
No personal income docs; deal must DSCR.
Hard money
10% down · 12.0% · 12mo
- Down + closing
- —
- Monthly P&I
- —
- Monthly cashflow
- —
- DSCR
- —
- Eligible?
- —
Short-term bridge; refi at stabilization.
Rent comps 5 comps
| Address | Beds | Baths | Sqft | Rent | $/sqft | DOM | Units | Dist |
|---|---|---|---|---|---|---|---|---|
| 1974 Newell Ave Tonawanda, NY | 2.0 | 1.0 | 675 | $1,185 | $1.76 | 3d | 3 | 0.51mi |
| 53 Winkler Dr Tonawanda, NY | 3.0 | 1.0 | 1060 | $2,100 | $1.98 | 11d | 1 | 0.57mi |
| 285 Crestmount Ave Tonawanda, NY | 1.0–2.0 | 1.0 | 725 | $1,905 | $2.63 | 1d | 9 | 0.90mi |
| 268-360 Hinds St Tonawanda, NY | 1.0–2.0 | 1.0 | 500 | $1,214 | $2.43 | 11d | 1 | 1.09mi |
| 330 E Niagara St Tonawanda, NY | 1.0–2.0 | 1.0–2.0 | 975 | $1,900 | $1.95 | 1d | 1 | 1.11mi |
Listing history 9 events
-
2026-06-13status $169,900 Pending 9 DOM
-
2026-06-10days on market $169,900 Active 9 DOM
-
2026-06-09days on market $169,900 Active 8 DOM
-
2026-06-08days on market $169,900 Active 7 DOM
-
2026-06-07days on market $169,900 Active 6 DOM
-
2026-06-05days on market $169,900 Active 3 DOM
-
2026-06-03days on market $169,900 Active 2 DOM
-
2026-06-02remarks 699-char remark
-
2026-06-02$169,900 Active 1 DOM
ⓘ Source: listings_history table (triggers on properties + properties_extension) + one-shot
backfill from property_details.listing_events for pre-trigger history.
Tax reassessment forecast NY · Partial reset (capped growth)
- Current annual tax
- $2,624 · $219/mo
- Projected year-2 tax
- $2,748 · $229/mo
- Expected delta
- +$124/yr (+$10/mo · 4.7%)
ⓘ Screening estimate from a state-policy table — verify with the county assessor before closing.
Climate risk First Street
- Flood 3/10 Moderate FEMA zone X (unshaded) · 20% chance over 30 yrs
- Wildfire 1/10 Low
- Heat 3/10 Moderate 7 d/yr ≥93°F today · 15 d/yr by 30 yrs out
- Wind 1/10 Low
- Air quality 3/10 Moderate 3 unhealthy d/yr today · 4 by 30 yrs out
Nearby sold comps map
Loading sold comps map…
Walkable amenities ~0.75 mi
Loading nearby amenities…
Taxation est. · year 1
- Rental income
- $20,442
- − Mortgage interest
- −$9,517
- − Property taxes
- −$2,624
- − Insurance
- −$850
- − Repairs & maintenance
- −$1,635
- − Management
- −$1,635
- − Depreciation
- −$4,943
- Taxable loss
- −$762
- Est. tax savings @ 24.0%
- +$183
- After-tax cash flow
- $2,167/yr
For passive investors: Depreciation is non-cash, so a rental often shows a tax loss while cash-flowing — sheltering income. Rental losses are passive: they offset passive income freely, and up to $25,000/yr can offset ordinary (W-2) income if you actively participate and your MAGI is under $100k (phasing out to $0 by $150k); unused losses carry forward. On sale, claimed depreciation is recaptured at up to 25%, and gains may owe capital-gains tax (a 1031 exchange can defer both). Figures are a year-1 estimate at your 24.0% rate — not tax advice; consult a CPA.
Schools (NCES district)
- District
- Tonawanda City School District
- NCES district ID
- 3628740
- Math proficiency
- 39% ▼ -19.00%
- Reading proficiency
- 43% ▼ -7.00%
- Median HH income
- $47,061
- Composite
- 35.03/100
- National rank
- #5041
- State rank
- #508 of 590 in NY
Livability — Tonawanda
- Score
- 89/100
- State rank
- #8
- US rank
- #169
Category grades
Schools grade is shown separately in the Schools card above.
Census & demographics
- Census place
- Tonawanda, NY
- County
- Erie County · 714,559 people
- City population
- 41,260
- Metro
- Buffalo-Cheektowaga, NY
- Population (ZIP)
- 41,260
- Household income
- $71,406
- Rent vs Own
- Severe rent burden
- 1427.0
Population outlook (Erie County) Hauer SSP2
- Today (2025)
- 933,037 people
- By 2030
- 935,181 · +0.2%
- By 2040
- 928,531 · -0.5%
- By 2050
- 905,725 · -2.9%
- By 2075
- 834,037 · -10.6%
- By 2100
- 708,033 · -24.1%
Race, ethnicity, and origin ACS 2023
- Neighborhood character
- Predominantly White (87%)
- Race & ethnicity
- White 87% Two or more races 5% Hispanic / Latino 5% Black 4% Asian 2%
- Common ancestry
- Romanian 13% Lithuanian 3% Slovak 2%
- Foreign-born
- 6% · Canada, Philippines, Vietnam
- Languages at home
- 94% English-only · Other Indo-European 2% Spanish 1% Russian/Polish/Slavic 1%
Political lean MEDSL · Erie
- 2024 margin
- Lean D (+9.7) · D 54.8% · R 45.2%
- 2008→2024 swing
- -7.9pp toward R · 2008: 17.5pp · 2024: 9.7pp
- All cycles
- 2024: D+9.7 2020: D+14.7 2016: D+4.8 2012: D+15.6 2008: D+17.5
Not yet ingested
- Civics
- —
Market trends
- HPI YoY
- ▼ -260.43%
- Current HPI
- 334.5893
- Rent YoY
- ▲ 6.75%
- Metro
- Buffalo-Cheektowaga, NY
- State GDP YoY
- ▲ 2.60%
- F500 in state
- 92
Industry mix (Fortune 500 HQ in NY)
| Industry | F500 HQs | Revenue |
|---|---|---|
| Financial Services | 10 | $950B |
|
||
| Consumer Goods | 9 | $162B |
|
||
| Insurance | 4 | $225B |
|
||
| Telecommunications | 2 | $144B |
|
||
| Pharmaceuticals | 2 | $112B |
|
||
| Media / Entertainment | 2 | $69B |
|
||
Price history
1 event — show timeline
- 2026-06-01 Listed $169,900 WNYREIS
Property tax history
+30.1%/yrLatest (2025): $2,624 · +23.6% YoY. Source: county tax records.
Cash-flow waterfall
monthlySold comps — $/sqft
last 12 mo · ≤1 miLoading sold comps…