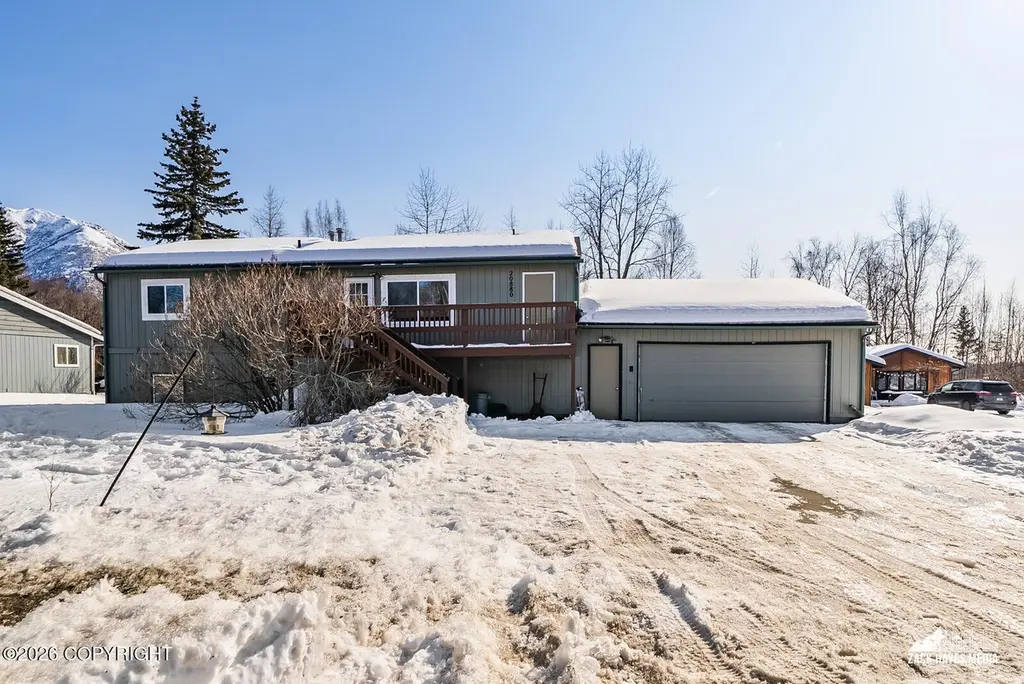
20880 Oberg Rd · Anchorage, AK
Flood risk 1/10 · Minimal
- FEMA flood zone
- X (unshaded)
- Chance of flooding over 30 yrs
- 0.0%
- Est. flood insurance / yr
- $473 – $860
Fire risk No data
- Est. fire insurance / yr
- —
Heat risk No data
- Hot days now (above threshold)
- —
- Hot days in 30 yrs
- —
Wind risk No data
- Chance of severe wind over 30 yrs
- —
Air-quality risk 1/10 · Minimal
- Unhealthy air days now
- —
- Unhealthy air days in 30 yrs
- —
Risk factors via First Street. Map © Google.
Why this score? — see what drove the C grade
The composite is a weighted blend of 9 inputs, each scored 0–100. Each bar is that input's sub-score; the figure is the points it added to the 100-point composite (weight × sub-score).
- Cash flow +18.7/30.0
- ARV discount +13.6/15.0
- DSCR +5.9/10.0
- 1% rule +4.9/10.0
- Livability +3.9/5.0
- Schools +3.7/10.0
- Rent growth +2.5/5.0
- Condition / age +2.5/5.0
- Appreciation +0.0/10.0
$425,000
🖨 Deal sheet (PDF) 📄 Offer letter ✓ Due diligence
Listing remarks
Peters Creek gem! Park views across the street + winter views of Denali. Move-in ready with $70K+ in updates incl. new septic, windows, paint, LVP flooring & more. 3BR + office/den. Lower level ideal for short term rental. Sunny south-facing deck, fenced yard & huge garage. Great highway/commuter access. HUGE storage off garage perfect for all the toys/gear! Home insp done. Repairs underway.
Key facts
- New septic
- Park views
- Winter views
Tags
Property features AI
Exterior
- Parking: 2-car garage; No carport
- Utilities: Septic tank
- Home design: Residential property; Not attached to another unit; Built in 1981
- Construction: Asphalt roof
- Exterior features: Fenced yard; Private yard; Covenant/restriction; Fire pit; Storage; View; Asphalt roof; Paved road access
Interior
- Kitchen: Dishwasher; Refrigerator
- Bedrooms: 3 bedrooms
- Flooring: Carpet
- Bathrooms: 2 full bathrooms
- Interior features: Dishwasher; Refrigerator; Basement; Bedroom and full bathroom on main level; Ceiling fan(s); Family room; Smoke detector(s)
- Laundry & utility: Basement (utility space)
Neighborhood map
What this means for you Summary
Snapshot
- This is a 3-bed/2.0-bath single-family listed at $425k.
Deal economics
- At list price, monthly cash flow is $424 ($5k/yr) — positive.
- The deal already cash-flows at list — no discount required.
- To meet the 1% rule (rent ≥ 1% of price), the offer needs to be $420k (1.2% below list).
- Recommended offer: $420k (1.2% below list) — sets the bar for 1% rule.
- Cap rate 7.5% vs local median 3.8% in Anchorage — top-decile yield for the area; either an underpriced asset or a hidden risk that comps aren't pricing in. Stress-test before assuming the spread holds.
Location & tenants
- Location reads 78/100 on livability (#6 in AK, #2,553 nationally) — a middle-class / working-renter tenant base. Strengths: amenities A+, commute A+, employment A+; Watch: crime F, cost of living F.
- Anchorage School District (urban): math 37% / reading 43% proficiency, ranked #6 of 21 in AK (top 29%) — families likely to look elsewhere, expect single-tenant / working-renter base with shorter leases.
- Zoned schools: Chugiak Elementary (math 62% / reading 52%, grade C+, #25 of 156 statewide, top 18%, 448 students, 17% FRL); Mirror Lake Middle School (math 39% / reading 53%, grade D+, #10 of 36 statewide, top 26%, 563 students, 21% FRL); Chugiak High School (math 42% / reading 42%, grade F, #17 of 61 statewide, top 32%, 905 students, 19% FRL) — zoned schools average 19% FRL vs 38% district-wide (19 pts lower); this property's tenant base skews higher-income than the district average.
- Market conditions: 94 active listings in the ZIP; 1 comparable units currently listed for rent nearby; 306 units permitted in Anchorage Municipality in 2024 (90 in 5+ unit buildings).
Forward outlook
- Local home prices are declining (-3.0%/yr); year-one equity from $3k of loan paydown is wiped out by about $13k of value loss. Plan a longer hold.
- Anchorage County population projected at +12% by 2050 — modest demand growth; plan on rents tracking national, not racing it.
Negotiation context
- Only 12 days on market — expect competitive offers; lowballing is unlikely to land.
- 6 sale attempts since 24y ago with the ask held roughly flat each time — persistent listings suggest the price (not the market) is what's stuck; bring a comps-based counter.
Questions for the listing agent
- Is there a deadline driving the sale (1031 exchange, divorce, estate, relocation)? That informs how much negotiation room exists.
- Schools are B-rated — typically a magnet for longer-tenancy family renters. What's the average tenant stay here, and is there a school-zone premium baked into asking?
- Crime grade is F in this area — have there been break-ins, vandalism, or insurance claims at this property in the last 3 years? What carrier currently insures it and at what premium?
- What's the average days-on-market for RENTAL listings here right now (not sales)? A rising rental-DOM trend means longer vacancies and softer asking-rent achievability than the comps imply.
- What's the recent tenant-quality profile in this submarket — average credit score on applications, eviction rate, late-payment / NSF rate, and stable-employment percentage? A property-management company in the area should have these aggregated.
- How much new for-sale + rental construction is in the pipeline within 1–3 miles? Heavy new supply typically softens prices + rents 12–24 months out; constrained supply supports both.
Investment metrics
- 1% rule
- 0.99% ✗
- Cap rate
- 7.49%
- Cash-on-cash
- 4.27%
- DSCR
- 1.19
- GRM
- 8.4
CMA / ARV
- ARV (on-the-fly)
- $491,520
- Comps found
- 11
Show comp detail 11 sales within ~0.75 mi
| Address | Dist | Beds/Ba | Sqft | Sold | Price | $/sf | Match |
|---|---|---|---|---|---|---|---|
| 20880 Oberg Rd | 0.00mi | 3/2.0 | 1,920 (0%) | 1mo | $425,000 | $221 | 99 |
| 22471 Centurion Dr | 0.37mi | 3/2.5 | 1,828 (-5%) | 10mo | $467,900 | $256 | 64 |
| 22479 Centurion Dr | 0.36mi | 3/2.0 | 1,772 (-8%) | 10mo | $485,000 | $274 | 62 |
| 20838 Helluva St | 0.57mi | 3/2.0 | 1,880 (-2%) | 10mo | $550,000 | $293 | 62 |
| 22909 Green Garden Dr | 0.54mi | 3/2.5 | 1,959 (+2%) | 10mo | $528,000 | $270 | 61 |
| 22839 Northwoods Dr | 0.68mi | 3/2.5 | 1,900 (-1%) | 13mo | $470,000 | $247 | 53 |
| 23105 Green Garden Dr | 0.66mi | 3/2.0 | 1,760 (-8%) | 7mo | $429,000 | $244 | 49 |
| 21986 Valley Ave | 0.42mi | 4/3.0 (+1) | 2,019 (+5%) | 23mo | $675,000 | $334 | 44 |
| 23023 Green Garden Dr | 0.62mi | 3/2.5 | 1,820 (-5%) | 24mo | $399,000 | $219 | 41 |
| 21707 Oberg Rd | 0.56mi | 3/2.5 | 2,078 (+8%) | 24mo | $519,000 | $250 | 38 |
| 23070 Sheltering Spruce Ave | 0.70mi | 3/2.0 | 2,088 (+9%) | 22mo | $650,000 | $311 | 35 |
Match score weights: distance 35% · size 25% · config 20% · recency 20%. Top-matched comps best support the ARV.
Projected returns pro-forma
-3.0% appreciation · 3.0% rent growth · sell at horizon
- IRR
- -9.6%
- Equity multiple
- 0.65×
- Total profit
- $-41,843
- Equity at exit
- $63,369
- IRR
- -0.2%
- Equity multiple
- 0.99×
- Total profit
- $-1,534
- Equity at exit
- $36,746
Cash invested: $119,000 (down + closing). Projections, not guarantees.
Landlord ↔ Tenant lean methodology
- Overall (STATE)
- 80 Strongly Landlord-Friendly
- State Alaska
- 80 Strongly Landlord-Friendly · R+8
- County
- — inherits STATE
- City
- — inherits STATE
ZIP-level market 99567
- Home prices YoY
- -4.7%
- Active inventory
- 94
- Price-to-rent
- 8.4×
Monthly cashflow live
- Estimated rent
- $4,200 medium interval (Pro) →
- Mortgage (P&I)
- −$2,229
- Tax from tax record
- −$488 /mo · $5,861/yr
- Insurance
- −$177
- HOA
- −$0
- Vacancy / Maint / Mgmt
- −$882
- Net cashflow
- $424
Break-even live
Sensitivity live
| Price | -10% $664 | -5% $544 | +0% $424 | +5% $303 | +10% $183 |
|---|---|---|---|---|---|
| Rent | -10% $92 | -5% $258 | +0% $424 | +5% $590 | +10% $756 |
| Rate | -1.0pp $638 | -0.5pp $532 | base $424 | +0.5pp $314 | +1.0pp $202 |
UW: 25.0% down · 7.5% · 30yr · 1.5% tax · 5.0% vac · 8.0% maint · 8.0% mgmt
Financing live
Cash to close
- Down payment
- $106,250
- Closing costs
- $12,750
- Reserves months
- —
- Total cash needed
- —
Loan-product check · same deal, 3 products live
Conventional
25% down · 7.5% · 30yr
- Down + closing
- —
- Monthly P&I
- —
- Monthly cashflow
- —
- DSCR
- —
- Eligible?
- —
Personal DTI + credit; lowest rate.
DSCR
20% down · 8.5% · 30yr
- Down + closing
- —
- Monthly P&I
- —
- Monthly cashflow
- —
- DSCR
- —
- Eligible?
- —
No personal income docs; deal must DSCR.
Hard money
10% down · 12.0% · 12mo
- Down + closing
- —
- Monthly P&I
- —
- Monthly cashflow
- —
- DSCR
- —
- Eligible?
- —
Short-term bridge; refi at stabilization.
Rent comps 1 comps
| Address | Beds | Baths | Sqft | Rent | $/sqft | DOM | Units | Dist |
|---|---|---|---|---|---|---|---|---|
| 19452 Sullins Dr Chugiak, AK | 4.0 | 2.5 | 2617 | $4,200 | $1.60 | 45d | 1 | 1.47mi |
Listing history 13 events
-
2026-05-01status Pending
-
2026-04-20status Active
-
2026-04-09status Pending
-
2026-04-06$425,000 Active
-
2021-08-05soldstatus
-
2021-06-16status Pending
-
2021-06-10price $345,000
-
2021-05-27$350,000 Active
-
2010-06-21$279,900
-
2005-04-19soldstatus
-
2005-02-15$245,000
-
2002-04-26soldstatus
-
2002-01-10$189,900
ⓘ Source: listings_history table (triggers on properties + properties_extension) + one-shot
backfill from property_details.listing_events for pre-trigger history.
Tax reassessment forecast AK · Partial reset (capped growth)
- Current annual tax
- $5,861 · $488/mo
- Projected year-2 tax
- $5,861 · $488/mo
- Expected delta
- $0/yr ($0/mo · 0.0%)
ⓘ Screening estimate from a state-policy table — verify with the county assessor before closing.
Climate risk First Street
- Flood 1/10 Low FEMA zone X (unshaded) · 0% chance over 30 yrs
- Air quality 1/10 Low
Nearby sold comps map
Loading sold comps map…
Walkable amenities ~0.75 mi
Loading nearby amenities…
Taxation est. · year 1
- Rental income
- $50,400
- − Mortgage interest
- −$23,807
- − Property taxes
- −$5,861
- − Insurance
- −$2,125
- − Repairs & maintenance
- −$4,032
- − Management
- −$4,032
- − Depreciation
- −$12,364
- Taxable loss
- −$1,820
- Est. tax savings @ 24.0%
- +$437
- After-tax cash flow
- $5,522/yr
For passive investors: Depreciation is non-cash, so a rental often shows a tax loss while cash-flowing — sheltering income. Rental losses are passive: they offset passive income freely, and up to $25,000/yr can offset ordinary (W-2) income if you actively participate and your MAGI is under $100k (phasing out to $0 by $150k); unused losses carry forward. On sale, claimed depreciation is recaptured at up to 25%, and gains may owe capital-gains tax (a 1031 exchange can defer both). Figures are a year-1 estimate at your 24.0% rate — not tax advice; consult a CPA.
Schools (NCES district)
- District
- Anchorage School District
- NCES district ID
- 0200180
- Math proficiency
- 37% ▼ -2.00%
- Reading proficiency
- 43% ▲ 1.00%
- Median HH income
- $76,447
- Composite
- 37.0/100
- National rank
- #4523
- State rank
- #6 of 21 in AK
Livability — Anchorage
- Score
- 78/100
- State rank
- #6
- US rank
- #2553
Category grades
Schools grade is shown separately in the Schools card above.
Census & demographics
- Census place
- Anchorage, AK
- City population
- 218,117
- Population (ZIP)
- 6,739
Population outlook (Anchorage County) Hauer SSP2
- Today (2025)
- 314,993 people
- By 2030
- 321,771 · +2.2%
- By 2040
- 335,493 · +6.5%
- By 2050
- 352,799 · +12.0%
- By 2075
- 414,771 · +31.7%
- By 2100
- 474,485 · +50.6%
Race, ethnicity, and origin ACS 2023
- Neighborhood character
- Predominantly White (82%)
- Race & ethnicity
- White 82% Hispanic / Latino 7% Two or more races 6% Native American 5% Pacific Islander 1%
- Hispanic origin (detail)
- Puerto Rican 1%
- Common ancestry
- Portuguese 4% Italian 3% Serbian 2%
- Foreign-born
- 2% · Canada
- Languages at home
- 95% English-only · Spanish 5% German/W. Germanic 1%
Political lean MEDSL · Anchorage
- 2024 margin
- D (+12.7) · D 56.3% · R 43.7%
- 2016→2024 swing
- +27.9pp toward D · 2016: -15.2pp · 2024: 12.7pp
- All cycles
- 2024: D+12.7 2016: R+15.2
Not yet ingested
- Civics
- —
Market trends
- HPI YoY
- ▼ -13.74%
- Current HPI
- 279.3784
- Rent YoY
- —
- Metro
- —
- State GDP YoY
- —
- F500 in state
- 0
Price history
+123.8% since first listed13 events — show timeline
- 2026-05-01 Pending — AKMLS
- 2026-04-20 Relisted — AKMLS
- 2026-04-09 Pending — AKMLS
- 2026-04-06 Listed $425,000 AKMLS
- 2021-08-05 Sold (Public Records) — Public Records
- 2021-06-16 Pending — AKMLS
- 2021-06-10 Price Changed $345,000 AKMLS
- 2021-05-27 Listed $350,000 AKMLS
- 2010-06-21 Listed $279,900 AKMLS
- 2005-04-19 Sold (Public Records) — Public Records
- 2005-02-15 Listed $245,000 AKMLS
- 2002-04-26 Sold (Public Records) — Public Records
- 2002-01-10 Listed $189,900 AKMLS
Property tax history
+4.0%/yrLatest (2025): $5,861 · +2.3% YoY. Source: county tax records.
Cash-flow waterfall
monthlySold comps — $/sqft
last 12 mo · ≤1 miLoading sold comps…