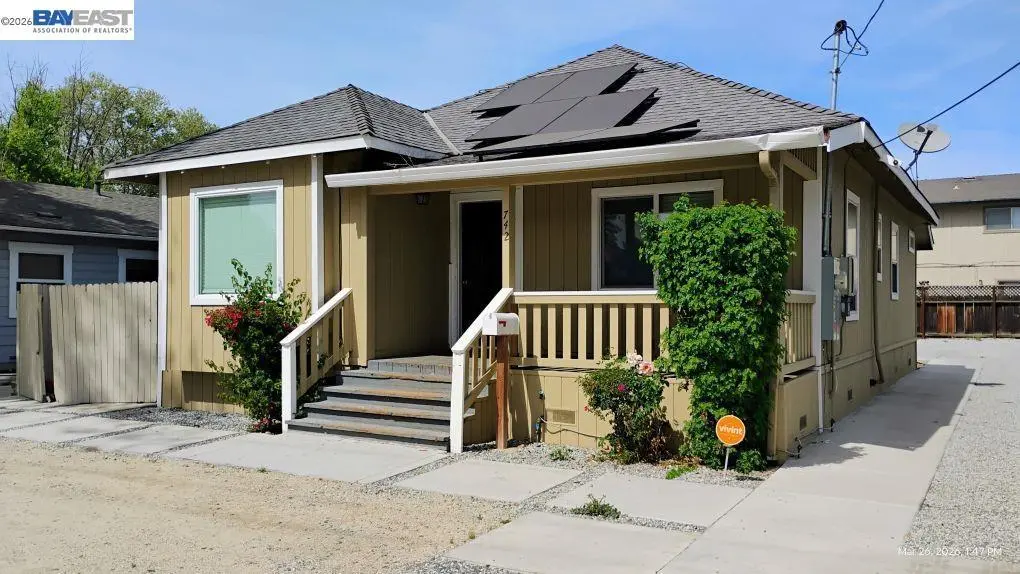
742 4th St · Hollister, CA
Flood risk 1/10 · Minimal
- FEMA flood zone
- X (unshaded)
- Chance of flooding over 30 yrs
- 0.0%
- Est. flood insurance / yr
- $507 – $1,088
Fire risk 5/10 · Moderate
- Est. fire insurance / yr
- $659 – $1,223
Heat risk 4/10 · Minor
- Hot days now (above 93°F)
- 6 days/yr
- Hot days in 30 yrs
- 11 days/yr
Wind risk 1/10 · Minimal
- Chance of severe wind over 30 yrs
- —
Air-quality risk 8/10 · Major
- Unhealthy air days now
- 15 days/yr
- Unhealthy air days in 30 yrs
- 15 days/yr
Risk factors via First Street. Map © Google.
Why this score? — see what drove the C grade
The composite is a weighted blend of 9 inputs, each scored 0–100. Each bar is that input's sub-score; the figure is the points it added to the 100-point composite (weight × sub-score).
- Cash flow +21.9/30.0
- 1% rule +8.5/10.0
- ARV discount +7.5/15.0
- DSCR +7.0/10.0
- Schools +4.0/10.0
- Rent growth +3.4/5.0
- Livability +3.4/5.0
- Condition / age +2.5/5.0
- Appreciation +0.0/10.0
$200,000
🖨 Deal sheet 📄 Offer letter ✓ Due diligence
Listing remarks
AUCTION & REO. 742 4th St, Hollister, CA 95023 is on record a 2 bed, 1.5 bath home. It has solar, driveway access on both right and left of the home. Left yard is fenced in and right side has shared easment to access the backyard.
Key facts
- 5,400 sq ft lot
- Pool
- Built 1910
Neighborhood map
What this means for you Summary
Snapshot
- This is a 2-bed/2.0-bath single-family listed at $200k.
Deal economics
- At list price, monthly cash flow is $316 ($4k/yr) — positive.
- The deal already cash-flows at list — no discount required.
- Meets the 1% rule at list price ($3k rent vs $200k).
- Cap rate 8.2% vs local median 3.0% in Hollister — top-decile yield for the area; either an underpriced asset or a hidden risk that comps aren't pricing in. Stress-test before assuming the spread holds.
Location & tenants
- Location reads 68/100 on livability (#288 in CA) — a middle-class / working-renter tenant base. Strengths: amenities A+, health & safety A+, employment A-; Watch: commute F, cost of living F.
- San Benito High (town): math 29% / reading 55% proficiency, ranked #593 of 1,400 in CA (top 42%) — families likely to look elsewhere, expect single-tenant / working-renter base with shorter leases.
- Market conditions: Rents rising (+3.4%/yr); 277 active listings in the ZIP; 1 comparable units currently listed for rent nearby; high-income renter base; 281 units permitted in San Benito County in 2024 (0 in 5+ unit buildings).
Forward outlook
- Local home prices are declining (-3.0%/yr); year-one equity from $1k of loan paydown is wiped out by about $6k of value loss. Plan a longer hold.
- San Benito County population projected at +18% by 2050 — long-run rental-demand tailwind backs the buy-and-hold thesis.
Negotiation context
- Only 0 days on market — expect competitive offers; lowballing is unlikely to land.
- 4 sale attempts since 5y ago with the ask held roughly flat each time — persistent listings suggest the price (not the market) is what's stuck; bring a comps-based counter.
Risks & watch-outs
- Watch-outs: property tax is 4.1% of price; built in 1910 — expect roof / HVAC / electrical / plumbing capex.
- Climate carrying-cost: moderate wildfire risk — expect insurance premiums to compound above CPI over the hold.
Questions for the listing agent
- Built in 1910 — when were the roof, HVAC, electrical panel, plumbing, and water heater last replaced?
- Property tax is high relative to price — has the assessment been appealed recently, and will the sale trigger a re-assessment?
- Is there a deadline driving the sale (1031 exchange, divorce, estate, relocation)? That informs how much negotiation room exists.
- What's the average days-on-market for RENTAL listings here right now (not sales)? A rising rental-DOM trend means longer vacancies and softer asking-rent achievability than the comps imply.
- What's the recent tenant-quality profile in this submarket — average credit score on applications, eviction rate, late-payment / NSF rate, and stable-employment percentage? A property-management company in the area should have these aggregated.
- How much new for-sale + rental construction is in the pipeline within 1–3 miles? Heavy new supply typically softens prices + rents 12–24 months out; constrained supply supports both.
Investment metrics
- 1% rule
- 1.35% ✓
- Cap rate
- 8.19%
- Cash-on-cash
- 6.78%
- DSCR
- 1.30
- GRM
- 6.2
CMA / ARV
- ARV (on-the-fly)
- $593,164
- Comps found
- 12
Show comp detail 12 sales within ~0.75 mi
| Address | Dist | Beds/Ba | Sqft | Sold | Price | $/sf | Match |
|---|---|---|---|---|---|---|---|
| 367 College St | 0.04mi | 3/1.0 (+1) | 1,050 (+1%) | 2mo | $615,000 | $586 | 85 |
| 829 4th St | 0.10mi | 2/1.0 | 1,003 (-3%) | 9mo | $550,000 | $548 | 78 |
| 706 Central Ave | 0.10mi | 3/2.0 (+1) | 1,132 (+9%) | 0mo | $697,500 | $616 | 75 |
| 553 Line St | 0.22mi | 2/1.0 | 1,003 (-3%) | 10mo | $621,000 | $619 | 72 |
| 601 Chaparral Ct | 0.29mi | 3/1.0 (+1) | 1,100 (+6%) | 1mo | $620,000 | $564 | 66 |
| 200 Line St | 0.25mi | 2/1.0 | 927 (-11%) | 2mo | $620,000 | $669 | 64 |
| 1201 Wilma Dr | 0.49mi | 3/2.0 (+1) | 1,080 (+4%) | 8mo | $640,000 | $593 | 58 |
| 375 South St | 0.48mi | 2/1.5 | 1,171 (+13%) | 4mo | $505,000 | $431 | 51 |
| 1251 Wilma Dr | 0.54mi | 3/1.5 (+1) | 1,100 (+6%) | 15mo | $600,000 | $545 | 46 |
| 261 Miller Rd | 0.62mi | 3/2.0 (+1) | 1,125 (+8%) | 15mo | $630,000 | $560 | 39 |
| 80 Miller Rd | 0.69mi | 3/2.0 (+1) | 1,108 (+7%) | 16mo | $620,000 | $560 | 38 |
| 76 Hawkins St | 0.74mi | 3/1.0 (+1) | 900 (-13%) | 9mo | $515,000 | $572 | 27 |
Match score weights: distance 35% · size 25% · config 20% · recency 20%. Top-matched comps best support the ARV.
Projected returns pro-forma
-3.0% appreciation · 3.43% rent growth · sell at horizon
- IRR
- -5.1%
- Equity multiple
- 0.81×
- Total profit
- $-10,778
- Equity at exit
- $29,821
- IRR
- 5.3%
- Equity multiple
- 1.40×
- Total profit
- $22,676
- Equity at exit
- $17,292
Cash invested: $56,000 (down + closing). Projections, not guarantees.
Landlord ↔ Tenant lean methodology
- Overall (STATE)
- 18 Strongly Tenant-Friendly
- State California
- 18 Strongly Tenant-Friendly · D+13
- County
- — inherits STATE
- City
- — inherits STATE
ZIP-level market 95023
- Rents YoY
- 3.4%
- Active inventory
- 277
- Price-to-rent
- 6.2×
Monthly cashflow live
- Estimated rent
- $2,703 medium interval (Pro) →
- Mortgage (P&I)
- −$1,049
- Tax from tax record
- −$687 /mo · $8,244/yr
- Insurance
- −$83
- HOA
- −$0
- Vacancy / Maint / Mgmt
- −$568
- Net cashflow
- $316
Break-even live
UW: 25.0% down · 7.5% · 30yr · 1.5% tax · 5.0% vac · 8.0% maint · 8.0% mgmt
Financing live
Cash to close
- Down payment
- $50,000
- Closing costs
- $6,000
- Reserves months
- —
- Total cash needed
- —
Loan-product check · same deal, 3 products live
Conventional
25% down · 7.5% · 30yr
- Down + closing
- —
- Monthly P&I
- —
- Monthly cashflow
- —
- DSCR
- —
- Eligible?
- —
Personal DTI + credit; lowest rate.
DSCR
20% down · 8.5% · 30yr
- Down + closing
- —
- Monthly P&I
- —
- Monthly cashflow
- —
- DSCR
- —
- Eligible?
- —
No personal income docs; deal must DSCR.
Hard money
10% down · 12.0% · 12mo
- Down + closing
- —
- Monthly P&I
- —
- Monthly cashflow
- —
- DSCR
- —
- Eligible?
- —
Short-term bridge; refi at stabilization.
Rent comps 1 comps
| Address | Beds | Baths | Sqft | Rent | $/sqft | DOM | Units | Dist |
|---|---|---|---|---|---|---|---|---|
| 805 South St #9 Hollister, CA | 2.0 | 1.0 | 928 | $2,200 | $2.37 | 2d | 1 | 0.35mi |
Listing history 13 events
-
2026-05-03historical
-
2026-04-05$200,000
-
2026-02-26historical
-
2026-02-11historical
-
2026-02-11Active
-
2022-07-11soldstatus $650,000
-
2021-12-22soldstatus $472,500 Sold
-
2021-12-22soldstatus $472,500
-
2021-12-21soldstatus $472,500
-
2021-12-15status Pending (Do Not Show)
-
2021-11-24historical Contingent
-
2021-10-18$499,000 Active
-
2021-10-18$499,000
ⓘ Source: listings_history table (triggers on properties + properties_extension) + one-shot
backfill from property_details.listing_events for pre-trigger history.
Tax reassessment forecast CA · Resets to sale price
- Current annual tax
- $8,244 · $687/mo
- Projected year-2 tax
- $8,244 · $687/mo
- Expected delta
- $0/yr ($0/mo · 0.0%)
ⓘ Screening estimate from a state-policy table — verify with the county assessor before closing.
Climate risk First Street
- Flood 1/10 Low FEMA zone X (unshaded) · 0% chance over 30 yrs
- Wildfire 5/10 Major
- Heat 4/10 Moderate 6 d/yr ≥93°F today · 11 d/yr by 30 yrs out
- Wind 1/10 Low
- Air quality 8/10 Severe 15 unhealthy d/yr today · 15 by 30 yrs out
Nearby sold comps map
Loading sold comps map…
Walkable amenities ~0.75 mi
Loading nearby amenities…
Taxation est. · year 1
- Rental income
- $32,438
- − Mortgage interest
- −$11,203
- − Property taxes
- −$8,244
- − Insurance
- −$1,000
- − Repairs & maintenance
- −$2,595
- − Management
- −$2,595
- − Depreciation
- −$5,818
- Taxable income
- $982
- Est. tax owed @ 24.0%
- −$236
- After-tax cash flow
- $3,560/yr
For passive investors: Depreciation is non-cash, so a rental often shows a tax loss while cash-flowing — sheltering income. Rental losses are passive: they offset passive income freely, and up to $25,000/yr can offset ordinary (W-2) income if you actively participate and your MAGI is under $100k (phasing out to $0 by $150k); unused losses carry forward. On sale, claimed depreciation is recaptured at up to 25%, and gains may owe capital-gains tax (a 1031 exchange can defer both). Figures are a year-1 estimate at your 24.0% rate — not tax advice; consult a CPA.
Schools (NCES district)
- District
- San Benito High
- NCES district ID
- 0634140
- Math proficiency
- 29% ▼ -3.00%
- Reading proficiency
- 55% ▲ 1.00%
- Median HH income
- $69,528
- Composite
- 40.31/100
- National rank
- #7779
- State rank
- #593 of 1400 in CA
Livability — Hollister
- Score
- 68/100
- State rank
- #288
- US rank
- #9766
Category grades
Schools grade is shown separately in the Schools card above.
Census & demographics
- Census place
- Hollister, CA
- County
- San Benito County · 59,889 people
- City population
- 59,889
- Metro
- San Jose-Sunnyvale-Santa Clara, CA
- Population (ZIP)
- 59,889
- Household income
- $116,314
- Rent vs Own
- Severe rent burden
- 1352.0
Population outlook (San Benito County) Hauer SSP2
- Today (2025)
- 65,146 people
- By 2030
- 67,991 · +4.4%
- By 2040
- 72,868 · +11.9%
- By 2050
- 76,832 · +17.9%
- By 2075
- 84,693 · +30.0%
- By 2100
- 85,463 · +31.2%
Race, ethnicity, and origin ACS 2023
- Neighborhood character
- Majority Hispanic (65%)
- Race & ethnicity
- Hispanic / Latino 65% Two or more races 35% White 27% Asian 3% Native American 2%
- Hispanic origin (detail)
- Mexican 58% Puerto Rican 1%
- Common ancestry
- Russian 2% Serbian 1% Lithuanian 1%
- Foreign-born
- 20% · Canada
- Languages at home
- 56% English-only · Spanish 41% Tagalog/Filipino 1% Other Indo-European 1%
Political lean MEDSL · San Benito
- 2024 margin
- D (+12.6) · D 54.9% · R 42.3% · Other 2.8%
- 2008→2024 swing
- -10.2pp toward R · 2008: 22.8pp · 2024: 12.6pp
- All cycles
- 2024: D+12.6 2020: D+24.4 2016: D+20.4 2012: D+17.1 2008: D+22.8
Not yet ingested
- Civics
- —
Market trends
- HPI YoY
- ▼ -532.32%
- Current HPI
- 198.8561
- Rent YoY
- ▲ 3.43%
- Metro
- San Jose-Sunnyvale-Santa Clara, CA
- State GDP YoY
- ▲ 3.21%
- F500 in state
- 116
Industry mix (Fortune 500 HQ in CA)
| Industry | F500 HQs | Revenue |
|---|---|---|
| Technology | 27 | $1,492B |
|
||
| Financial Services | 3 | $174B |
|
||
| Retail | 3 | $44B |
|
||
| Insurance | 3 | $26B |
|
||
| Media / Entertainment | 2 | $115B |
|
||
| Pharmaceuticals / Biotech | 2 | $62B |
|
||
Price history
-59.9% since first listed13 events — show timeline
- 2026-05-03 Listing Removed — bridgeMLS, Bay East AOR, or Contra Costa AOR
- 2026-04-05 Listed $200,000 bridgeMLS, Bay East AOR, or Contra Costa AOR
- 2026-02-26 Listing Removed — bridgeMLS, Bay East AOR, or Contra Costa AOR
- 2026-02-11 Listing Removed — bridgeMLS, Bay East AOR, or Contra Costa AOR
- 2026-02-11 Listed — bridgeMLS, Bay East AOR, or Contra Costa AOR
- 2022-07-11 Sold (Public Records) $650,000 Public Records
- 2021-12-22 Sold (MLS) $472,500 bridgeMLS, Bay East AOR, or Contra Costa AOR
- 2021-12-22 Sold (MLS) $472,500 MLSListings
- 2021-12-21 Sold (Public Records) $472,500 Public Records
- 2021-12-15 Pending — MLSListings
- 2021-11-24 Contingent — MLSListings
- 2021-10-18 Listed $499,000 MLSListings
- 2021-10-18 Listed $499,000 bridgeMLS, Bay East AOR, or Contra Costa AOR
Property tax history
+11.9%/yrLatest (2025): $8,244 · +2.7% YoY. Source: county tax records.
Cash-flow waterfall
monthlySold comps — $/sqft
last 12 mo · ≤1 miLoading sold comps…