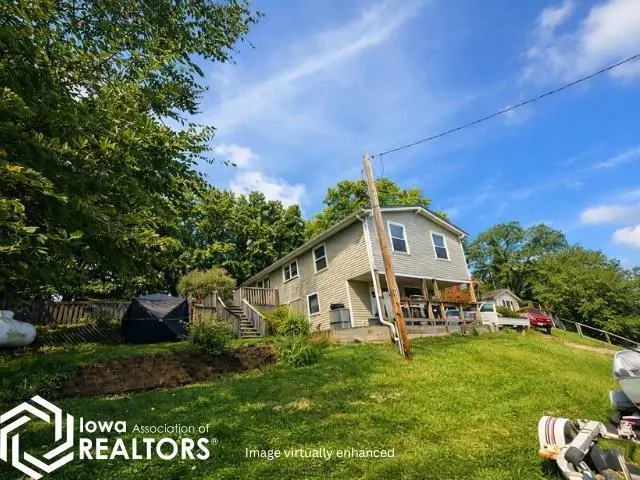
1282 Lakeshore Dr · Holiday Lake, IA
Flood risk 1/10 · Minimal
- FEMA flood zone
- X (unshaded)
- Chance of flooding over 30 yrs
- 0.0%
- Est. flood insurance / yr
- $473 – $860
Fire risk 3/10 · Minor
- Est. fire insurance / yr
- $902 – $1,676
Heat risk 2/10 · Minimal
- Hot days now (above 105°F)
- 7 days/yr
- Hot days in 30 yrs
- 15 days/yr
Wind risk 2/10 · Minimal
- Chance of severe wind over 30 yrs
- —
Air-quality risk 2/10 · Minimal
- Unhealthy air days now
- 0 days/yr
- Unhealthy air days in 30 yrs
- 1 days/yr
Risk factors via First Street. Map © Google.
Why this score? — see what drove the D grade
The composite is a weighted blend of 9 inputs, each scored 0–100. Each bar is that input's sub-score; the figure is the points it added to the 100-point composite (weight × sub-score).
- ARV discount +13.2/15.0
- Appreciation +9.3/10.0
- Schools +6.2/10.0
- Cash flow +3.4/30.0
- Livability +3.3/5.0
- Rent growth +2.5/5.0
- Condition / age +2.5/5.0
- 1% rule +0.0/10.0
- DSCR +0.0/10.0
$239,000
🖨 Deal sheet 📄 Offer letter ✓ Due diligence
Listing remarks MLS
?? This is the kind of lake home everyone ends up at after a day on the water. Designed for both full-time living or weekend getaways, this 2-bedroom, 2-bath home offers an easy, open layout built for relaxing and gathering. The main living space flows comfortably, creating a welcoming atmosphere for everyday living or hosting. The finished lower level adds valuable extra space—perfect for a rec room, game area, or additional hangout zone. Whether you're entertaining or unwinding, this home adapts to your lifestyle. Step outside to the covered porch and enjoy the lake view, an ideal spot for morning coffee or evenings at the lake. With added space and flexibility not often found in similar homes, this property stands out. Plan your showing and start enjoying lake life.
Key facts
- Covered deck
- Partial lake view
- Modern cabinetry
Tags
Neighborhood map
What this means for you Summary
Snapshot
- This is a 2-bed/2.0-bath single-family listed at $239k.
Deal economics
- At list price, monthly cash flow is $-730 ($-9k/yr) — negative.
- To cash-flow at today's rent, offer at most $110k (54.0% below list).
- To meet the 1% rule (rent ≥ 1% of price), the offer needs to be $108k (54.7% below list).
- Recommended offer: $108k (54.7% below list) — sets the bar for 1% rule.
- Cap rate 2.6% vs local median 1.8% in Holiday Lake — top-decile yield for the area; either an underpriced asset or a hidden risk that comps aren't pricing in. Stress-test before assuming the spread holds.
Location & tenants
- Location reads 66/100 on livability (#524 in IA) — a middle-class / working-renter tenant base. Strengths: crime A+, cost of living A+, housing A+; Watch: schools D, amenities F, commute F.
- Brooklyn-Guernsey-Malcom Community School District (rural): math 72% / reading 74% proficiency, ranked #101 of 289 in IA (top 35%) — strong family-tenant draw, lease renewals of 3-5y typical.
- Market conditions: 57 active listings in the ZIP; 27 units permitted in Poweshiek County in 2024 (0 in 5+ unit buildings).
Forward outlook
- In year one you build about $22k of equity ($2k loan paydown + $20k appreciation (8.6% local appreciation)).
- Poweshiek County population projected to shrink 3% by 2050 — rents likely to lag national; underwrite the cash flow, not the appreciation.
- By year 2, paydown + projected appreciation supports a ~$35k cash-out refi (75% LTV) — recoverable capital for the next deal without selling this one.
Negotiation context
- It's been on market 100 days — a 9% lower offer ($217k) is reasonable based on typical stale-listing flexibility.
- 6 sale attempts since 11y ago with the ask held roughly flat each time — persistent listings suggest the price (not the market) is what's stuck; bring a comps-based counter.
- Current owner paid $205k; 17% above their basis — modest negotiation headroom, anchor on the comps not their cost.
Questions for the listing agent
- What do current leases actually rent for vs. the listed asking? Can we see a recent rent roll and the last 12 months of T-12 income?
- It's been on market 100 days. Have you received any prior offers? Is the seller open to a 55% concession, seller financing, or rate buy-down credit?
- Built in 1967 — when were the roof, HVAC, electrical panel, plumbing, and water heater last replaced?
- What does the HOA fee cover, when was the last increase, and are there any pending special assessments or reserve-fund shortfalls?
- Why hasn't it sold? Are there any deal-killer items the seller is aware of (foundation, flood, title, zoning, code violations)?
- Is there a deadline driving the sale (1031 exchange, divorce, estate, relocation)? That informs how much negotiation room exists.
- Schools are D-rated, which usually means shorter tenancies and higher turnover. Who's the typical renter profile here, and what's been the actual vacancy rate?
- The area grade is low — what's the realistic commute time and amenity access for the typical tenant pool here? Any planned neighborhood developments (good or bad) we should know about?
- What's the average days-on-market for RENTAL listings here right now (not sales)? A rising rental-DOM trend means longer vacancies and softer asking-rent achievability than the comps imply.
- What's the recent tenant-quality profile in this submarket — average credit score on applications, eviction rate, late-payment / NSF rate, and stable-employment percentage? A property-management company in the area should have these aggregated.
- How much new for-sale + rental construction is in the pipeline within 1–3 miles? Heavy new supply typically softens prices + rents 12–24 months out; constrained supply supports both.
Investment metrics
- 1% rule
- 0.45% ✗
- Cap rate
- 2.63%
- Cash-on-cash
- -13.09%
- DSCR
- 0.42
- GRM
- 18.4
CMA / ARV
- ARV (median comp)
- $273,979
- List price
- $239,000
- Delta
- -12.77%
- Verdict
- UNDERPRICED
- Comps
- 20 within 1.0 mi
Projected returns pro-forma
8.56% appreciation · 3.0% rent growth · sell at horizon
- IRR
- 11.7%
- Equity multiple
- 1.91×
- Total profit
- $60,574
- Equity at exit
- $190,772
- IRR
- 12.3%
- Equity multiple
- 4.15×
- Total profit
- $210,898
- Equity at exit
- $387,806
Cash invested: $66,920 (down + closing). Projections, not guarantees.
Landlord ↔ Tenant lean methodology
- Overall (STATE)
- 83 Strongly Landlord-Friendly
- State Iowa
- 83 Strongly Landlord-Friendly · R+6
- County
- — inherits STATE
- City
- — inherits STATE
ZIP-level market 52211
- Home prices YoY
- 2.6%
- Active inventory
- 57
- Price-to-rent
- 18.4×
Monthly cashflow live
- Estimated rent
- $1,082 medium interval (Pro) →
- Mortgage (P&I)
- −$1,253
- Tax from tax record
- −$200 /mo · $2,400/yr
- Insurance
- −$100
- HOA
- −$32
- Vacancy / Maint / Mgmt
- −$227
- Net cashflow
- $-730
Break-even live
UW: 25.0% down · 7.5% · 30yr · 1.5% tax · 5.0% vac · 8.0% maint · 8.0% mgmt
Financing live
Cash to close
- Down payment
- $59,750
- Closing costs
- $7,170
- Reserves months
- —
- Total cash needed
- —
Loan-product check · same deal, 3 products live
Conventional
25% down · 7.5% · 30yr
- Down + closing
- —
- Monthly P&I
- —
- Monthly cashflow
- —
- DSCR
- —
- Eligible?
- —
Personal DTI + credit; lowest rate.
DSCR
20% down · 8.5% · 30yr
- Down + closing
- —
- Monthly P&I
- —
- Monthly cashflow
- —
- DSCR
- —
- Eligible?
- —
No personal income docs; deal must DSCR.
Hard money
10% down · 12.0% · 12mo
- Down + closing
- —
- Monthly P&I
- —
- Monthly cashflow
- —
- DSCR
- —
- Eligible?
- —
Short-term bridge; refi at stabilization.
HOA detail
- Monthly dues
- $32 · $384/yr
- Likely covers
- water
Listing history 23 events
-
2026-06-16days on market $239,000 Active 100 DOM
-
2026-06-15days on market $239,000 Active 99 DOM
-
2026-06-13days on market $239,000 Active 97 DOM
-
2026-06-12days on market $239,000 Active 96 DOM
-
2026-06-09days on market $239,000 Active 93 DOM
-
2026-06-08days on market $239,000 Active 92 DOM
-
2026-06-07days on market $239,000 Active 91 DOM
-
2026-06-07days on market $239,000 Active 90 DOM
-
2026-06-04days on market $239,000 Active 87 DOM
-
2026-06-02days on market $239,000 Active 86 DOM
-
2026-06-01days on market $239,000 Active 85 DOM
-
2026-05-31days on market $239,000 Active 84 DOM
-
2026-05-31days on market $239,000 Active 83 DOM
-
2026-04-15price $239,000 785-char remark
Show marketing remark (785 chars)
?? This is the kind of lake home everyone ends up at after a day on the water. Designed for both full-time living or weekend getaways, this 2-bedroom, 2-bath home offers an easy, open layout built for relaxing and gathering. The main living space flows comfortably, creating a welcoming atmosphere for everyday living or hosting. The finished lower level adds valuable extra space—perfect for a rec room, game area, or additional hangout zone. Whether you're entertaining or unwinding, this home adapts to your lifestyle. Step outside to the covered porch and enjoy the lake view, an ideal spot for morning coffee or evenings at the lake. With added space and flexibility not often found in similar homes, this property stands out. Plan your showing and start enjoying lake life.
-
2026-03-08$249,000 Active 785-char remark
Show marketing remark (785 chars)
?? This is the kind of lake home everyone ends up at after a day on the water. Designed for both full-time living or weekend getaways, this 2-bedroom, 2-bath home offers an easy, open layout built for relaxing and gathering. The main living space flows comfortably, creating a welcoming atmosphere for everyday living or hosting. The finished lower level adds valuable extra space—perfect for a rec room, game area, or additional hangout zone. Whether you're entertaining or unwinding, this home adapts to your lifestyle. Step outside to the covered porch and enjoy the lake view, an ideal spot for morning coffee or evenings at the lake. With added space and flexibility not often found in similar homes, this property stands out. Plan your showing and start enjoying lake life.
-
2025-09-22$250,000 Active
-
2022-09-07soldstatus $205,000
-
2022-08-31soldstatus $205,000
-
2022-04-12$205,000
-
2021-07-29$249,900
-
2020-04-30$129,900
-
2015-06-16$129,900
-
2012-05-19soldstatus $115,000
ⓘ Source: listings_history table (triggers on properties + properties_extension) + one-shot
backfill from property_details.listing_events for pre-trigger history.
Tax reassessment forecast IA · Partial reset (capped growth)
- Current annual tax
- $2,400 · $200/mo
- Projected year-2 tax
- $3,076 · $256/mo
- Expected delta
- +$676/yr (+$56/mo · 28.2%)
ⓘ Screening estimate from a state-policy table — verify with the county assessor before closing.
Climate risk First Street
- Flood 1/10 Low FEMA zone X (unshaded) · 0% chance over 30 yrs
- Wildfire 3/10 Moderate
- Heat 2/10 Low 7 d/yr ≥105°F today · 15 d/yr by 30 yrs out
- Wind 2/10 Low
- Air quality 2/10 Low 0 unhealthy d/yr today · 1 by 30 yrs out
Nearby sold comps map
Loading sold comps map…
Walkable amenities ~0.75 mi
Loading nearby amenities…
Taxation est. · year 1
- Rental income
- $12,985
- − Mortgage interest
- −$13,388
- − Property taxes
- −$2,400
- − Insurance
- −$1,195
- − Repairs & maintenance
- −$1,039
- − Management
- −$1,039
- − HOA
- −$384
- − Depreciation
- −$6,953
- Taxable loss
- −$13,412
- Est. tax savings @ 24.0%
- +$3,219
- After-tax cash flow
- $-5,542/yr
For passive investors: Depreciation is non-cash, so a rental often shows a tax loss while cash-flowing — sheltering income. Rental losses are passive: they offset passive income freely, and up to $25,000/yr can offset ordinary (W-2) income if you actively participate and your MAGI is under $100k (phasing out to $0 by $150k); unused losses carry forward. On sale, claimed depreciation is recaptured at up to 25%, and gains may owe capital-gains tax (a 1031 exchange can defer both). Figures are a year-1 estimate at your 24.0% rate — not tax advice; consult a CPA.
Schools (NCES district)
- District
- Brooklyn-Guernsey-Malcom Community School District
- NCES district ID
- 1905490
- Math proficiency
- 72% ▼ -4.00%
- Reading proficiency
- 74% ▲ 2.00%
- Median HH income
- $49,307
- Composite
- 61.79/100
- National rank
- #734
- State rank
- #101 of 289 in IA
Livability — Holiday Lake
- Score
- 66/100
- State rank
- #524
- US rank
- #11725
Category grades
Schools grade is shown separately in the Schools card above.
Census & demographics
- Census place
- Holiday Lake, IA
- Population (ZIP)
- 2,671
Population outlook (Poweshiek County) Hauer SSP2
- Today (2025)
- 18,601 people
- By 2030
- 18,342 · -1.4%
- By 2040
- 17,944 · -3.5%
- By 2050
- 18,029 · -3.1%
- By 2075
- 19,945 · +7.2%
- By 2100
- 22,637 · +21.7%
Race, ethnicity, and origin ACS 2023
- Neighborhood character
- Predominantly White (98%)
- Race & ethnicity
- White 98% Hispanic / Latino 2%
- Common ancestry
- English 4% Slovak 3% Iranian 2%
- Foreign-born
- 2% · Canada
- Languages at home
- 98% English-only · Spanish 1%
Political lean MEDSL · Poweshiek
- 2024 margin
- R (+17.0) · D 40.8% · R 57.8% · Other 1.5%
- 2008→2024 swing
- -28.7pp toward R · 2008: 11.8pp · 2024: -17.0pp
- All cycles
- 2024: R+17.0 2020: R+13.3 2016: R+6.8 2012: D+9.1 2008: D+11.8
Not yet ingested
- Civics
- —
Market trends
- HPI YoY
- ▲ 8.56%
- Current HPI
- 332.4308
- Rent YoY
- —
- Metro
- —
- State GDP YoY
- ▲ 2.48%
- F500 in state
- 4
Industry mix (Fortune 500 HQ in IA)
| Industry | F500 HQs | Revenue |
|---|---|---|
| Financial Services | 1 | $16B |
|
||
| Retail / Convenience | 1 | $15B |
|
||
Price history
+107.8% since first listed10 events — show timeline
- 2026-04-15 Price Changed $239,000 IAR
- 2026-03-08 Listed $249,000 IAR
- 2025-09-22 Listed $250,000 IAR
- 2022-09-07 Sold (MLS) $205,000 IAR
- 2022-08-31 Sold (Public Records) $205,000 Public Records
- 2022-04-12 Listed $205,000 IAR
- 2021-07-29 Listed $249,900 IAR
- 2020-04-30 Listed $129,900 IAR
- 2015-06-16 Listed $129,900 IAR
- 2012-05-19 Sold (Public Records) $115,000 Public Records
Property tax history
+7.1%/yrLatest (2025): $2,400 · +1.0% YoY. Source: county tax records.
Cash-flow waterfall
monthlySold comps — $/sqft
last 12 mo · ≤1 miLoading sold comps…