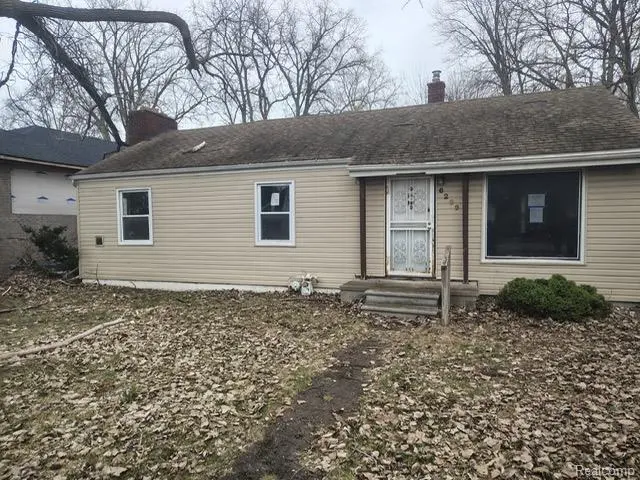
6299 Hunt St · Romulus, MI
Flood risk 1/10 · Minimal
- FEMA flood zone
- X (unshaded)
- Chance of flooding over 30 yrs
- 0.0%
- Est. flood insurance / yr
- $507 – $1,088
Fire risk 3/10 · Minor
- Est. fire insurance / yr
- $784 – $1,456
Heat risk 3/10 · Minor
- Hot days now (above 97°F)
- 7 days/yr
- Hot days in 30 yrs
- 15 days/yr
Wind risk 2/10 · Minimal
- Chance of severe wind over 30 yrs
- —
Air-quality risk 2/10 · Minimal
- Unhealthy air days now
- 1 days/yr
- Unhealthy air days in 30 yrs
- 3 days/yr
Risk factors via First Street. Map © Google.
Why this score? — see what drove the B grade
The composite is a weighted blend of 9 inputs, each scored 0–100. Each bar is that input's sub-score; the figure is the points it added to the 100-point composite (weight × sub-score).
- Cash flow +30.0/30.0
- ARV discount +15.0/15.0
- 1% rule +10.0/10.0
- DSCR +10.0/10.0
- Livability +3.0/5.0
- Rent growth +2.5/5.0
- Condition / age +2.5/5.0
- Schools +1.3/10.0
- Appreciation +0.0/10.0
$89,900
🖨 Deal sheet 📄 Offer letter ✓ Due diligence
Listing remarks MLS
6299 Hunt is a fantastic opportunity for renovators, or buyers looking to create their dream home from the ground up. This property offers solid potential with a spacious layout and a desirable location, making it the perfect canvas for your vision. While the home does need work, it provides a rare chance to customize every detail to your taste and add significant value. With the right updates and improvements, 6299 Hunt can truly shine - don't miss the chance to transform this diamond in the rough into something special.
Key facts
- 0.35 acre lot
- Garage
- Built 1950
Neighborhood map
What this means for you Summary
Snapshot
- This is a 3-bed/1.0-bath single-family listed at $90k.
Deal economics
- At list price, monthly cash flow is $443 ($5k/yr) — positive.
- The deal already cash-flows at list — no discount required.
- Meets the 1% rule at list price ($1k rent vs $90k).
- Recommended offer: $87k (3.0% below list) — sets the bar for market timing.
- Cap rate 12.2% vs local median 4.2% in Romulus — top-decile yield for the area; either an underpriced asset or a hidden risk that comps aren't pricing in. Stress-test before assuming the spread holds.
Location & tenants
- Location reads 60/100 on livability (#593 in MI) — a middle-class / working-renter tenant base. Strengths: cost of living A+, housing A+; Watch: commute D+, schools F, crime F.
- Romulus Community Schools (suburban): math 9% / reading 21% proficiency, ranked #498 of 540 in MI (top 92%) — low school quality limits family demand, transient renter base, plan for 1-2y turnover; 69% free/reduced lunch — lower-income household profile, screen leases tightly.
- Market conditions: 215 active listings in the ZIP; 9 comparable units currently listed for rent nearby; rentals at typical pace (median 17d on market — plan ~3-4 weeks tenant-placement turnaround); 2,639 units permitted in Wayne County in 2024 (1,216 in 5+ unit buildings).
Forward outlook
- Local home prices are declining (-3.0%/yr); year-one equity from $622 of loan paydown is wiped out by about $3k of value loss. Plan a longer hold.
- Wayne County population projected at -17% by 2050 — secular population decline; favor cash flow + early exit over multi-decade hold.
- At projected returns (-3.0% appreciation + 3.0% rent growth), your $25k cash investment doubles in ~6 years — after that, you're playing with house money.
Negotiation context
- It's been on market 58 days — a 3% lower offer ($87k) is reasonable based on typical stale-listing flexibility.
- 4 sale attempts; this cycle's ask has dropped $10k (10%) from the opening price — seller is motivated, your offer sets the floor, not the list.
Risks & watch-outs
- Watch-outs: built in 1950 — expect roof / HVAC / electrical / plumbing capex.
Questions for the listing agent
- It's been on market 58 days. Have you received any prior offers? Is the seller open to a 3% concession, seller financing, or rate buy-down credit?
- Built in 1950 — when were the roof, HVAC, electrical panel, plumbing, and water heater last replaced?
- Is there a deadline driving the sale (1031 exchange, divorce, estate, relocation)? That informs how much negotiation room exists.
- Schools are F-rated, which usually means shorter tenancies and higher turnover. Who's the typical renter profile here, and what's been the actual vacancy rate?
- Crime grade is F in this area — have there been break-ins, vandalism, or insurance claims at this property in the last 3 years? What carrier currently insures it and at what premium?
- What's the average days-on-market for RENTAL listings here right now (not sales)? A rising rental-DOM trend means longer vacancies and softer asking-rent achievability than the comps imply.
- What's the recent tenant-quality profile in this submarket — average credit score on applications, eviction rate, late-payment / NSF rate, and stable-employment percentage? A property-management company in the area should have these aggregated.
- How much new for-sale + rental construction is in the pipeline within 1–3 miles? Heavy new supply typically softens prices + rents 12–24 months out; constrained supply supports both.
Investment metrics
- 1% rule
- 1.53% ✓
- Cap rate
- 12.20%
- Cash-on-cash
- 21.11%
- DSCR
- 1.94
- GRM
- 5.4
CMA / ARV
- ARV (median comp)
- $172,023
- List price
- $89,900
- Delta
- -47.74%
- Verdict
- UNDERPRICED
- Comps
- 20 within 1.0 mi
Show comp detail 9 sales within ~0.75 mi
| Address | Dist | Beds/Ba | Sqft | Sold | Price | $/sf | Match |
|---|---|---|---|---|---|---|---|
| 35815 Cypress St | 0.33mi | 2/1.0 (-1) | 966 (-11%) | 1mo | $192,400 | $199 | 61 |
| 6556 Washington St | 0.56mi | 3/1.0 | 1,050 (-3%) | 12mo | $175,000 | $167 | 59 |
| 6914 Arlene Ct | 0.46mi | 3/2.0 | 1,200 (+11%) | 1mo | $159,900 | $133 | 56 |
| 35411 Vinewood St | 0.47mi | 2/1.0 (-1) | 1,034 (-4%) | 15mo | $219,000 | $212 | 53 |
| 5087 Hunt St | 0.68mi | 3/1.0 | 950 (-12%) | 1mo | $175,000 | $184 | 47 |
| 5309 Williams St | 0.69mi | 2/1.0 (-1) | 1,140 (+5%) | 11mo | $161,000 | $141 | 45 |
| 6080 Biddle St | 0.50mi | 3/1.0 | 976 (-10%) | 19mo | $160,000 | $164 | 44 |
| 5222 Williams St | 0.72mi | 2/1.0 (-1) | 1,056 (-2%) | 22mo | $145,000 | $137 | 39 |
| 35241 Phyllis St | 0.71mi | 3/1.0 | 1,026 (-5%) | 23mo | $157,500 | $154 | 39 |
Match score weights: distance 35% · size 25% · config 20% · recency 20%. Top-matched comps best support the ARV.
Projected returns pro-forma
-3.0% appreciation · 3.0% rent growth · sell at horizon
- IRR
- 13.6%
- Equity multiple
- 1.54×
- Total profit
- $13,672
- Equity at exit
- $13,404
- IRR
- 22.4%
- Equity multiple
- 2.92×
- Total profit
- $48,369
- Equity at exit
- $7,773
Cash invested: $25,172 (down + closing). Projections, not guarantees.
Landlord ↔ Tenant lean methodology
- Overall (STATE)
- 62 Landlord-Friendly
- State Michigan
- 62 Landlord-Friendly · EVEN
- County
- — inherits STATE
- City
- — inherits STATE
ZIP-level market 48174
- Active inventory
- 215
- Price-to-rent
- 5.4×
Monthly cashflow live
- Estimated rent
- $1,378 high interval (Pro) →
- Mortgage (P&I)
- −$471
- Tax from tax record
- −$137 /mo · $1,640/yr
- Insurance
- −$37
- HOA
- −$0
- Vacancy / Maint / Mgmt
- −$289
- Net cashflow
- $443
Break-even live
UW: 25.0% down · 7.5% · 30yr · 1.5% tax · 5.0% vac · 8.0% maint · 8.0% mgmt
Financing live
Cash to close
- Down payment
- $22,475
- Closing costs
- $2,697
- Reserves months
- —
- Total cash needed
- —
Loan-product check · same deal, 3 products live
Conventional
25% down · 7.5% · 30yr
- Down + closing
- —
- Monthly P&I
- —
- Monthly cashflow
- —
- DSCR
- —
- Eligible?
- —
Personal DTI + credit; lowest rate.
DSCR
20% down · 8.5% · 30yr
- Down + closing
- —
- Monthly P&I
- —
- Monthly cashflow
- —
- DSCR
- —
- Eligible?
- —
No personal income docs; deal must DSCR.
Hard money
10% down · 12.0% · 12mo
- Down + closing
- —
- Monthly P&I
- —
- Monthly cashflow
- —
- DSCR
- —
- Eligible?
- —
Short-term bridge; refi at stabilization.
Rent comps 9 comps
| Address | Beds | Baths | Sqft | Rent | $/sqft | DOM | Units | Dist |
|---|---|---|---|---|---|---|---|---|
| 35390 Van Born Rd #103 Wayne, MI | 2.0 | 1.0 | 925 | $1,100 | $1.19 | 43d | 1 | 0.68mi |
| 5228 Fletcher St Wayne, MI | 3.0 | 1.0 | 900 | $1,750 | $1.94 | 1d | 1 | 0.73mi |
| 34510 Van Born Rd Wayne, MI | 2.0 | 1.0 | 990 | $1,325 | $1.34 | 14d | 1 | 0.98mi |
| 4332 Biddle St Wayne, MI | 3.0 | 2.0 | 1176 | $1,525 | $1.30 | 43d | 1 | 1.19mi |
| 5672 Howe Rd Unit 15 Wayne, MI | 2.0 | 1.0 | 700 | $850 | $1.21 | 18d | 1 | 1.25mi |
| 35505 E Michigan Ave Unit 1 Wayne, MI | 2.0 | 1.0 | 780 | $775 | $0.99 | 43d | 1 | 1.39mi |
| 7040 Shawnee Dr Romulus, MI | 2.0–3.0 | 1.0–2.0 | 1136 | $1,399 | $1.23 | 1d | 1 | 1.42mi |
| 4924 Howe Rd Wayne, MI | 3.0 | 1.0 | 1022 | $1,300 | $1.27 | 17d | 1 | 1.42mi |
| 35700 E Michigan Ave Wayne, MI | 2.0 | 1.0 | 701 | $1,060 | $1.51 | 5d | 6 | 1.42mi |
Listing history 20 events
-
2026-06-18days on market $89,900 Active 58 DOM
-
2026-06-17days on market $89,900 Active 57 DOM
-
2026-06-16days on market $89,900 Active 56 DOM
-
2026-06-15days on market $89,900 Active 55 DOM
-
2026-06-13days on market $89,900 Active 53 DOM
-
2026-06-13days on market $89,900 Active 52 DOM
-
2026-06-09days on market $89,900 Active 49 DOM
-
2026-06-08days on market $89,900 Active 48 DOM
-
2026-06-07days on market $89,900 Active 47 DOM
-
2026-06-04days on market $89,900 Active 44 DOM
-
2026-06-03days on market $89,900 Active 43 DOM
-
2026-06-02pricedays on market $89,900 Active 42 DOM
-
2026-06-01days on market $99,900 Active 41 DOM
-
2026-05-31days on market $99,900 Active 40 DOM
-
2026-05-05status Active 527-char remark
Show marketing remark (537 chars)
6299 Hunt is a fantastic opportunity for renovators, or buyers looking to create their dream home from the ground up. This property offers solid potential with a spacious layout and a desirable location, making it the perfect canvas for your vision. While the home does need work, it provides a rare chance to customize every detail to your taste and add significant value. With the right updates and improvements, 6299 Hunt can truly shine—don’t miss the chance to transform this diamond in the rough into something special.
-
2026-05-05status Active 537-char remark
Show marketing remark (537 chars)
6299 Hunt is a fantastic opportunity for renovators, or buyers looking to create their dream home from the ground up. This property offers solid potential with a spacious layout and a desirable location, making it the perfect canvas for your vision. While the home does need work, it provides a rare chance to customize every detail to your taste and add significant value. With the right updates and improvements, 6299 Hunt can truly shine—don’t miss the chance to transform this diamond in the rough into something special.
-
2026-04-23status Pending 527-char remark
Show marketing remark (537 chars)
6299 Hunt is a fantastic opportunity for renovators, or buyers looking to create their dream home from the ground up. This property offers solid potential with a spacious layout and a desirable location, making it the perfect canvas for your vision. While the home does need work, it provides a rare chance to customize every detail to your taste and add significant value. With the right updates and improvements, 6299 Hunt can truly shine—don’t miss the chance to transform this diamond in the rough into something special.
-
2026-04-23status Pending 537-char remark
Show marketing remark (537 chars)
6299 Hunt is a fantastic opportunity for renovators, or buyers looking to create their dream home from the ground up. This property offers solid potential with a spacious layout and a desirable location, making it the perfect canvas for your vision. While the home does need work, it provides a rare chance to customize every detail to your taste and add significant value. With the right updates and improvements, 6299 Hunt can truly shine—don’t miss the chance to transform this diamond in the rough into something special.
-
2026-04-09$99,900 Active 537-char remark
Show marketing remark (527 chars)
6299 Hunt is a fantastic opportunity for renovators, or buyers looking to create their dream home from the ground up. This property offers solid potential with a spacious layout and a desirable location, making it the perfect canvas for your vision. While the home does need work, it provides a rare chance to customize every detail to your taste and add significant value. With the right updates and improvements, 6299 Hunt can truly shine - don't miss the chance to transform this diamond in the rough into something special.
-
2026-04-09$99,900 Active 527-char remark
Show marketing remark (527 chars)
6299 Hunt is a fantastic opportunity for renovators, or buyers looking to create their dream home from the ground up. This property offers solid potential with a spacious layout and a desirable location, making it the perfect canvas for your vision. While the home does need work, it provides a rare chance to customize every detail to your taste and add significant value. With the right updates and improvements, 6299 Hunt can truly shine - don't miss the chance to transform this diamond in the rough into something special.
ⓘ Source: listings_history table (triggers on properties + properties_extension) + one-shot
backfill from property_details.listing_events for pre-trigger history.
Tax reassessment forecast MI · Partial reset (capped growth)
- Current annual tax
- $1,640 · $137/mo
- Projected year-2 tax
- $1,640 · $137/mo
- Expected delta
- $0/yr ($0/mo · 0.0%)
ⓘ Screening estimate from a state-policy table — verify with the county assessor before closing.
Climate risk First Street
- Flood 1/10 Low FEMA zone X (unshaded) · 0% chance over 30 yrs
- Wildfire 3/10 Moderate
- Heat 3/10 Moderate 7 d/yr ≥97°F today · 15 d/yr by 30 yrs out
- Wind 2/10 Low
- Air quality 2/10 Low 1 unhealthy d/yr today · 3 by 30 yrs out
Nearby sold comps map
Loading sold comps map…
Walkable amenities ~0.75 mi
Loading nearby amenities…
Taxation est. · year 1
- Rental income
- $16,533
- − Mortgage interest
- −$5,036
- − Property taxes
- −$1,640
- − Insurance
- −$450
- − Repairs & maintenance
- −$1,323
- − Management
- −$1,323
- − Depreciation
- −$2,615
- Taxable income
- $4,147
- Est. tax owed @ 24.0%
- −$995
- After-tax cash flow
- $4,319/yr
For passive investors: Depreciation is non-cash, so a rental often shows a tax loss while cash-flowing — sheltering income. Rental losses are passive: they offset passive income freely, and up to $25,000/yr can offset ordinary (W-2) income if you actively participate and your MAGI is under $100k (phasing out to $0 by $150k); unused losses carry forward. On sale, claimed depreciation is recaptured at up to 25%, and gains may owe capital-gains tax (a 1031 exchange can defer both). Figures are a year-1 estimate at your 24.0% rate — not tax advice; consult a CPA.
Schools (NCES district)
- District
- Romulus Community Schools
- NCES district ID
- 2630120
- Math proficiency
- 9% ▼ -14.00%
- Reading proficiency
- 21% ▼ -9.00%
- Median HH income
- $44,165
- Composite
- 13.17/100
- National rank
- #9556
- State rank
- #498 of 540 in MI
Livability — Romulus
- Score
- 60/100
- State rank
- #593
- US rank
- #19387
Category grades
Schools grade is shown separately in the Schools card above.
Census & demographics
- Census place
- Romulus, MI
- County
- Wayne County · 1,562,939 people
- City population
- 32,211
- Metro
- Detroit-Warren-Dearborn, MI
- Population (ZIP)
- 32,211
- Household income
- $67,056
- Rent vs Own
- Severe rent burden
- 755.0
Population outlook (Wayne County) Hauer SSP2
- Today (2025)
- 1,675,273 people
- By 2030
- 1,620,300 · -3.3%
- By 2040
- 1,502,341 · -10.3%
- By 2050
- 1,384,039 · -17.4%
- By 2075
- 1,124,592 · -32.9%
- By 2100
- 881,193 · -47.4%
Race, ethnicity, and origin ACS 2023
- Neighborhood character
- Diverse neighborhood (Simpson 0.59)
- Race & ethnicity
- White 52% Black 37% Two or more races 8% Hispanic / Latino 2% Asian 1%
- Common ancestry
- Romanian 6% Lithuanian 3% Italian 2%
- Foreign-born
- 4% · Canada, Vietnam
- Languages at home
- 94% English-only · Spanish 2% Other Indo-European 1% Other Asian/Pacific 1%
Political lean MEDSL · Wayne
- 2024 margin
- Strong D (+29.0) · D 62.7% · R 33.7% · Other 3.6%
- 2008→2024 swing
- -20.5pp toward R · 2008: 49.5pp · 2024: 29.0pp
- All cycles
- 2024: D+29.0 2020: D+38.1 2016: D+37.3 2012: D+46.9 2008: D+49.5
Not yet ingested
- Civics
- —
Market trends
- HPI YoY
- ▼ -171.93%
- Current HPI
- 207.8345
- Rent YoY
- —
- Metro
- Detroit-Warren-Dearborn, MI
- State GDP YoY
- ▲ 1.37%
- F500 in state
- 28
Industry mix (Fortune 500 HQ in MI)
| Industry | F500 HQs | Revenue |
|---|---|---|
| Automotive Parts | 3 | $48B |
|
||
| Automotive | 2 | $372B |
|
||
| Chemicals | 1 | $45B |
|
||
| Automotive Retail | 1 | $29B |
|
||
| Healthcare / Medical Devices | 1 | $23B |
|
||
| Automotive Technology | 1 | $20B |
|
||
Price history
+0.0% since first listed6 events — show timeline
- 2026-05-05 Relisted — MiRealSource-MiMLS
- 2026-05-05 Relisted — REALCOMP
- 2026-04-23 Pending — MiRealSource-MiMLS
- 2026-04-23 Pending — REALCOMP
- 2026-04-09 Listed $99,900 REALCOMP
- 2026-04-09 Listed $99,900 MiRealSource-MiMLS
Property tax history
+2.3%/yrLatest (2025): $1,640 · -56.1% YoY. Source: county tax records.
Cash-flow waterfall
monthlySold comps — $/sqft
last 12 mo · ≤1 miLoading sold comps…