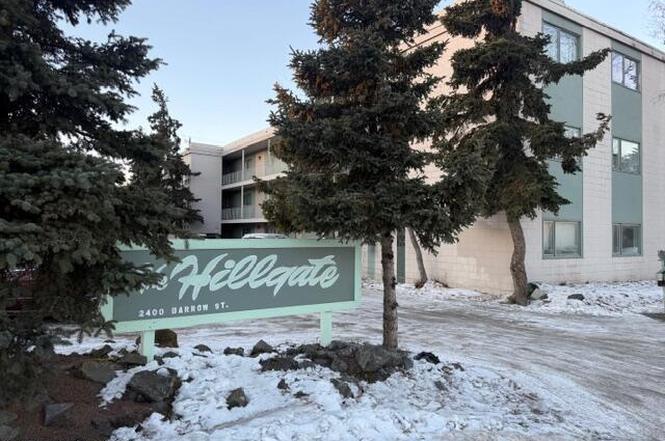
2400 Barrow St #202 · Anchorage, AK
Flood risk 1/10 · Minimal
- FEMA flood zone
- X (unshaded)
- Chance of flooding over 30 yrs
- 0.0%
- Est. flood insurance / yr
- $507 – $1,088
Fire risk No data
- Est. fire insurance / yr
- —
Heat risk No data
- Hot days now (above threshold)
- —
- Hot days in 30 yrs
- —
Wind risk No data
- Chance of severe wind over 30 yrs
- —
Air-quality risk 1/10 · Minimal
- Unhealthy air days now
- —
- Unhealthy air days in 30 yrs
- —
Risk factors via First Street. Map © Google.
Why this score? — see what drove the D grade
The composite is a weighted blend of 9 inputs, each scored 0–100. Each bar is that input's sub-score; the figure is the points it added to the 100-point composite (weight × sub-score).
- ARV discount +7.5/15.0
- 1% rule +7.1/10.0
- Appreciation +6.5/10.0
- Cash flow +5.8/30.0
- Livability +3.9/5.0
- Schools +3.7/10.0
- Rent growth +3.1/5.0
- Condition / age +2.5/5.0
- DSCR +0.2/10.0
$110,000
🖨 Deal sheet (PDF) 📄 Offer letter ✓ Due diligence
Listing remarks
Cozy 1-bedroom, 1-bath condo in a prime Central Midtown location. Enjoy north-facing views toward downtown and a private balcony off the living room. Condo dues include all utilities incl. electricity & heat for added value and convenience. Coin up laundry in the building.
Key facts
- North-facing views
- Private balcony
- $510 HOA
Tags
Neighborhood map
What this means for you Summary
Snapshot
- This is a 1-bed/1.0-bath condo listed at $110k.
Deal economics
- At list price, monthly cash flow is $-220 ($-3k/yr) — negative.
- To cash-flow at today's rent, offer at most $71k (35.3% below list).
- Meets the 1% rule at list price ($1k rent vs $110k).
- Recommended offer: $71k (35.3% below list) — sets the bar for cash-flow.
Location & tenants
- Location reads 78/100 on livability (#6 in AK, #2,553 nationally) — a middle-class / working-renter tenant base. Strengths: amenities A+, commute A+, employment A+; Watch: crime F, cost of living F.
- Anchorage School District (urban): math 37% / reading 43% proficiency, ranked #6 of 21 in AK (top 29%) — families likely to look elsewhere, expect single-tenant / working-renter base with shorter leases.
- Zoned schools: North Star Elementary (math 12% / reading 17%, grade F, #146 of 156 statewide, top 95%, 391 students, 0% FRL); Romig Middle School (math 24% / reading 44%, grade F, #22 of 36 statewide, top 63%, 720 students, 37% FRL); West High School (math 32% / reading 27%, grade F, #39 of 61 statewide, top 65%, 1,763 students, 40% FRL).
- Zoned-school proficiency averages 26% at this address vs 40% district-wide (-14 pts) — the specific schools serving this property underperform the Anchorage School District average; the district grade overstates school quality for this exact location.
- Market conditions: Rents rising (+2.3%/yr); 67 active listings in the ZIP; 34 comparable units currently listed for rent nearby; rentals at typical pace (median 26d on market — plan ~3-4 weeks tenant-placement turnaround); solid renter incomes; 306 units permitted in Anchorage Municipality in 2024 (90 in 5+ unit buildings).
Forward outlook
- In year one you build about $4k of equity ($761 loan paydown + $3k appreciation (3.1% local appreciation)).
- Anchorage County population projected at +12% by 2050 — modest demand growth; plan on rents tracking national, not racing it.
- By year 8, paydown + projected appreciation supports a ~$31k cash-out refi (75% LTV) — recoverable capital for the next deal without selling this one.
Negotiation context
- It's been on market 66 days — a 6% lower offer ($103k) is reasonable based on typical stale-listing flexibility.
- 2 sale attempts since 30y ago with the ask held roughly flat each time — persistent listings suggest the price (not the market) is what's stuck; bring a comps-based counter.
Risks & watch-outs
- Watch-outs: HOA is 38% of rent.
Questions for the listing agent
- What do current leases actually rent for vs. the listed asking? Can we see a recent rent roll and the last 12 months of T-12 income?
- It's been on market 66 days. Have you received any prior offers? Is the seller open to a 35% concession, seller financing, or rate buy-down credit?
- Built in 1965 — when were the roof, HVAC, electrical panel, plumbing, and water heater last replaced?
- What does the HOA fee cover, when was the last increase, and are there any pending special assessments or reserve-fund shortfalls?
- Any open or pending special assessments — roof, HVAC, plumbing, elevator, façade? What's the per-unit balance and payoff schedule, and is the seller paying it off at close or rolling it to the buyer?
- Why hasn't it sold? Are there any deal-killer items the seller is aware of (foundation, flood, title, zoning, code violations)?
- Is there a deadline driving the sale (1031 exchange, divorce, estate, relocation)? That informs how much negotiation room exists.
- Schools are B-rated — typically a magnet for longer-tenancy family renters. What's the average tenant stay here, and is there a school-zone premium baked into asking?
- Crime grade is F in this area — have there been break-ins, vandalism, or insurance claims at this property in the last 3 years? What carrier currently insures it and at what premium?
- The area grade is low — what's the realistic commute time and amenity access for the typical tenant pool here? Any planned neighborhood developments (good or bad) we should know about?
- What's the average days-on-market for RENTAL listings here right now (not sales)? A rising rental-DOM trend means longer vacancies and softer asking-rent achievability than the comps imply.
- What's the recent tenant-quality profile in this submarket — average credit score on applications, eviction rate, late-payment / NSF rate, and stable-employment percentage? A property-management company in the area should have these aggregated.
- How much new apartment / multifamily construction is in the pipeline within 1–3 miles? Heavy new supply (>2% of stock underway) typically softens rents 12–24 months out; light construction supports rent growth.
Investment metrics
- 1% rule
- 1.21% ✓
- Cap rate
- 3.90%
- Cash-on-cash
- -8.56%
- DSCR
- 0.62
- GRM
- 6.9
CMA / ARV
No comps found within radius.
Projected returns pro-forma
3.1% appreciation · 2.28% rent growth · sell at horizon
- IRR
- -0.4%
- Equity multiple
- 0.97×
- Total profit
- $-785
- Equity at exit
- $50,078
- IRR
- 3.2%
- Equity multiple
- 1.50×
- Total profit
- $15,275
- Equity at exit
- $77,659
Cash invested: $30,800 (down + closing). Projections, not guarantees.
Landlord ↔ Tenant lean methodology
- Overall (STATE)
- 80 Strongly Landlord-Friendly
- State Alaska
- 80 Strongly Landlord-Friendly · R+8
- County
- — inherits STATE
- City
- — inherits STATE
ZIP-level market 99503
- Home prices YoY
- 1.3%
- Rents YoY
- 2.3%
- Active inventory
- 67
- Price-to-rent
- 6.9×
Monthly cashflow live
- Estimated rent
- $1,335 high interval (Pro) →
- Mortgage (P&I)
- −$577
- Tax from tax record
- −$142 /mo · $1,702/yr
- Insurance
- −$46
- HOA
- −$510
- Vacancy / Maint / Mgmt
- −$280
- Net cashflow
- $-220
Break-even live
Sensitivity live
| Price | -10% $-157 | -5% $-189 | +0% $-220 | +5% $-251 | +10% $-282 |
|---|---|---|---|---|---|
| Rent | -10% $-325 | -5% $-272 | +0% $-220 | +5% $-167 | +10% $-114 |
| Rate | -1.0pp $-164 | -0.5pp $-192 | base $-220 | +0.5pp $-248 | +1.0pp $-277 |
UW: 25.0% down · 7.5% · 30yr · 1.5% tax · 5.0% vac · 8.0% maint · 8.0% mgmt
Financing live
Cash to close
- Down payment
- $27,500
- Closing costs
- $3,300
- Reserves months
- —
- Total cash needed
- —
Loan-product check · same deal, 3 products live
Conventional
25% down · 7.5% · 30yr
- Down + closing
- —
- Monthly P&I
- —
- Monthly cashflow
- —
- DSCR
- —
- Eligible?
- —
Personal DTI + credit; lowest rate.
DSCR
20% down · 8.5% · 30yr
- Down + closing
- —
- Monthly P&I
- —
- Monthly cashflow
- —
- DSCR
- —
- Eligible?
- —
No personal income docs; deal must DSCR.
Hard money
10% down · 12.0% · 12mo
- Down + closing
- —
- Monthly P&I
- —
- Monthly cashflow
- —
- DSCR
- —
- Eligible?
- —
Short-term bridge; refi at stabilization.
Rent comps 34 comps
| Address | Beds | Baths | Sqft | Rent | $/sqft | DOM | Units | Dist |
|---|---|---|---|---|---|---|---|---|
| 2326 Cordova St Unit 1 5 Anchorage, AK | 1.0 | 1.0 | 600 | $1,500 | $2.50 | 46d | 1 | 0.08mi |
| 518 E 22nd Ave #7 Anchorage, AK | 1.0 | 1.0 | 589 | $1,250 | $2.12 | 46d | 1 | 0.28mi |
| 423 W 22nd Ave Anchorage, AK | 1.0–2.0 | 1.0–2.0 | 794 | $1,350 | $1.70 | 16d | 6 | 0.29mi |
| 2225 Arctic Blvd Anchorage, AK | 2.0 | 1.0 | 682 | $1,460 | $2.14 | 16d | 6 | 0.50mi |
| 201 E 16th Ave Anchorage, AK | 2.0 | 1.0 | 626 | $1,338 | $2.14 | 16d | 6 | 0.52mi |
| 234 E 15th Ave Anchorage, AK | 2.0 | 1.0 | 609 | $1,342 | $2.20 | 16d | 6 | 0.58mi |
| 540 Vista Glen Ct Apt 3 Anchorage, AK | 1.0 | 1.0 | 600 | $1,125 | $1.88 | 46d | 1 | 0.62mi |
| 601 W 32nd Ave Anchorage, AK | 1.0 | 1.0 | 487 | $1,225 | $2.51 | 46d | 4 | 0.63mi |
| 907 W 27th Ave Unit 3 Anchorage, AK | 1.0 | 1.0 | 600 | $1,275 | $2.12 | 46d | 1 | 0.64mi |
| 915 W 27th Ave Anchorage, AK | 2.0 | 1.0 | 570 | $1,285 | $2.25 | 16d | 14 | 0.64mi |
| 3321 Eureka St Anchorage, AK | 1.0 | 1.0 | 387 | $1,280 | $3.31 | 16d | 4 | 0.70mi |
| 612 E 14th Ave Unit 22 Anchorage, AK | 1.0 | 1.0 | 500 | $1,050 | $2.10 | 46d | 1 | 0.73mi |
| 1315 Cordova St Anchorage, AK | — | 1.0 | 453 | $975 | $2.15 | 25d | 1 | 0.73mi |
| 1315 Cordova St Anchorage, AK | 1.0 | 1.0 | 641 | $1,100 | $1.72 | 16d | 1 | 0.73mi |
| 1335 Hyder St Unit 2 Anchorage, AK | 1.0 | 1.0 | 450 | $1,095 | $2.43 | 23d | 1 | 0.83mi |
| 1101 B St Anchorage, AK | 1.0–2.0 | 1.0–2.0 | 800 | $2,450 | $3.06 | 16d | 4 | 0.86mi |
| 1336 W 23rd Ave Anchorage, AK | — | 1.0 | 450 | $995 | $2.21 | 46d | 1 | 0.89mi |
| 524 E 11th Ave Anchorage, AK | 1.0 | 1.0 | 745 | $1,300 | $1.74 | 16d | 1 | 0.90mi |
| 2201 Romig Pl Anchorage, AK | 1.0 | 1.0 | 530 | $1,500 | $2.83 | 46d | 1 | 0.92mi |
| 1601 Medfra St Anchorage, AK | 2.0 | 1.0–2.0 | 625 | $1,338 | $2.14 | 25d | 10 | 0.97mi |
| 1473 W 25th Ave Anchorage, AK | 1.0 | 1.0 | 485 | $1,290 | $2.66 | 16d | 3 | 1.02mi |
| 1441 E 12th Ave Apt 2 Anchorage, AK | 1.0 | 1.0 | 500 | $1,395 | $2.79 | 16d | 1 | 1.21mi |
| 3061 Lois Dr Anchorage, AK | 1.0 | 1.0 | 567 | $1,475 | $2.60 | 25d | 2 | 1.24mi |
| 618 Gambell St Unit 33 Anchorage, AK | 1.0 | 1.0 | 600 | $1,300 | $2.17 | 46d | 1 | 1.24mi |
| 618 Gambell St Unit 23 Anchorage, AK | 1.0 | 1.0 | 600 | $1,300 | $2.17 | 25d | 1 | 1.24mi |
| 1000 W 8th Ave Anchorage, AK | 1.0 | 1.0 | 528 | $2,600 | $4.92 | 46d | 1 | 1.26mi |
| 4255 Old Seward Hwy Anchorage, AK | 1.0 | 1.0 | 550 | $1,200 | $2.18 | 16d | 1 | 1.27mi |
| 3051 Lois Dr #508 Anchorage, AK | 1.0 | 1.0 | 580 | $1,400 | $2.41 | 46d | 1 | 1.28mi |
| 925 W 7th Ave Unit 415 Anchorage, AK | 1.0 | 1.0 | 630 | $1,350 | $2.14 | 16d | 1 | 1.31mi |
| 337 E 4th Ave Anchorage, AK | 1.0 | 1.0 | 678 | $1,500 | $2.21 | 46d | 1 | 1.38mi |
| 1110 W 6th Ave #302 Anchorage, AK | 1.0 | 1.0 | 540 | $2,500 | $4.63 | 25d | 1 | 1.42mi |
| 540 L St Anchorage, AK | 1.0–2.0 | 1.0–2.0 | 885 | $2,600 | $2.94 | 16d | 3 | 1.44mi |
| 3606 Oregon Dr Unit 5 Anchorage, AK | 1.0 | 1.0 | 650 | $1,425 | $2.19 | 16d | 1 | 1.47mi |
| 201 Barrow St #305 Anchorage, AK | 1.0 | 1.0 | 711 | $2,800 | $3.94 | 46d | 1 | 1.47mi |
HOA detail condo
- Monthly dues
- $510 · $6,120/yr
- Likely covers
- electric
- Assessments
- None detected in remarks — confirm with the listing agent.
Listing history 5 events
-
2026-04-16status Pending
-
2026-02-07$110,000 Active
-
2002-07-05soldstatus
-
1996-07-27$48,000
-
1993-10-01soldstatus
ⓘ Source: listings_history table (triggers on properties + properties_extension) + one-shot
backfill from property_details.listing_events for pre-trigger history.
Tax reassessment forecast AK · Partial reset (capped growth)
- Current annual tax
- $1,702 · $142/mo
- Projected year-2 tax
- $1,702 · $142/mo
- Expected delta
- $0/yr ($0/mo · 0.0%)
ⓘ Screening estimate from a state-policy table — verify with the county assessor before closing.
Climate risk First Street
- Flood 1/10 Low FEMA zone X (unshaded) · 0% chance over 30 yrs
- Air quality 1/10 Low
Nearby sold comps map
Loading sold comps map…
Walkable amenities ~0.75 mi
Loading nearby amenities…
Taxation est. · year 1
- Rental income
- $16,023
- − Mortgage interest
- −$6,162
- − Property taxes
- −$1,702
- − Insurance
- −$550
- − Repairs & maintenance
- −$1,282
- − Management
- −$1,282
- − HOA
- −$6,120
- − Depreciation
- −$3,200
- Taxable loss
- −$4,275
- Est. tax savings @ 24.0%
- +$1,026
- After-tax cash flow
- $-1,610/yr
For passive investors: Depreciation is non-cash, so a rental often shows a tax loss while cash-flowing — sheltering income. Rental losses are passive: they offset passive income freely, and up to $25,000/yr can offset ordinary (W-2) income if you actively participate and your MAGI is under $100k (phasing out to $0 by $150k); unused losses carry forward. On sale, claimed depreciation is recaptured at up to 25%, and gains may owe capital-gains tax (a 1031 exchange can defer both). Figures are a year-1 estimate at your 24.0% rate — not tax advice; consult a CPA.
Schools (NCES district)
- District
- Anchorage School District
- NCES district ID
- 0200180
- Math proficiency
- 37% ▼ -2.00%
- Reading proficiency
- 43% ▲ 1.00%
- Median HH income
- $76,447
- Composite
- 37.0/100
- National rank
- #4523
- State rank
- #6 of 21 in AK
Livability — Anchorage
- Score
- 78/100
- State rank
- #6
- US rank
- #2553
Category grades
Schools grade is shown separately in the Schools card above.
Census & demographics
- Census place
- Anchorage, AK
- County
- Anchorage Borough · 246,594 people
- City population
- 218,117
- Metro
- Anchorage, AK
- Population (ZIP)
- 12,964
- Household income
- $76,144
- Rent vs Own
- Severe rent burden
- 747.0
Population outlook (Anchorage County) Hauer SSP2
- Today (2025)
- 314,993 people
- By 2030
- 321,771 · +2.2%
- By 2040
- 335,493 · +6.5%
- By 2050
- 352,799 · +12.0%
- By 2075
- 414,771 · +31.7%
- By 2100
- 474,485 · +50.6%
Race, ethnicity, and origin ACS 2023
- Neighborhood character
- Highly diverse neighborhood (Simpson 0.78)
- Race & ethnicity
- White 43% Asian 15% Native American 15% Two or more races 13% Hispanic / Latino 8% Black 8% Pacific Islander 1%
- Hispanic origin (detail)
- Mexican 4%
- Common ancestry
- Lithuanian 2% Slovak 2% Romanian 2%
- Foreign-born
- 17% · Canada, Jamaica, China
- Languages at home
- 75% English-only · Tagalog/Filipino 9% Spanish 6% Other Asian/Pacific 3%
Political lean MEDSL · Anchorage
- 2024 margin
- D (+12.7) · D 56.3% · R 43.7%
- 2016→2024 swing
- +27.9pp toward D · 2016: -15.2pp · 2024: 12.7pp
- All cycles
- 2024: D+12.7 2016: R+15.2
Not yet ingested
- Civics
- —
Market trends
- HPI YoY
- ▲ 3.10%
- Current HPI
- 238.2191
- Rent YoY
- ▲ 2.28%
- Metro
- Anchorage, AK
- State GDP YoY
- —
- F500 in state
- 0
Price history
+129.2% since first listed5 events — show timeline
- 2026-04-16 Pending — AKMLS
- 2026-02-07 Listed $110,000 AKMLS
- 2002-07-05 Sold (Public Records) — Public Records
- 1996-07-27 Listed $48,000 AKMLS
- 1993-10-01 Sold (Public Records) — Public Records
Property tax history
+4.6%/yrLatest (2025): $1,702 · +44.2% YoY. Source: county tax records.
Cash-flow waterfall
monthlySold comps — $/sqft
last 12 mo · ≤1 miLoading sold comps…