 Duplex
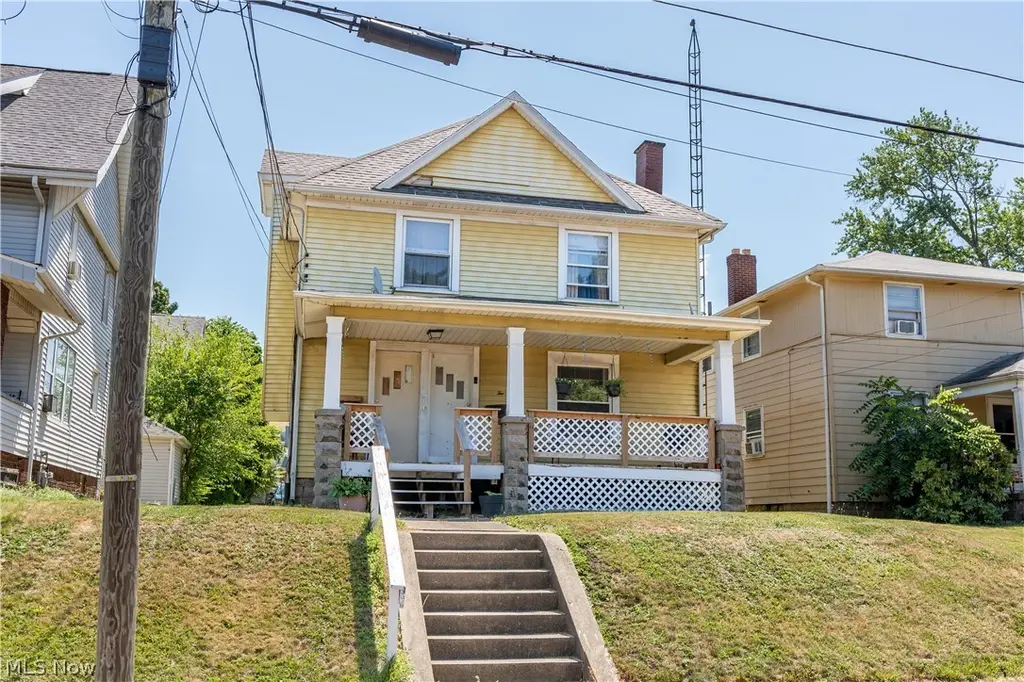
206 Ingram Ave SW · Canton, OH
Flood risk 1/10 · Minimal
- FEMA flood zone
- X (unshaded)
- Chance of flooding over 30 yrs
- 0.0%
- Est. flood insurance / yr
- $473 – $860
Fire risk 1/10 · Minimal
- Est. fire insurance / yr
- $713 – $1,323
Heat risk 3/10 · Minor
- Hot days now (above 96°F)
- 7 days/yr
- Hot days in 30 yrs
- 17 days/yr
Wind risk 1/10 · Minimal
- Chance of severe wind over 30 yrs
- —
Air-quality risk 2/10 · Minimal
- Unhealthy air days now
- 0 days/yr
- Unhealthy air days in 30 yrs
- 1 days/yr
Risk factors via First Street. Map © Google.
Why this score? — see what drove the B- grade
The composite is a weighted blend of 9 inputs, each scored 0–100. Each bar is that input's sub-score; the figure is the points it added to the 100-point composite (weight × sub-score).
- Cash flow +30.0/30.0
- 1% rule +10.0/10.0
- DSCR +10.0/10.0
- ARV discount +4.8/15.0
- Livability +3.6/5.0
- Rent growth +2.5/5.0
- Condition / age +2.5/5.0
- Schools +1.7/10.0
- Appreciation +0.0/10.0
$99,000
🖨 Deal sheet 📄 Offer letter ✓ Due diligence
Multi-family units
County records classify this as Multi-Family (2-4 Unit). Listing-text estimate: 2 units. confirmed
Listing remarks
Welcome to this fantastic duplex. Featuring upstairs and downstairs units with a split basement. A large covered front porch welcomes you to this charming home. The downstairs unit has a spacious family room with a decorative brick fireplace with wood accents. The kitchen features white cabinets, a range, a fridge, and a storage closet. This 1 bedroom unit has an abundance of natural light and a full bath. Finishing this unit is an unfinished basement with a laundry area. Upstairs is another charming 1 bedroom 1 bath unit. The kitchen has white cabinets and a small dining area. The long living room offers plenty of space. Finishing this unit is an unfinished basement with a laundry area and
Key facts
- Covered front porch
- Laundry area
- Unfinished basement
Tags
Property features AI
Finance
- Financial info: Both one-bedroom units currently leased (rents shown): $550 and $550; Lease expirations: one unit 03/31/2027, the other 05/31/2027
Exterior
- Parking: Unpaved parking area
- Utilities: Public water; Public sewer
- Home design: Two-story building; Property contains one building; About 1,463 above-grade finished area (source: assessor)
- Construction: Vinyl siding exterior; Asphalt/fiberglass roof
- Exterior features: Unpaved parking; Lot is approximately 0.137 acres
Interior
- Kitchen: Kitchens included in each unit
- Bedrooms: Two one-bedroom units (each unit leased)
- Bathrooms: Two full bathrooms (one in each unit)
- Heating & cooling: Gas heating
- Interior features: Full unfinished basement
- Laundry & utility: Laundry located in the basement
Neighborhood map
What this means for you Summary
Snapshot
- This is a 2 × 1-bed/1.0-bath units multifamily listed at $99k.
Deal economics
- At list price, monthly cash flow is $644 ($8k/yr) — positive. Per door: $322/mo.
- The deal already cash-flows at list — no discount required.
- Meets the 1% rule at list price ($2k rent vs $99k).
- Recommended offer: $96k (3.0% below list) — sets the bar for market timing.
- Cap rate 14.1% vs local median 5.1% in Canton — top-decile yield for the area; either an underpriced asset or a hidden risk that comps aren't pricing in. Stress-test before assuming the spread holds.
Location & tenants
- Location reads 71/100 on livability (#441 in OH) — a middle-class / working-renter tenant base. Strengths: commute A+, cost of living A+, housing A; Watch: crime F, employment F.
- Canton City (urban): math 17% / reading 26% proficiency, ranked #627 of 656 in OH (top 96%) — low school quality limits family demand, transient renter base, plan for 1-2y turnover; 76% free/reduced lunch — lower-income household profile, screen leases tightly.
- Market conditions: 48 active listings in the ZIP; 25 comparable units currently listed for rent nearby; rentals at typical pace (median 21d on market — plan ~3-4 weeks tenant-placement turnaround); 40% of comp listings sitting > 30 days — soft ceiling on asking rent; 528 units permitted in Stark County in 2024 (84 in 5+ unit buildings).
- This rent runs 42% of the median local income ($47k/yr) — at the standard rent-burdened threshold; future hikes will face affordability resistance.
Forward outlook
- Local home prices are declining (-3.0%/yr); year-one equity from $684 of loan paydown is wiped out by about $3k of value loss. Plan a longer hold.
- Stark County population projected to shrink 8% by 2050 — rents likely to lag national; underwrite the cash flow, not the appreciation.
- At projected returns (-3.0% appreciation + 3.0% rent growth), your $28k cash investment doubles in ~5 years — after that, you're playing with house money.
Negotiation context
- It's been on market 38 days — a 3% lower offer ($96k) is reasonable based on typical stale-listing flexibility.
- 7 sale attempts since 23y ago with the ask held roughly flat each time — persistent listings suggest the price (not the market) is what's stuck; bring a comps-based counter.
- Current owner paid $65k; list at $99k implies a 52% gain — meaningful room to come down on a strong offer.
Risks & watch-outs
- Watch-outs: built in 1912 — expect roof / HVAC / electrical / plumbing capex.
Questions for the listing agent
- It's been on market 38 days. Have you received any prior offers? Is the seller open to a 3% concession, seller financing, or rate buy-down credit?
- Can we see the unit-by-unit rent roll, current vacancy, and any below-market leases? What's the average tenancy length?
- What capital expenditures (roof, boiler, parking lot, exteriors) have been made in the last 5 years, and what's planned in the next 2?
- Built in 1912 — when were the roof, HVAC, electrical panel, plumbing, and water heater last replaced?
- Is there a deadline driving the sale (1031 exchange, divorce, estate, relocation)? That informs how much negotiation room exists.
- Crime grade is F in this area — have there been break-ins, vandalism, or insurance claims at this property in the last 3 years? What carrier currently insures it and at what premium?
- What's the average days-on-market for RENTAL listings here right now (not sales)? A rising rental-DOM trend means longer vacancies and softer asking-rent achievability than the comps imply.
- What's the recent tenant-quality profile in this submarket — average credit score on applications, eviction rate, late-payment / NSF rate, and stable-employment percentage? A property-management company in the area should have these aggregated.
- How much new apartment / multifamily construction is in the pipeline within 1–3 miles? Heavy new supply (>2% of stock underway) typically softens rents 12–24 months out; light construction supports rent growth.
Investment metrics
- 1% rule
- 1.65% ✓
- Cap rate
- 14.10%
- Cash-on-cash
- 27.89%
- DSCR
- 2.24
- GRM
- 5.0
CMA / ARV
- ARV (median comp)
- $93,388
- List price
- $99,000
- Delta
- 6.01%
- Verdict
- FAIR
- Comps
- 20 within 1.0 mi
Show comp detail 4 sales within ~0.75 mi
| Address | Dist | Beds/Ba | Sqft | Sold | Price | $/sf | Match |
|---|---|---|---|---|---|---|---|
| 2515 Grigsby Pl SW | 0.38mi | 3/2.0 (+1) | 1,516 (+4%) | 3mo | $90,000 | $59 | 69 |
| 1013 Maryland Ave SW | 0.37mi | 2/2.0 | 1,588 (+8%) | 6mo | $73,000 | $46 | 64 |
| 530 Rosemont Ct NW | 0.49mi | 3/2.0 (+1) | 1,400 (-4%) | 2mo | $124,900 | $89 | 63 |
| 2817 2nd St NW | 0.21mi | 3/2.0 (+1) | 1,636 (+12%) | 6mo | $55,000 | $34 | 61 |
Match score weights: distance 35% · size 25% · config 20% · recency 20%. Top-matched comps best support the ARV.
Projected returns pro-forma
-3.0% appreciation · 3.0% rent growth · sell at horizon
- IRR
- 22.0%
- Equity multiple
- 1.90×
- Total profit
- $24,990
- Equity at exit
- $14,761
- IRR
- 30.1%
- Equity multiple
- 3.69×
- Total profit
- $74,606
- Equity at exit
- $8,560
Cash invested: $27,720 (down + closing). Projections, not guarantees.
Landlord ↔ Tenant lean methodology
- Overall (STATE)
- 73 Landlord-Friendly
- State Ohio
- 73 Landlord-Friendly · R+6
- County
- — inherits STATE
- City
- — inherits STATE
ZIP-level market 44710
- Active inventory
- 48
- Price-to-rent
- 10.1×
Monthly cashflow live
- Estimated rent
- $1,638 high interval (Pro) →
- Mortgage (P&I)
- −$519
- Tax from tax record
- −$89 /mo · $1,073/yr
- Insurance
- −$41
- HOA
- −$0
- Vacancy / Maint / Mgmt
- −$344
- Net cashflow
- $644
Break-even live
2-unit breakdown (identical units grouped — click to expand)
| Units | Beds | Baths | Est. rent |
|---|---|---|---|
| 2× units | 1 | 1 | $1,638 |
| #1 | 1 | 1 | $819 |
| #2 | 1 | 1 | $819 |
| Total (2 units) | $1,638 | ||
UW: 25.0% down · 7.5% · 30yr · 1.5% tax · 5.0% vac · 8.0% maint · 8.0% mgmt
Financing live
Cash to close
- Down payment
- $24,750
- Closing costs
- $2,970
- Reserves months
- —
- Total cash needed
- —
Loan-product check · same deal, 3 products live
Conventional
25% down · 7.5% · 30yr
- Down + closing
- —
- Monthly P&I
- —
- Monthly cashflow
- —
- DSCR
- —
- Eligible?
- —
Personal DTI + credit; lowest rate.
DSCR
20% down · 8.5% · 30yr
- Down + closing
- —
- Monthly P&I
- —
- Monthly cashflow
- —
- DSCR
- —
- Eligible?
- —
No personal income docs; deal must DSCR.
Hard money
10% down · 12.0% · 12mo
- Down + closing
- —
- Monthly P&I
- —
- Monthly cashflow
- —
- DSCR
- —
- Eligible?
- —
Short-term bridge; refi at stabilization.
Rent comps 25 comps
| Address | Beds | Baths | Sqft | Rent | $/sqft | DOM | Units | Dist |
|---|---|---|---|---|---|---|---|---|
| 900 Roslyn Ave SW Canton, OH | 3.0 | 1.0 | 1320 | $1,175 | $0.89 | 13d | 1 | 0.36mi |
| 2316 2nd St SW Canton, OH | 3.0 | 1.0 | 1125 | $1,095 | $0.97 | 43d | 1 | 0.41mi |
| 1014 Roslyn Ave SW Canton, OH | 3.0 | 1.0 | 1128 | $1,150 | $1.02 | 21d | 1 | 0.42mi |
| 202 Smith Ave SW Canton, OH | 2.0 | 1.0 | 1236 | $995 | $0.81 | 43d | 1 | 0.46mi |
| 2237 Tuscarawas St W Canton, OH | 2.0 | 1.0 | 1035 | $700 | $0.68 | 21d | 1 | 0.48mi |
| 2237 Tuscarawas St W Unit 7 Canton, OH | 2.0 | 1.0 | 1035 | $725 | $0.70 | 43d | 1 | 0.48mi |
| 521 Columbus Ave NW Unit 2 Canton, OH | 2.0 | 1.0 | 900 | $875 | $0.97 | 43d | 1 | 0.51mi |
| 521 Columbus Ave NW Canton, OH | 2.0 | 1.0 | 900 | $775 | $0.86 | 21d | 1 | 0.51mi |
| 2525 6th St NW Unit NA Canton, OH | 2.0 | 1.0 | 950 | $700 | $0.74 | 43d | 1 | 0.53mi |
| 1117 Arlington Ave SW Canton, OH | 3.0 | 1.0 | 1240 | $1,200 | $0.97 | 13d | 1 | 0.60mi |
| 1023 Harrison Ave SW Canton, OH | 3.0 | 1.0 | 1224 | $1,250 | $1.02 | 21d | 1 | 0.66mi |
| 1241 Bedford Ave SW Canton, OH | 3.0 | 2.0 | 1152 | $1,200 | $1.04 | 13d | 1 | 0.70mi |
| 1005 Broad Ave NW Unit 201 Canton, OH | 3.0 | 1.0 | 1200 | $800 | $0.67 | 21d | 1 | 0.71mi |
| 1005 Broad Ave NW Unit 100 Canton, OH | 2.0 | 1.0 | 1200 | $850 | $0.71 | 21d | 1 | 0.71mi |
| 2510 10th St NW Canton, OH | 3.0 | 1.5 | 1468 | $1,175 | $0.80 | 21d | 1 | 0.73mi |
| 3034 12th St NW Canton, OH | 2.0 | 1.0 | 1724 | $1,125 | $0.65 | 21d | 1 | 0.83mi |
| 1229 Lawn Ave SW Canton, OH | 2.0 | 1.0 | 936 | $950 | $1.01 | 43d | 1 | 0.89mi |
| 1520 Bryan Ave SW Canton, OH | 3.0 | 1.0 | 1040 | $1,100 | $1.06 | 43d | 1 | 1.12mi |
| 1380 Garfield Ave SW Canton, OH | 2.0 | 1.0 | 1212 | $995 | $0.82 | 21d | 1 | 1.18mi |
| 1137 7th St NW Canton, OH | 3.0 | 1.0 | 1736 | $1,095 | $0.63 | 43d | 1 | 1.28mi |
| 1016 2nd St NW Canton, OH | 1.0–3.0 | 1.0–2.0 | 916 | $748 | $0.82 | 13d | 20 | 1.31mi |
| 2901 17th St NW Canton, OH | 2.0 | 1.0 | 1000 | $885 | $0.89 | 21d | 1 | 1.37mi |
| 1507 Stark Ave SW Canton, OH | 3.0 | 1.0 | 1188 | $975 | $0.82 | 43d | 1 | 1.38mi |
| 1511 Stark Ave SW Canton, OH | 2.0 | 1.0 | 992 | $900 | $0.91 | 43d | 1 | 1.39mi |
| 1511 Stark Ave SW Canton, OH | 1.0 | 1.0 | 992 | $900 | $0.91 | 13d | 1 | 1.39mi |
Listing history 32 events
-
2026-06-18days on market $99,000 Active 38 DOM
-
2026-06-17days on market $99,000 Active 37 DOM
-
2026-06-16days on market $99,000 Active 36 DOM
-
2026-06-15days on market $99,000 Active 35 DOM
-
2026-06-14days on market $99,000 Active 33 DOM
-
2026-06-13days on market $99,000 Active 32 DOM
-
2026-06-10days on market $99,000 Active 30 DOM
-
2026-06-09days on market $99,000 Active 29 DOM
-
2026-06-08days on market $99,000 Active 28 DOM
-
2026-06-07days on market $99,000 Active 27 DOM
-
2026-06-05days on market $99,000 Active 24 DOM
-
2026-06-03days on market $99,000 Active 23 DOM
-
2026-06-02days on market $99,000 Active 22 DOM
-
2026-06-01days on market $99,000 Active 21 DOM
-
2026-05-31days on market $99,000 Active 20 DOM
-
2026-05-30days on market $99,000 Active 19 DOM
-
2026-05-11$99,000 Active 771-char remark
-
2025-04-15historical
-
2025-01-10$129,900 Active
-
2024-12-29historical
-
2024-07-02$129,900 Active
-
2008-01-25historical
-
2007-10-25$74,900
-
2007-10-24historical
-
2007-04-17historical
-
2007-04-17$74,900
-
2006-10-17$79,900
-
2003-11-26soldstatus $65,300
-
2003-11-26soldstatus $65,300
-
2003-08-07$69,900
-
1995-08-04soldstatus $29,500
-
1992-04-03soldstatus $25,000
ⓘ Source: listings_history table (triggers on properties + properties_extension) + one-shot
backfill from property_details.listing_events for pre-trigger history.
Tax reassessment forecast OH · Partial reset (capped growth)
- Current annual tax
- $1,073 · $89/mo
- Projected year-2 tax
- $1,309 · $109/mo
- Expected delta
- +$236/yr (+$20/mo · 22.0%)
ⓘ Screening estimate from a state-policy table — verify with the county assessor before closing.
Climate risk First Street
- Flood 1/10 Low FEMA zone X (unshaded) · 0% chance over 30 yrs
- Wildfire 1/10 Low
- Heat 3/10 Moderate 7 d/yr ≥96°F today · 17 d/yr by 30 yrs out
- Wind 1/10 Low
- Air quality 2/10 Low 0 unhealthy d/yr today · 1 by 30 yrs out
Nearby sold comps map
Loading sold comps map…
Walkable amenities ~0.75 mi
Loading nearby amenities…
Taxation est. · year 1
- Rental income
- $19,656
- − Mortgage interest
- −$5,546
- − Property taxes
- −$1,073
- − Insurance
- −$495
- − Repairs & maintenance
- −$1,572
- − Management
- −$1,572
- − Depreciation
- −$2,880
- Taxable income
- $6,517
- Est. tax owed @ 24.0%
- −$1,564
- After-tax cash flow
- $6,166/yr
For passive investors: Depreciation is non-cash, so a rental often shows a tax loss while cash-flowing — sheltering income. Rental losses are passive: they offset passive income freely, and up to $25,000/yr can offset ordinary (W-2) income if you actively participate and your MAGI is under $100k (phasing out to $0 by $150k); unused losses carry forward. On sale, claimed depreciation is recaptured at up to 25%, and gains may owe capital-gains tax (a 1031 exchange can defer both). Figures are a year-1 estimate at your 24.0% rate — not tax advice; consult a CPA.
Schools (NCES district)
- District
- Canton City
- NCES district ID
- 3904371
- Math proficiency
- 17% ▼ -17.00%
- Reading proficiency
- 26% ▼ -12.00%
- Median HH income
- $28,825
- Composite
- 17.1/100
- National rank
- #9116
- State rank
- #627 of 656 in OH
Livability — Canton
- Score
- 71/100
- State rank
- #441
- US rank
- #7259
Category grades
Schools grade is shown separately in the Schools card above.
Census & demographics
- Census place
- Canton, OH
- County
- Stark County · 272,865 people
- City population
- 103,614
- Metro
- Canton-Massillon, OH
- Population (ZIP)
- 9,067
- Household income
- $47,305
- Rent vs Own
- Severe rent burden
- 444.0
Population outlook (Stark County) Hauer SSP2
- Today (2025)
- 373,708 people
- By 2030
- 371,245 · -0.7%
- By 2040
- 361,331 · -3.3%
- By 2050
- 345,290 · -7.6%
- By 2075
- 302,669 · -19.0%
- By 2100
- 238,870 · -36.1%
Race, ethnicity, and origin ACS 2023
- Neighborhood character
- Predominantly White (76%)
- Race & ethnicity
- White 76% Black 16% Two or more races 6% Hispanic / Latino 1% Asian 1%
- Common ancestry
- Italian 6% Lithuanian 4% Romanian 2%
- Foreign-born
- 2%
- Languages at home
- 98% English-only · Spanish 2%
Political lean MEDSL · Stark
- 2024 margin
- Strong R (+21.9) · D 38.6% · R 60.5%
- 2008→2024 swing
- -27.4pp toward R · 2008: 5.5pp · 2024: -21.9pp
- All cycles
- 2024: R+21.9 2020: R+18.5 2016: R+17.4 2012: R+0.4 2008: D+5.5
Not yet ingested
- Civics
- —
Market trends
- HPI YoY
- ▼ -118.74%
- Current HPI
- 177.4476
- Rent YoY
- —
- Metro
- Canton-Massillon, OH
- State GDP YoY
- ▲ 1.98%
- F500 in state
- 48
Industry mix (Fortune 500 HQ in OH)
| Industry | F500 HQs | Revenue |
|---|---|---|
| Insurance | 3 | $145B |
|
||
| Industrial Machinery | 3 | $49B |
|
||
| Financial Services | 3 | $24B |
|
||
| Consumer Goods | 2 | $93B |
|
||
| Aerospace / Defense | 2 | $47B |
|
||
| Utilities | 2 | $33B |
|
||
Price history
+296.0% since first listed16 events — show timeline
- 2026-05-11 Listed $99,000 MLSNOW
- 2025-04-15 Listing Removed — MLSNOW
- 2025-01-10 Listed $129,900 MLSNOW
- 2024-12-29 Listing Removed — MLSNOW
- 2024-07-02 Listed $129,900 MLSNOW
- 2008-01-25 Listing Removed — MLSNOW
- 2007-10-25 Listed $74,900 MLSNOW
- 2007-10-24 Listing Removed — MLSNOW
- 2007-04-17 Listed $74,900 MLSNOW
- 2007-04-17 Listing Removed — MLSNOW
- 2006-10-17 Listed $79,900 MLSNOW
- 2003-11-26 Sold (Public Records) $65,300 Public Records
- 2003-11-26 Sold (MLS) $65,300 MLSNOW
- 2003-08-07 Listed $69,900 MLSNOW
- 1995-08-04 Sold (Public Records) $29,500 Public Records
- 1992-04-03 Sold (Public Records) $25,000 Public Records
Property tax history
+1.2%/yrLatest (2024): $1,073 · +6.7% YoY. Source: county tax records.
Cash-flow waterfall
monthlySold comps — $/sqft
last 12 mo · ≤1 miLoading sold comps…