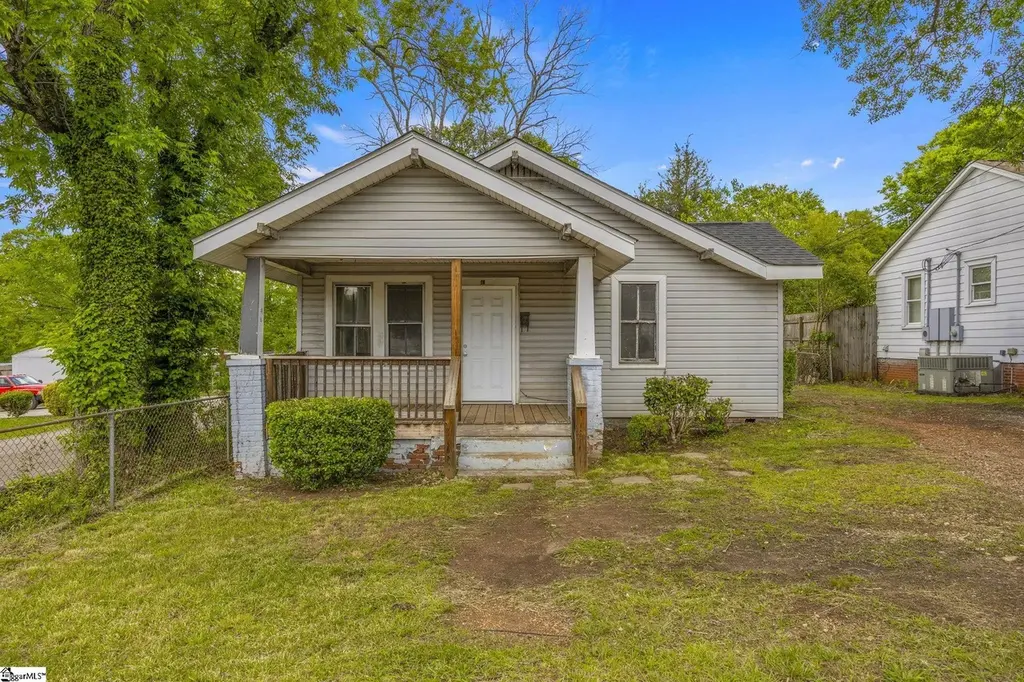
12 Verner Springs Rd · Sans Souci, SC
Flood risk 1/10 · Minimal
- FEMA flood zone
- X (unshaded)
- Chance of flooding over 30 yrs
- 0.0%
- Est. flood insurance / yr
- $507 – $1,088
Fire risk 1/10 · Minimal
- Est. fire insurance / yr
- $783 – $1,453
Heat risk 6/10 · Moderate
- Hot days now (above 102°F)
- 7 days/yr
- Hot days in 30 yrs
- 17 days/yr
Wind risk 2/10 · Minimal
- Chance of severe wind over 30 yrs
- 1.0%
Air-quality risk 4/10 · Minor
- Unhealthy air days now
- 3 days/yr
- Unhealthy air days in 30 yrs
- 4 days/yr
Risk factors via First Street. Map © Google.
Why this score? — see what drove the C+ grade
The composite is a weighted blend of 9 inputs, each scored 0–100. Each bar is that input's sub-score; the figure is the points it added to the 100-point composite (weight × sub-score).
- Cash flow +23.7/30.0
- ARV discount +15.0/15.0
- DSCR +7.6/10.0
- 1% rule +5.5/10.0
- Schools +4.2/10.0
- Livability +3.7/5.0
- Rent growth +2.5/5.0
- Condition / age +2.5/5.0
- Appreciation +0.0/10.0
$137,500
🖨 Deal sheet 📄 Offer letter ✓ Due diligence
Listing remarks
Investor special with endless potential in a convenient Greenville location! This 2-bedroom, 1-bath home at 12 Verner Springs Road offers an excellent opportunity for investors, flippers, or buyers looking for a property they can update and customize to their vision. With plenty of space and a functional layout, this home is full of possibilities for renovation or personal touches. Inside, you’ll find a spacious kitchen and living areas with room to reconfigure, refresh, or modernize to fit your needs. The home would benefit from cosmetic updates and repairs, making it an ideal handyman special with strong upside potential. Situated on a corner lot, the property also features a fenced
Key facts
- Spacious kitchen
- Convenient location
- Fenced backyard
Tags
Property features AI
Finance
- Other: Lead-based paint disclosure required
- HOA & community: No HOA fees listed
Exterior
- Parking: Driveway parking with gravel surface; No garage
- Utilities: Public water; Electric water heater; Public sewer; Private garbage pickup
- Home design: Single-story home; Approximately 50+ years old; Crawl space foundation
- Construction: Vinyl siding exterior; Architectural roof
- Exterior features: Front porch; Corner, level lot; Half-acre lot or smaller
Interior
- Kitchen: Kitchen (10 x 11)
- Bedrooms: Primary bedroom on main level (12 x 11); Second bedroom on main level (10 x 11); Two bedrooms on the main level
- Flooring: Hardwood; Laminate flooring
- Bathrooms: One full bathroom on the main level
- Heating & cooling: Natural gas heating; Electric cooling
- Interior features: Smooth ceilings; Laminate countertops
- Laundry & utility: Laundry on first floor in the kitchen
Neighborhood map
What this means for you Summary
Snapshot
- This is a 2-bed/1.0-bath single-family listed at $138k.
Deal economics
- At list price, monthly cash flow is $262 ($3k/yr) — positive.
- The deal already cash-flows at list — no discount required.
- Meets the 1% rule at list price ($1k rent vs $138k).
- Recommended offer: $133k (3.0% below list) — sets the bar for market timing.
- Cap rate 8.6% vs local median 3.5% in Sans Souci — top-decile yield for the area; either an underpriced asset or a hidden risk that comps aren't pricing in. Stress-test before assuming the spread holds.
Location & tenants
- Location reads 74/100 on livability (#30 in SC, #4,635 nationally) — a middle-class / working-renter tenant base. Strengths: commute A+, cost of living A+, housing A+; Watch: crime D-, amenities D-, employment F.
- Greenville 01 (suburban): math 44% / reading 54% proficiency, ranked #10 of 80 in SC (top 12%) — families likely to look elsewhere, expect single-tenant / working-renter base with shorter leases.
- Zoned schools: Cherrydale Elementary (math 27% / reading 19%, grade F, #469 of 597 statewide, top 79%, 689 students, 100% FRL) — zoned schools average 100% FRL vs 42% district-wide (58 pts higher); higher-poverty schools than district average — tighter screening recommended.
- Zoned-school proficiency averages 23% at this address vs 49% district-wide (-26 pts) — the specific schools serving this property underperform the Greenville 01 average; the district grade overstates school quality for this exact location.
- Market conditions: Rents flat; 196 active listings in the ZIP; 35 comparable units currently listed for rent nearby; rentals at typical pace (median 21d on market — plan ~3-4 weeks tenant-placement turnaround); 5,595 units permitted in Greenville County in 2024 (566 in 5+ unit buildings).
Forward outlook
- Local home prices are declining (-3.0%/yr); year-one equity from $951 of loan paydown is wiped out by about $4k of value loss. Plan a longer hold.
- Greenville County population projected at +34% by 2050 — long-run rental-demand tailwind backs the buy-and-hold thesis.
Negotiation context
- It's been on market 34 days — a 3% lower offer ($133k) is reasonable based on typical stale-listing flexibility.
- Current owner paid $42k; list at $138k implies a 227% gain — meaningful room to come down on a strong offer.
Risks & watch-outs
- Watch-outs: built in 1955 — expect roof / HVAC / electrical / plumbing capex.
- Climate carrying-cost: extreme-heat days projected 7→17/yr by 2055 (HVAC capex compounding) — expect insurance premiums to compound above CPI over the hold.
Questions for the listing agent
- It's been on market 34 days. Have you received any prior offers? Is the seller open to a 3% concession, seller financing, or rate buy-down credit?
- Built in 1955 — when were the roof, HVAC, electrical panel, plumbing, and water heater last replaced?
- Is there a deadline driving the sale (1031 exchange, divorce, estate, relocation)? That informs how much negotiation room exists.
- Schools are F-rated, which usually means shorter tenancies and higher turnover. Who's the typical renter profile here, and what's been the actual vacancy rate?
- Crime grade is D in this area — have there been break-ins, vandalism, or insurance claims at this property in the last 3 years? What carrier currently insures it and at what premium?
- What's the average days-on-market for RENTAL listings here right now (not sales)? A rising rental-DOM trend means longer vacancies and softer asking-rent achievability than the comps imply.
- What's the recent tenant-quality profile in this submarket — average credit score on applications, eviction rate, late-payment / NSF rate, and stable-employment percentage? A property-management company in the area should have these aggregated.
- How much new for-sale + rental construction is in the pipeline within 1–3 miles? Heavy new supply typically softens prices + rents 12–24 months out; constrained supply supports both.
Investment metrics
- 1% rule
- 1.05% ✓
- Cap rate
- 8.58%
- Cash-on-cash
- 8.17%
- DSCR
- 1.36
- GRM
- 7.9
CMA / ARV
- ARV (on-the-fly)
- $201,687
- Comps found
- 8
Show comp detail 8 sales within ~0.75 mi
| Address | Dist | Beds/Ba | Sqft | Sold | Price | $/sf | Match |
|---|---|---|---|---|---|---|---|
| 109 Hammett St | 0.52mi | 2/1.0 | 900 (+6%) | 9mo | $133,000 | $148 | 59 |
| 31 Hellams St | 0.55mi | 2/1.0 | 900 (+6%) | 8mo | $235,000 | $261 | 58 |
| 501 Mccrary St | 0.32mi | 2/1.0 | 950 (+12%) | 10mo | $225,000 | $237 | 57 |
| 11 Elrod St | 0.44mi | 2/1.0 | 945 (+11%) | 8mo | $200,000 | $212 | 54 |
| 120 Aladdin St | 0.65mi | 2/1.0 | 822 (-3%) | 12mo | $209,000 | $254 | 54 |
| 111 Aladdin St | 0.64mi | 3/1.0 (+1) | 864 (+2%) | 10mo | $179,900 | $208 | 54 |
| 419 S Franklin Rd | 0.42mi | 2/2.0 | 926 (+9%) | 17mo | $255,000 | $275 | 48 |
| 156 C St | 0.65mi | 2/1.0 | 938 (+10%) | 14mo | $124,000 | $132 | 41 |
Match score weights: distance 35% · size 25% · config 20% · recency 20%. Top-matched comps best support the ARV.
Projected returns pro-forma
-3.0% appreciation · 0.14% rent growth · sell at horizon
- IRR
- -7.0%
- Equity multiple
- 0.75×
- Total profit
- $-9,643
- Equity at exit
- $20,502
- IRR
- -1.1%
- Equity multiple
- 0.93×
- Total profit
- $-2,637
- Equity at exit
- $11,888
Cash invested: $38,500 (down + closing). Projections, not guarantees.
Landlord ↔ Tenant lean methodology
- Overall (STATE)
- 90 Strongly Landlord-Friendly
- State South Carolina
- 90 Strongly Landlord-Friendly · R+6
- County
- — inherits STATE
- City
- — inherits STATE
ZIP-level market 29609
- Rents YoY
- 0.1%
- Active inventory
- 196
- Price-to-rent
- 7.9×
Monthly cashflow live
- Estimated rent
- $1,444 high interval (Pro) →
- Mortgage (P&I)
- −$721
- Tax from tax record
- −$100 /mo · $1,199/yr
- Insurance
- −$57
- HOA
- −$0
- Vacancy / Maint / Mgmt
- −$303
- Net cashflow
- $262
Break-even live
UW: 25.0% down · 7.5% · 30yr · 1.5% tax · 5.0% vac · 8.0% maint · 8.0% mgmt
Financing live
Cash to close
- Down payment
- $34,375
- Closing costs
- $4,125
- Reserves months
- —
- Total cash needed
- —
Loan-product check · same deal, 3 products live
Conventional
25% down · 7.5% · 30yr
- Down + closing
- —
- Monthly P&I
- —
- Monthly cashflow
- —
- DSCR
- —
- Eligible?
- —
Personal DTI + credit; lowest rate.
DSCR
20% down · 8.5% · 30yr
- Down + closing
- —
- Monthly P&I
- —
- Monthly cashflow
- —
- DSCR
- —
- Eligible?
- —
No personal income docs; deal must DSCR.
Hard money
10% down · 12.0% · 12mo
- Down + closing
- —
- Monthly P&I
- —
- Monthly cashflow
- —
- DSCR
- —
- Eligible?
- —
Short-term bridge; refi at stabilization.
Rent comps 35 comps
| Address | Beds | Baths | Sqft | Rent | $/sqft | DOM | Units | Dist |
|---|---|---|---|---|---|---|---|---|
| 9 Cone Crest Ct Greenville, SC | 2.0 | 1.0 | 818 | $1,350 | $1.65 | 21d | 1 | 0.12mi |
| 403 McCrary St Greenville, SC | 2.0 | 1.0 | 868 | $1,200 | $1.38 | 3d | 1 | 0.27mi |
| 31 Victor St Greenville, SC | 1.0–2.0 | 1.0 | 759 | $2,419 | $3.18 | 23d | 15 | 0.36mi |
| 31 Victor St Unit 144 Greenville, SC | 2.0 | 1.0 | 860 | $1,634 | $1.90 | 23d | 1 | 0.41mi |
| 31 Victor St Unit 220 Greenville, SC | 1.0 | 1.0 | 659 | $1,252 | $1.90 | 23d | 1 | 0.41mi |
| 31 Victor St Unit 331 Greenville, SC | 2.0 | 1.0 | 995 | $2,204 | $2.22 | 23d | 1 | 0.41mi |
| 31 Victor St Unit 132 Greenville, SC | 1.0 | 1.0 | 783 | $1,488 | $1.90 | 23d | 1 | 0.41mi |
| 31 Victor St Unit 339 Greenville, SC | 2.0 | 1.0 | 975 | $1,853 | $1.90 | 23d | 1 | 0.41mi |
| 31 Victor St Unit 201 Greenville, SC | 2.0 | 1.0 | 895 | $1,700 | $1.90 | 23d | 1 | 0.41mi |
| 31 Victor St Unit 328 Greenville, SC | 2.0 | 1.0 | 835 | $1,585 | $1.90 | 23d | 1 | 0.41mi |
| 1121 Tsali Cir Greenville, SC | 2.0 | 1.0–2.0 | 906 | $2,401 | $2.65 | 3d | 8 | 0.43mi |
| 1250 WATER TOWER Cir Greenville, SC | 2.0 | 1.0–2.0 | 790 | $1,959 | $2.48 | 3d | 28 | 0.49mi |
| 3001 Old Buncombe Rd Greenville, SC | 1.0 | 1.0 | 650 | $875 | $1.35 | 14d | 1 | 0.50mi |
| 221 Church St Greenville, SC | 2.0 | 1.0 | 900 | $1,395 | $1.55 | 3d | 1 | 0.56mi |
| 135 D St Greenville, SC | 2.0 | 1.0 | 938 | $1,150 | $1.23 | 21d | 1 | 0.68mi |
| 1109 Hampton Avenue Ext Unit c Greenville, SC | 2.0 | 1.0 | 785 | $1,022 | $1.30 | 2d | 1 | 0.73mi |
| 1109 Hampton Avenue Ext Unit c Greenville, SC | 2.0 | 1.0 | 785 | $1,100 | $1.40 | 14d | 1 | 0.73mi |
| 1107 Hampton Avenue Ext Apt A Greenville, SC | 2.0 | 1.0 | 750 | $1,175 | $1.57 | 23d | 1 | 0.74mi |
| 1109 Hampton Ave Unit A Greenville, SC | 2.0 | 1.0 | 785 | $1,022 | $1.30 | 14d | 1 | 0.74mi |
| 1101 Hampton Avenue Ext Greenville, SC | 2.0 | 1.0 | 742 | $1,011 | $1.36 | 2d | 5 | 0.75mi |
| 1101 Hampton Avenue Ext Unit b Greenville, SC | 2.0 | 1.0 | 785 | $1,022 | $1.30 | 2d | 1 | 0.75mi |
| 1101 Hampton Avenue Ext Unit c Greenville, SC | 2.0 | 1.0 | 785 | $1,022 | $1.30 | 14d | 1 | 0.75mi |
| 1101 Hampton Avenue Ext Unit 1107-A Greenville, SC | 2.0 | 1.0 | 700 | $917 | $1.31 | 23d | 1 | 0.75mi |
| 1103 Hampton Ave Unit D Greenville, SC | 2.0 | 1.0 | 750 | $1,000 | $1.33 | 14d | 1 | 0.76mi |
| 1103 Hampton Ave Unit D Greenville, SC | 2.0 | 1.0 | 700 | $917 | $1.31 | 23d | 1 | 0.76mi |
| 205 N Beacon St Greenville, SC | 2.0 | 1.0 | 752 | $1,850 | $2.46 | 23d | 1 | 0.96mi |
| 802 Hampton Ave Unit A Greenville, SC | 2.0 | 1.0 | 900 | $1,300 | $1.44 | 23d | 1 | 0.98mi |
| 409 Pinckney St Apt 2D Greenville, SC | 2.0 | 1.0 | 900 | $1,300 | $1.44 | 3d | 1 | 0.99mi |
| 216 Lester Ave Greenville, SC | 2.0 | 1.0 | 1000 | $1,175 | $1.18 | 3d | 1 | 1.15mi |
| 39 E 7th St Greenville, SC | 3.0 | 2.0 | 1120 | $1,750 | $1.56 | 3d | 1 | 1.25mi |
| 33 9th St Greenville, SC | 2.0 | 1.0 | 886 | $1,000 | $1.13 | 23d | 1 | 1.29mi |
| 5 Zarline St Greenville, SC | 3.0 | 1.0 | 1060 | $1,095 | $1.03 | 19d | 1 | 1.35mi |
| 206 Von Hollen Dr Greenville, SC | 3.0 | 1.0 | 1100 | $1,549 | $1.41 | 21d | 1 | 1.42mi |
| 1 Paladin Ct Unit 1 Greenville, SC | 2.0 | 1.0 | 810 | $1,260 | $1.56 | 23d | 1 | 1.46mi |
| 500 Birnie St Greenville, SC | 2.0 | 1.0 | 980 | $1,475 | $1.51 | 23d | 1 | 1.50mi |
Listing history 16 events
-
2026-06-18days on market $137,500 Active 34 DOM
-
2026-06-17days on market $137,500 Active 33 DOM
-
2026-06-16days on market $137,500 Active 32 DOM
-
2026-06-15days on market $137,500 Active 31 DOM
-
2026-06-13days on market $137,500 Active 29 DOM
-
2026-06-13pricedays on market $137,500 Active 28 DOM
-
2026-06-10days on market $145,000 Active 26 DOM
-
2026-06-09days on market $145,000 Active 25 DOM
-
2026-06-08days on market $145,000 Active 24 DOM
-
2026-06-07days on market $145,000 Active 23 DOM
-
2026-06-03days on market $145,000 Active 19 DOM
-
2026-06-03days on market $145,000 Active 18 DOM
-
2026-06-01days on market $145,000 Active 17 DOM
-
2026-05-31days on market $145,000 Active 16 DOM
-
2026-05-15$145,000 Active
-
1998-09-30soldstatus $42,000
ⓘ Source: listings_history table (triggers on properties + properties_extension) + one-shot
backfill from property_details.listing_events for pre-trigger history.
Tax reassessment forecast SC · Resets to sale price
- Current annual tax
- $1,199 · $100/mo
- Projected year-2 tax
- $1,199 · $100/mo
- Expected delta
- $0/yr ($0/mo · 0.0%)
ⓘ Screening estimate from a state-policy table — verify with the county assessor before closing.
Climate risk First Street
- Flood 1/10 Low FEMA zone X (unshaded) · 0% chance over 30 yrs
- Wildfire 1/10 Low
- Heat 6/10 Major 7 d/yr ≥102°F today · 17 d/yr by 30 yrs out
- Wind 2/10 Low 100% chance of damaging wind over 30 yrs
- Air quality 4/10 Moderate 3 unhealthy d/yr today · 4 by 30 yrs out
Nearby sold comps map
Loading sold comps map…
Walkable amenities ~0.75 mi
Loading nearby amenities…
Taxation est. · year 1
- Rental income
- $17,324
- − Mortgage interest
- −$7,702
- − Property taxes
- −$1,199
- − Insurance
- −$688
- − Repairs & maintenance
- −$1,386
- − Management
- −$1,386
- − Depreciation
- −$4,000
- Taxable income
- $963
- Est. tax owed @ 24.0%
- −$231
- After-tax cash flow
- $2,915/yr
For passive investors: Depreciation is non-cash, so a rental often shows a tax loss while cash-flowing — sheltering income. Rental losses are passive: they offset passive income freely, and up to $25,000/yr can offset ordinary (W-2) income if you actively participate and your MAGI is under $100k (phasing out to $0 by $150k); unused losses carry forward. On sale, claimed depreciation is recaptured at up to 25%, and gains may owe capital-gains tax (a 1031 exchange can defer both). Figures are a year-1 estimate at your 24.0% rate — not tax advice; consult a CPA.
Schools (NCES district)
- District
- Greenville 01
- NCES district ID
- 4502310
- Math proficiency
- 44% ▼ -10.00%
- Reading proficiency
- 54% ▼ -2.00%
- Median HH income
- $49,596
- Composite
- 41.88/100
- National rank
- #3370
- State rank
- #10 of 80 in SC
Livability — Sans Souci
- Score
- 74/100
- State rank
- #30
- US rank
- #4635
Category grades
Schools grade is shown separately in the Schools card above.
Census & demographics
- Census place
- Sans Souci, SC
- County
- Greenville County · 573,815 people
- Metro
- Greenville-Anderson, SC
- Population (ZIP)
- 32,292
- Household income
- $65,342
- Rent vs Own
- Severe rent burden
- 1685.0
Population outlook (Greenville County) Hauer SSP2
- Today (2025)
- 574,580 people
- By 2030
- 615,615 · +7.1%
- By 2040
- 695,373 · +21.0%
- By 2050
- 769,367 · +33.9%
- By 2075
- 933,296 · +62.4%
- By 2100
- 1,029,196 · +79.1%
Race, ethnicity, and origin ACS 2023
- Neighborhood character
- Predominantly White (70%)
- Race & ethnicity
- White 70% Black 12% Hispanic / Latino 12% Two or more races 6% Asian 2%
- Hispanic origin (detail)
- Mexican 4% Puerto Rican 2% Dominican 1%
- Common ancestry
- Slovak 4% Italian 3% Serbian 2%
- Foreign-born
- 9% · Canada, Vietnam, Jamaica
- Languages at home
- 88% English-only · Spanish 8% Other Asian/Pacific 1% Vietnamese 1%
Political lean MEDSL · Greenville
- 2024 margin
- Strong R (+22.2) · D 38.0% · R 60.2% · Other 1.8%
- 2008→2024 swing
- +1.7pp toward D · 2008: -23.9pp · 2024: -22.2pp
- All cycles
- 2024: R+22.2 2020: R+18.2 2016: R+24.7 2012: R+27.8 2008: R+23.9
Not yet ingested
- Civics
- —
Market trends
- HPI YoY
- ▼ -291.09%
- Current HPI
- 277.6004
- Rent YoY
- ▲ 0.14%
- Metro
- Greenville-Anderson, SC
- State GDP YoY
- ▲ 4.51%
- F500 in state
- 2
Industry mix (Fortune 500 HQ in SC)
| Industry | F500 HQs | Revenue |
|---|---|---|
| Packaging | 1 | $7B |
|
||
Price history
+245.2% since first listed2 events — show timeline
- 2026-05-15 Listed $145,000 Greater Greenville MLS
- 1998-09-30 Sold (Public Records) $42,000 Public Records
Property tax history
+1.1%/yrLatest (2025): $1,199 · +3.7% YoY. Source: county tax records.
Cash-flow waterfall
monthlySold comps — $/sqft
last 12 mo · ≤1 miLoading sold comps…