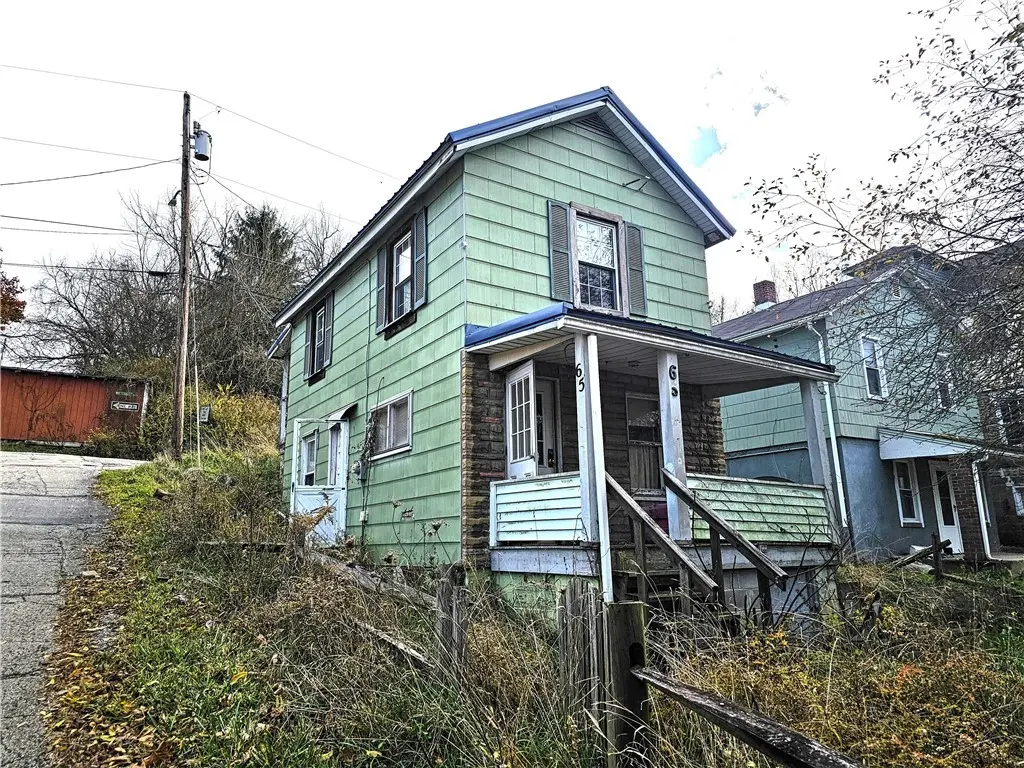
65 Hedge Ave · East Marianna, PA
Flood risk 8/10 · Major
- FEMA flood zone
- X (unshaded)
- Chance of flooding over 30 yrs
- 0.99%
- Est. flood insurance / yr
- $473 – $860
Fire risk 1/10 · Minimal
- Est. fire insurance / yr
- $511 – $949
Heat risk 4/10 · Minor
- Hot days now (above 97°F)
- 7 days/yr
- Hot days in 30 yrs
- 19 days/yr
Wind risk 2/10 · Minimal
- Chance of severe wind over 30 yrs
- —
Air-quality risk 2/10 · Minimal
- Unhealthy air days now
- 1 days/yr
- Unhealthy air days in 30 yrs
- 2 days/yr
Risk factors via First Street. Map © Google.
Why this score? — see what drove the D+ grade
The composite is a weighted blend of 9 inputs, each scored 0–100. Each bar is that input's sub-score; the figure is the points it added to the 100-point composite (weight × sub-score).
- Cash flow +15.0/30.0
- ARV discount +7.5/15.0
- 1% rule +5.0/10.0
- DSCR +5.0/10.0
- Appreciation +4.7/10.0
- Rent growth +2.5/5.0
- Schools +2.5/10.0
- Livability +2.5/5.0
- Condition / age +2.5/5.0
$9,900
🖨 Deal sheet 📄 Offer letter ✓ Due diligence
Listing remarks MLS
Sold As Is. Needs TLC
Key facts
- 3,301 sq ft lot
- Built 1900
- Listed 204 days
Neighborhood map
What this means for you Summary
Snapshot
- This is a 2-bed/1.0-bath single-family listed at $10k.
Deal economics
- At list price, monthly cash flow is $610 ($7k/yr) — positive.
- The deal already cash-flows at list — no discount required.
- Meets the 1% rule at list price ($929 rent vs $10k).
- Recommended offer: $9k (12.0% below list) — sets the bar for market timing.
Location & tenants
- Location reads: area grade D — affects rentability + tenant quality, not the cash-flow math above.
- Bethlehem-Center SD (rural): math 18% / reading 39% proficiency, ranked #448 of 539 in PA (top 83%) — low school quality limits family demand, transient renter base, plan for 1-2y turnover.
- Market conditions: 9 active listings in the ZIP; 489 units permitted in Washington County in 2024 (30 in 5+ unit buildings).
Forward outlook
- In year one you build about $4 of equity ($68 loan paydown + $-64 appreciation (-0.7% local appreciation)).
- Washington County population projected to shrink 6% by 2050 — rents likely to lag national; underwrite the cash flow, not the appreciation.
- At projected returns (-0.7% appreciation + 3.0% rent growth), your $3k cash investment doubles in ~1 year — after that, you're playing with house money.
Negotiation context
- It's been on market 204 days — a 12% lower offer ($9k) is reasonable based on typical stale-listing flexibility.
- 3 sale attempts since 21y ago; this cycle's ask has dropped $4k (29%) from the opening price — seller is motivated, your offer sets the floor, not the list.
- Current owner paid $7k; list at $10k implies a 52% gain — meaningful room to come down on a strong offer.
Risks & watch-outs
- Watch-outs: flood insurance adds $56/mo; built in 1900 — expect roof / HVAC / electrical / plumbing capex.
- Climate carrying-cost: severe flood risk — expect insurance premiums to compound above CPI over the hold.
Questions for the listing agent
- It's been on market 204 days. Have you received any prior offers? Is the seller open to a 12% concession, seller financing, or rate buy-down credit?
- Built in 1900 — when were the roof, HVAC, electrical panel, plumbing, and water heater last replaced?
- What's the actual annual flood-insurance premium (NFIP or private), and is the property in a SFHA with mandatory coverage?
- Why hasn't it sold? Are there any deal-killer items the seller is aware of (foundation, flood, title, zoning, code violations)?
- Is there a deadline driving the sale (1031 exchange, divorce, estate, relocation)? That informs how much negotiation room exists.
- The area grade is low — what's the realistic commute time and amenity access for the typical tenant pool here? Any planned neighborhood developments (good or bad) we should know about?
- What's the average days-on-market for RENTAL listings here right now (not sales)? A rising rental-DOM trend means longer vacancies and softer asking-rent achievability than the comps imply.
- What's the recent tenant-quality profile in this submarket — average credit score on applications, eviction rate, late-payment / NSF rate, and stable-employment percentage? A property-management company in the area should have these aggregated.
- How much new for-sale + rental construction is in the pipeline within 1–3 miles? Heavy new supply typically softens prices + rents 12–24 months out; constrained supply supports both.
Investment metrics
- 1% rule
- 9.38% ✓
- Cap rate
- 86.94%
- Cash-on-cash
- 288.03%
- DSCR
- 13.82
- GRM
- 0.9
CMA / ARV
No comps found within radius.
Projected returns pro-forma
-0.65% appreciation · 3.0% rent growth · sell at horizon
- IRR
- —
- Equity multiple
- 14.82×
- Total profit
- $38,301
- Equity at exit
- $2,559
- IRR
- —
- Equity multiple
- 31.50×
- Total profit
- $84,533
- Equity at exit
- $2,834
Cash invested: $2,772 (down + closing). Projections, not guarantees.
Landlord ↔ Tenant lean methodology
- Overall (STATE)
- 62 Landlord-Friendly
- State Pennsylvania
- 62 Landlord-Friendly · EVEN
- County
- — inherits STATE
- City
- — inherits STATE
ZIP-level market 15345
- Home prices YoY
- -0.6%
- Active inventory
- 9
- Price-to-rent
- 0.9×
Monthly cashflow live
- Estimated rent
- $929 medium interval (Pro) →
- Mortgage (P&I)
- −$52
- Tax est. 1.5%
- −$12 /mo · $148/yr
- Insurance
- −$4
- Flood insurance flood zone
- −$56 /mo · $666/yr
- HOA
- −$0
- Vacancy / Maint / Mgmt
- −$195
- Net cashflow
- $610
Break-even live
UW: 25.0% down · 7.5% · 30yr · 1.5% tax · 5.0% vac · 8.0% maint · 8.0% mgmt
Financing live
Cash to close
- Down payment
- $2,475
- Closing costs
- $297
- Reserves months
- —
- Total cash needed
- —
Loan-product check · same deal, 3 products live
Conventional
25% down · 7.5% · 30yr
- Down + closing
- —
- Monthly P&I
- —
- Monthly cashflow
- —
- DSCR
- —
- Eligible?
- —
Personal DTI + credit; lowest rate.
DSCR
20% down · 8.5% · 30yr
- Down + closing
- —
- Monthly P&I
- —
- Monthly cashflow
- —
- DSCR
- —
- Eligible?
- —
No personal income docs; deal must DSCR.
Hard money
10% down · 12.0% · 12mo
- Down + closing
- —
- Monthly P&I
- —
- Monthly cashflow
- —
- DSCR
- —
- Eligible?
- —
Short-term bridge; refi at stabilization.
Listing history 16 events
-
2026-06-10status $9,900 Pending 204 DOM
-
2026-06-09days on market $9,900 Active 204 DOM
-
2026-06-08days on market $9,900 Active 203 DOM
-
2026-06-07days on market $9,900 Active 202 DOM
-
2026-06-03days on market $9,900 Active 198 DOM
-
2026-06-02days on market $9,900 Active 197 DOM
-
2026-06-01days on market $9,900 Active 196 DOM
-
2026-05-31days on market $9,900 Active 195 DOM
-
2026-03-12price $9,900 21-char remark
Show marketing remark (21 chars)
Sold As Is. Needs TLC
-
2026-02-13price $11,900 21-char remark
Show marketing remark (21 chars)
Sold As Is. Needs TLC
-
2025-11-17$14,000 Active 21-char remark
Show marketing remark (21 chars)
Sold As Is. Needs TLC
-
2024-01-18soldstatus $6,511 Closed 11-char remark
Show marketing remark (11 chars)
SOLD AS IS.
-
2023-11-24status Pending 11-char remark
Show marketing remark (11 chars)
SOLD AS IS.
-
2023-10-27$7,000 Active 11-char remark
Show marketing remark (11 chars)
SOLD AS IS.
-
2005-10-04soldstatus $7,142
-
2005-03-08$12,750
ⓘ Source: listings_history table (triggers on properties + properties_extension) + one-shot
backfill from property_details.listing_events for pre-trigger history.
Climate risk First Street
- Flood 8/10 Severe FEMA zone X (unshaded) · 99% chance over 30 yrs
- Wildfire 1/10 Low
- Heat 4/10 Moderate 7 d/yr ≥97°F today · 19 d/yr by 30 yrs out
- Wind 2/10 Low
- Air quality 2/10 Low 1 unhealthy d/yr today · 2 by 30 yrs out
Nearby sold comps map
Loading sold comps map…
Walkable amenities ~0.75 mi
Loading nearby amenities…
Taxation est. · year 1
- Rental income
- $11,146
- − Mortgage interest
- −$555
- − Property taxes
- −$148
- − Insurance
- −$716
- − Repairs & maintenance
- −$892
- − Management
- −$892
- − Depreciation
- −$288
- Taxable income
- $7,656
- Est. tax owed @ 24.0%
- −$1,837
- After-tax cash flow
- $5,480/yr
For passive investors: Depreciation is non-cash, so a rental often shows a tax loss while cash-flowing — sheltering income. Rental losses are passive: they offset passive income freely, and up to $25,000/yr can offset ordinary (W-2) income if you actively participate and your MAGI is under $100k (phasing out to $0 by $150k); unused losses carry forward. On sale, claimed depreciation is recaptured at up to 25%, and gains may owe capital-gains tax (a 1031 exchange can defer both). Figures are a year-1 estimate at your 24.0% rate — not tax advice; consult a CPA.
Schools (NCES district)
- District
- Bethlehem-Center SD
- NCES district ID
- 4203600
- Math proficiency
- 18% ▼ -14.00%
- Reading proficiency
- 39% ▼ -15.00%
- Median HH income
- $49,354
- Composite
- 24.81/100
- National rank
- #7596
- State rank
- #448 of 539 in PA
Livability — East Marianna
No livability data for this city. (Only ~50 U.S. cities are tracked.)
Census & demographics
- Census place
- East Marianna, PA
- Population (ZIP)
- 1,540
Population outlook (Washington County) Hauer SSP2
- Today (2025)
- 208,060 people
- By 2030
- 207,168 · -0.4%
- By 2040
- 202,738 · -2.6%
- By 2050
- 195,269 · -6.1%
- By 2075
- 175,588 · -15.6%
- By 2100
- 145,827 · -29.9%
Race, ethnicity, and origin ACS 2023
- Neighborhood character
- Predominantly White (89%)
- Race & ethnicity
- White 89% Two or more races 8% Hispanic / Latino 5% Black 2%
- Common ancestry
- Serbian 4% Romanian 3% Scotch-Irish 3%
- Foreign-born
- 1% · Canada
- Languages at home
- 98% English-only · Spanish 2%
Political lean MEDSL · Washington
- 2024 margin
- Strong R (+25.5) · D 36.9% · R 62.4%
- 2008→2024 swing
- -20.8pp toward R · 2008: -4.7pp · 2024: -25.5pp
- All cycles
- 2024: R+25.5 2020: R+22.8 2016: R+25.3 2012: R+13.3 2008: R+4.7
Not yet ingested
- Civics
- —
Market trends
- HPI YoY
- ▼ -0.65%
- Current HPI
- 110.0185
- Rent YoY
- —
- Metro
- —
- State GDP YoY
- ▲ 1.68%
- F500 in state
- 34
Industry mix (Fortune 500 HQ in PA)
| Industry | F500 HQs | Revenue |
|---|---|---|
| Healthcare | 2 | $309B |
|
||
| Insurance | 2 | $27B |
|
||
| Telecommunications / Media | 1 | $124B |
|
||
| Industrial Distribution | 1 | $22B |
|
||
| Financial Services | 1 | $20B |
|
||
| Chemicals / Materials | 1 | $18B |
|
||
Price history
-22.4% since first listed8 events — show timeline
- 2026-03-12 Price Changed $9,900 West Penn MLS
- 2026-02-13 Price Changed $11,900 West Penn MLS
- 2025-11-17 Listed $14,000 West Penn MLS
- 2024-01-18 Sold (MLS) $6,511 West Penn MLS
- 2023-11-24 Pending — West Penn MLS
- 2023-10-27 Listed $7,000 West Penn MLS
- 2005-10-04 Sold (MLS) $7,142 West Penn MLS
- 2005-03-08 Listed $12,750 West Penn MLS
Property tax history
+6.4%/yrLatest (2026): $757 · +4.4% YoY. Source: county tax records.
Cash-flow waterfall
monthlySold comps — $/sqft
last 12 mo · ≤1 miLoading sold comps…