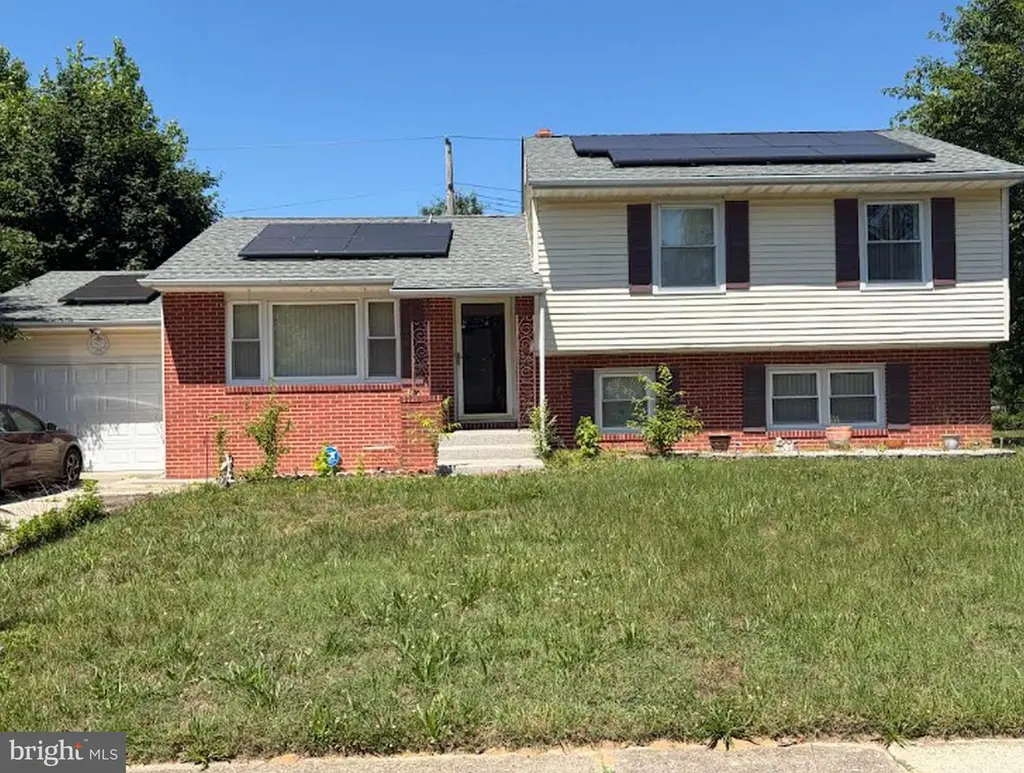
319 Gunning Bedford Dr · Rodney Village, DE
Flood risk 1/10 · Minimal
- FEMA flood zone
- X (unshaded)
- Chance of flooding over 30 yrs
- 0.0%
- Est. flood insurance / yr
- $473 – $860
Fire risk 1/10 · Minimal
- Est. fire insurance / yr
- $476 – $884
Heat risk 8/10 · Major
- Hot days now (above 102°F)
- 7 days/yr
- Hot days in 30 yrs
- 16 days/yr
Wind risk 6/10 · Moderate
- Chance of severe wind over 30 yrs
- 75.0%
Air-quality risk 2/10 · Minimal
- Unhealthy air days now
- 1 days/yr
- Unhealthy air days in 30 yrs
- 2 days/yr
Risk factors via First Street. Map © Google.
Why this score? — see what drove the C grade
The composite is a weighted blend of 9 inputs, each scored 0–100. Each bar is that input's sub-score; the figure is the points it added to the 100-point composite (weight × sub-score).
- Cash flow +19.7/30.0
- ARV discount +13.0/15.0
- DSCR +6.2/10.0
- 1% rule +4.2/10.0
- Livability +3.6/5.0
- Rent growth +3.3/5.0
- Schools +3.3/10.0
- Condition / age +2.5/5.0
- Appreciation +0.0/10.0
$270,000
🖨 Deal sheet 📄 Offer letter ✓ Due diligence
Listing remarks MLS
Welcome to 319 Gunning Bedford Dr. , a charming bi-level home located in the heart of Dover, DE. This inviting residence features 3 spacious bedrooms and 2 full bathrooms, offering a comfortable and functional layout that's perfect for families or anyone seeking extra space. Upon entering the home, you'll be greeted by a bright and open living area on the upper level, complete with large windows that fill the space with natural light. The adjoining dining area provides an ideal setting for family meals and gatherings, while the well-appointed kitchen is equipped with ample cabinetry and modern appliances, making meal prep a breeze. The upper level also includes the master bedroom with its own private bathroom and 2 generously sized bedrooms and a full bathroom, offering privacy and comfort. Downstairs, the lower level hosts a versatile family room, perfect for entertaining, relaxation, or as a play area. This level also features a laundry area, providing flexibility and convenience. One of the standout features of this home is the partially enclosed back porch, offering a delightful space to enjoy your morning coffee, relax with a good book, or entertain guests while staying sheltered from the elements. The backyard provides ample room for outdoor activities, gardening, or simply enjoying the fresh air. Located in a friendly neighborhood, 319 Gunning Bedford Dr. offers easy access to local schools, shopping centers, parks, and major transportation routes. With its comfortable layout, convenient features, and appealing outdoor space, this home is ready to welcome you to a new chapter of life. Don't miss the opportunity to make it your own!
Key facts
- 6,882 sq ft lot
- Garage
- Built 1960
Property features AI
Exterior
- Parking: Front-entry attached garage (1 space); Driveway, off-street and on-street parking available
- Utilities: Public water; Public sewer; Electric hot water
- Home design: Detached property; Fee simple ownership
- Construction: Brick and vinyl siding exterior; Concrete perimeter foundation
- Exterior features: Lot dimensions approximately 70 x 99.7; Above-grade and below-grade structures
Interior
- Bedrooms: Four bedrooms on the upper level
- Bathrooms: Two full bathrooms (one on main level, one on upper level)
- Heating & cooling: Forced air heating (natural gas); Central air conditioning
- Interior features: One fireplace; Full basement
Neighborhood map
What this means for you Summary
Snapshot
- This is a 3-bed/1.5-bath single-family listed at $270k.
Deal economics
- At list price, monthly cash flow is $315 ($4k/yr) — positive.
- The deal already cash-flows at list — no discount required.
- To meet the 1% rule (rent ≥ 1% of price), the offer needs to be $248k (8.1% below list).
- Recommended offer: $248k (8.1% below list) — sets the bar for 1% rule.
Location & tenants
- Location reads 72/100 on livability (#15 in DE) — a middle-class / working-renter tenant base. Strengths: cost of living A+, crime A, housing B+; Watch: amenities F, commute F, employment D-.
- Caesar Rodney School District (suburban): math 26% / reading 49% proficiency, ranked #9 of 26 in DE (top 35%) — families likely to look elsewhere, expect single-tenant / working-renter base with shorter leases.
- Market conditions: Rents rising (+3.3%/yr); 225 active listings in the ZIP; 9 comparable units currently listed for rent nearby; rentals lingering (median 44d on market — plan ~5-8 weeks vacancy on turnover, expect pricing pressure); 100% of comp listings sitting > 30 days — soft ceiling on asking rent; 1,201 units permitted in Kent County in 2024 (116 in 5+ unit buildings).
- This rent runs 44% of the median local income ($67k/yr) — at the standard rent-burdened threshold; future hikes will face affordability resistance.
Forward outlook
- Local home prices are declining (-3.0%/yr); year-one equity from $2k of loan paydown is wiped out by about $8k of value loss. Plan a longer hold.
- Kent County population projected at +22% by 2050 — long-run rental-demand tailwind backs the buy-and-hold thesis.
Negotiation context
- It's been on market 15 days — a 2% lower offer ($266k) is reasonable based on typical stale-listing flexibility.
- 3 sale attempts since 9y ago with the ask held roughly flat each time — persistent listings suggest the price (not the market) is what's stuck; bring a comps-based counter.
Risks & watch-outs
- Climate carrying-cost: major wind risk, 75% chance of damaging wind over 30y; extreme-heat days projected 7→16/yr by 2055 (HVAC capex compounding) — expect insurance premiums to compound above CPI over the hold.
Questions for the listing agent
- Built in 1960 — when were the roof, HVAC, electrical panel, plumbing, and water heater last replaced?
- Is there a deadline driving the sale (1031 exchange, divorce, estate, relocation)? That informs how much negotiation room exists.
- What's the average days-on-market for RENTAL listings here right now (not sales)? A rising rental-DOM trend means longer vacancies and softer asking-rent achievability than the comps imply.
- What's the recent tenant-quality profile in this submarket — average credit score on applications, eviction rate, late-payment / NSF rate, and stable-employment percentage? A property-management company in the area should have these aggregated.
- How much new for-sale + rental construction is in the pipeline within 1–3 miles? Heavy new supply typically softens prices + rents 12–24 months out; constrained supply supports both.
Investment metrics
- 1% rule
- 0.92% ✗
- Cap rate
- 7.69%
- Cash-on-cash
- 5.00%
- DSCR
- 1.22
- GRM
- 9.1
CMA / ARV
- ARV (on-the-fly)
- $307,440
- Comps found
- 12
Show comp detail 12 sales within ~0.75 mi
| Address | Dist | Beds/Ba | Sqft | Sold | Price | $/sf | Match |
|---|---|---|---|---|---|---|---|
| 311 Mimosa Ave | 0.43mi | 4/1.5 (+1) | 1,688 (+0%) | 2mo | $335,000 | $198 | 72 |
| 224 Kesselring Ave | 0.52mi | 3/2.0 | 1,651 (-2%) | 11mo | $305,000 | $185 | 62 |
| 274 Samuel Paynter Dr | 0.08mi | 4/1.5 (+1) | 1,924 (+14%) | 12mo | $275,000 | $143 | 57 |
| 111 Gunning Bedford Dr | 0.26mi | 3/2.0 | 1,445 (-14%) | 9mo | $185,000 | $128 | 55 |
| 281 Kesselring Ave | 0.55mi | 3/2.0 | 1,550 (-8%) | 6mo | $280,000 | $181 | 54 |
| 372 Kesselring Ave | 0.54mi | 3/1.5 | 1,445 (-14%) | 1mo | $295,000 | $204 | 51 |
| 374 Fiddlers Grn | 0.72mi | 3/1.5 | 1,736 (+3%) | 13mo | $318,500 | $183 | 50 |
| 341 Alder Rd | 0.58mi | 3/1.5 | 1,488 (-11%) | 6mo | $300,000 | $202 | 49 |
| 114 Cambridge Rd | 0.58mi | 3/2.5 | 1,554 (-8%) | 10mo | $285,000 | $183 | 48 |
| 245 Cambridge Rd | 0.52mi | 3/2.5 | 1,536 (-9%) | 13mo | $350,000 | $228 | 47 |
| 109 Chalet Ct | 0.56mi | 4/1.5 (+1) | 1,856 (+10%) | 8mo | $329,999 | $178 | 44 |
| 171 Carter Rd | 0.71mi | 3/2.0 | 1,880 (+12%) | 4mo | $235,000 | $125 | 42 |
Match score weights: distance 35% · size 25% · config 20% · recency 20%. Top-matched comps best support the ARV.
Projected returns pro-forma
-3.0% appreciation · 3.3% rent growth · sell at horizon
- IRR
- -8.3%
- Equity multiple
- 0.70×
- Total profit
- $-23,045
- Equity at exit
- $40,258
- IRR
- 1.6%
- Equity multiple
- 1.11×
- Total profit
- $8,458
- Equity at exit
- $23,345
Cash invested: $75,600 (down + closing). Projections, not guarantees.
Landlord ↔ Tenant lean methodology
- Overall (STATE)
- 70 Landlord-Friendly
- State Delaware
- 70 Landlord-Friendly · D+7
- County
- — inherits STATE
- City
- — inherits STATE
ZIP-level market 19904
- Rents YoY
- 3.3%
- Active inventory
- 225
- Price-to-rent
- 9.1×
Monthly cashflow live
- Estimated rent
- $2,481 high interval (Pro) →
- Mortgage (P&I)
- −$1,416
- Tax from tax record
- −$117 /mo · $1,400/yr
- Insurance
- −$112
- HOA
- −$0
- Vacancy / Maint / Mgmt
- −$521
- Net cashflow
- $315
Break-even live
UW: 25.0% down · 7.5% · 30yr · 1.5% tax · 5.0% vac · 8.0% maint · 8.0% mgmt
Financing live
Cash to close
- Down payment
- $67,500
- Closing costs
- $8,100
- Reserves months
- —
- Total cash needed
- —
Loan-product check · same deal, 3 products live
Conventional
25% down · 7.5% · 30yr
- Down + closing
- —
- Monthly P&I
- —
- Monthly cashflow
- —
- DSCR
- —
- Eligible?
- —
Personal DTI + credit; lowest rate.
DSCR
20% down · 8.5% · 30yr
- Down + closing
- —
- Monthly P&I
- —
- Monthly cashflow
- —
- DSCR
- —
- Eligible?
- —
No personal income docs; deal must DSCR.
Hard money
10% down · 12.0% · 12mo
- Down + closing
- —
- Monthly P&I
- —
- Monthly cashflow
- —
- DSCR
- —
- Eligible?
- —
Short-term bridge; refi at stabilization.
Rent comps 9 comps
| Address | Beds | Baths | Sqft | Rent | $/sqft | DOM | Units | Dist |
|---|---|---|---|---|---|---|---|---|
| 541 Ruth Way Dover, DE | 4.0 | 2.5 | 1761 | $3,200 | $1.82 | 43d | 1 | 1.17mi |
| 511 Nickerjack Way Dover, DE | 3.0 | 2.0 | 1569 | $2,800 | $1.78 | 43d | 1 | 1.22mi |
| 502 Horsey Blvd Dover, DE | 3.0 | 2.0 | 1604 | $2,900 | $1.81 | 43d | 1 | 1.25mi |
| 300 East St Camden, DE | 1.0–3.0 | 1.0–2.0 | 1272 | $2,695 | $2.12 | 43d | 1 | 1.30mi |
| 215 Royal Grant Way Dover, DE | 4.0 | 2.5 | 2028 | $2,500 | $1.23 | 43d | 1 | 1.31mi |
| 200 Beechwood Ave Unit 55 Dover, DE | 2.0 | 2.0 | 1168 | $1,550 | $1.33 | 43d | 1 | 1.35mi |
| 629 Ruth Way Dover, DE | 3.0–4.0 | 2.0–2.5 | 1665 | $2,850 | $1.71 | 43d | 13 | 1.39mi |
| 104 Southern Blvd Wyoming, DE | 3.0 | 1.0 | 1656 | $2,000 | $1.21 | 43d | 1 | 1.43mi |
| 424 Ridgely Blvd Dover, DE | 3.0 | 2.5 | 1432 | $2,000 | $1.40 | 43d | 1 | 1.46mi |
Listing history 11 events
-
2026-06-19days on market $270,000 Coming Soon 15 DOM
-
2026-06-18days on market $270,000 Coming Soon 14 DOM
-
2026-06-17days on market $270,000 Coming Soon 13 DOM
-
2026-06-16days on market $270,000 Coming Soon 12 DOM
-
2026-06-15days on market $270,000 Coming Soon 11 DOM
-
2026-06-14days on market $270,000 Coming Soon 9 DOM
-
2026-06-13days on market $270,000 Coming Soon 8 DOM
-
2026-06-10days on market $270,000 Coming Soon 6 DOM
-
2026-06-09days on market $270,000 Coming Soon 5 DOM
-
2026-06-08days on market $270,000 Coming Soon 4 DOM
-
2026-06-07$270,000 Coming Soon 3 DOM
ⓘ Source: listings_history table (triggers on properties + properties_extension) + one-shot
backfill from property_details.listing_events for pre-trigger history.
Tax reassessment forecast DE · Partial reset (capped growth)
- Current annual tax
- $1,400 · $117/mo
- Projected year-2 tax
- $1,483 · $124/mo
- Expected delta
- +$83/yr (+$7/mo · 5.9%)
ⓘ Screening estimate from a state-policy table — verify with the county assessor before closing.
Climate risk First Street
- Flood 1/10 Low FEMA zone X (unshaded) · 0% chance over 30 yrs
- Wildfire 1/10 Low
- Heat 8/10 Severe 7 d/yr ≥102°F today · 16 d/yr by 30 yrs out
- Wind 6/10 Major 75% chance of damaging wind over 30 yrs
- Air quality 2/10 Low 1 unhealthy d/yr today · 2 by 30 yrs out
Nearby sold comps map
Loading sold comps map…
Walkable amenities ~0.75 mi
Loading nearby amenities…
Taxation est. · year 1
- Rental income
- $29,771
- − Mortgage interest
- −$15,124
- − Property taxes
- −$1,400
- − Insurance
- −$1,350
- − Repairs & maintenance
- −$2,382
- − Management
- −$2,382
- − Depreciation
- −$7,855
- Taxable loss
- −$721
- Est. tax savings @ 24.0%
- +$173
- After-tax cash flow
- $3,951/yr
For passive investors: Depreciation is non-cash, so a rental often shows a tax loss while cash-flowing — sheltering income. Rental losses are passive: they offset passive income freely, and up to $25,000/yr can offset ordinary (W-2) income if you actively participate and your MAGI is under $100k (phasing out to $0 by $150k); unused losses carry forward. On sale, claimed depreciation is recaptured at up to 25%, and gains may owe capital-gains tax (a 1031 exchange can defer both). Figures are a year-1 estimate at your 24.0% rate — not tax advice; consult a CPA.
Schools (NCES district)
- District
- Caesar Rodney School District
- NCES district ID
- 1000180
- Math proficiency
- 26% ▼ -21.00%
- Reading proficiency
- 49% ▼ -14.00%
- Median HH income
- $61,187
- Composite
- 33.4/100
- National rank
- #5475
- State rank
- #9 of 26 in DE
Livability — Rodney Village
- Score
- 72/100
- State rank
- #15
- US rank
- #5991
Category grades
Schools grade is shown separately in the Schools card above.
Census & demographics
- Census place
- Rodney Village, DE
- County
- Kent County · 82,184 people
- Metro
- Dover, DE
- Population (ZIP)
- 38,818
- Household income
- $66,908
- Rent vs Own
- Severe rent burden
- 1500.0
Population outlook (Kent County) Hauer SSP2
- Today (2025)
- 194,477 people
- By 2030
- 204,351 · +5.1%
- By 2040
- 222,135 · +14.2%
- By 2050
- 236,483 · +21.6%
- By 2075
- 266,327 · +36.9%
- By 2100
- 275,335 · +41.6%
Race, ethnicity, and origin ACS 2023
- Neighborhood character
- Diverse neighborhood (Simpson 0.64)
- Race & ethnicity
- White 48% Black 35% Two or more races 9% Hispanic / Latino 8% Asian 3%
- Hispanic origin (detail)
- Mexican 1% Puerto Rican 4%
- Common ancestry
- Hispanic 3% Romanian 2% Slovak 2%
- Foreign-born
- 10% · Canada, South Korea
- Languages at home
- 87% English-only · Spanish 5% French/Haitian/Cajun 3% German/W. Germanic 1%
Political lean MEDSL · Kent
- 2024 margin
- Toss-up / Even · D 50.2% · R 48.2% · Other 1.7%
- 2008→2024 swing
- -7.8pp toward R · 2008: 9.8pp · 2024: 2.0pp
- All cycles
- 2024: D+2.0 2020: D+4.1 2016: R+4.9 2012: D+4.9 2008: D+9.8
Not yet ingested
- Civics
- —
Market trends
- HPI YoY
- ▼ -112.03%
- Current HPI
- 187.6879
- Rent YoY
- ▲ 3.30%
- Metro
- Dover, DE
- State GDP YoY
- —
- F500 in state
- 0
Price history
+80.1% since first listed16 events — show timeline
- 2026-06-04 Coming Soon $270,000 BRIGHT MLS
- 2024-07-12 Sold (Public Records) $270,000 Public Records
- 2024-07-05 Sold (MLS) $270,000 BRIGHT MLS
- 2024-05-24 Pending — BRIGHT MLS
- 2024-04-27 Listed $270,000 BRIGHT MLS
- 2024-04-25 Coming Soon $270,000 BRIGHT MLS
- 2017-12-27 Sold (Public Records) $140,000 Public Records
- 2017-12-18 Sold (MLS) $140,000 BRIGHT MLS
- 2017-12-18 Sold (MLS) $140,000 TREND
- 2017-12-02 Pending — TREND
- 2017-11-30 Sold (MLS) $140,000 TREND
- 2017-10-20 Pending — TREND
- 2017-10-12 Price Changed $149,900 TREND
- 2017-07-17 Price Changed $159,900 TREND
- 2017-07-02 Listed $169,900 TREND
- 2017-07-02 Listed $149,900 BRIGHT MLS
Property tax history
+7.1%/yrLatest (2025): $1,400 · +1198.1% YoY. Source: county tax records.
Cash-flow waterfall
monthlySold comps — $/sqft
last 12 mo · ≤1 miLoading sold comps…