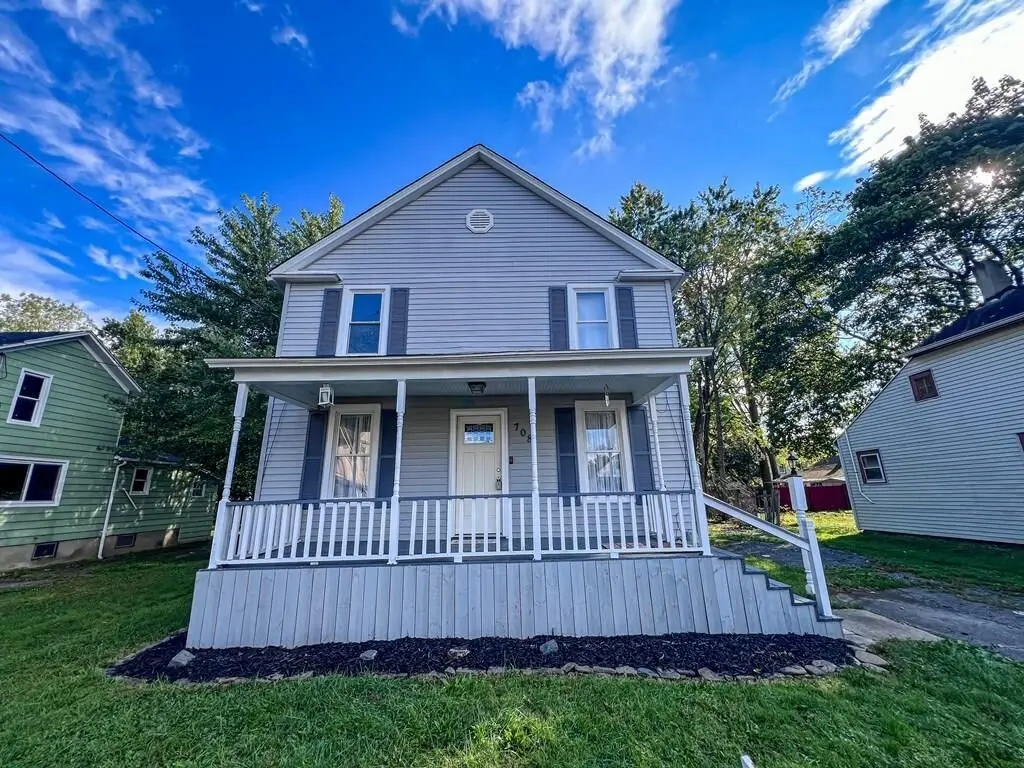
708 Johnson St · Elmira, NY
Flood risk 4/10 · Minor
- FEMA flood zone
- X
- Chance of flooding over 30 yrs
- 0.2%
- Est. flood insurance / yr
- $473 – $860
Fire risk 3/10 · Minor
- Est. fire insurance / yr
- $691 – $1,283
Heat risk 3/10 · Minor
- Hot days now (above 97°F)
- 7 days/yr
- Hot days in 30 yrs
- 16 days/yr
Wind risk 2/10 · Minimal
- Chance of severe wind over 30 yrs
- 1.0%
Air-quality risk 1/10 · Minimal
- Unhealthy air days now
- 0 days/yr
- Unhealthy air days in 30 yrs
- 0 days/yr
Risk factors via First Street. Map © Google.
Why this score? — see what drove the C+ grade
The composite is a weighted blend of 9 inputs, each scored 0–100. Each bar is that input's sub-score; the figure is the points it added to the 100-point composite (weight × sub-score).
- Cash flow +18.1/30.0
- ARV discount +10.5/15.0
- Appreciation +10.0/10.0
- 1% rule +6.3/10.0
- DSCR +5.7/10.0
- Livability +3.1/5.0
- Rent growth +2.5/5.0
- Condition / age +2.5/5.0
- Schools +2.4/10.0
$114,900
🖨 Deal sheet 📄 Offer letter ✓ Due diligence
Listing remarks MLS
Move in ready, with so much new, new, new! New Bathrooms, New flooring, New Carpet, hot water heater in 2019, New solid wood doors & New Paint. This 3 bedroom, 1.5 bath, First floor laundry, with a charming front porch, is ready for it's new owner. Nice back yard with a poured concrete slab that could be the start of a garage or nice shed. Please remove shoes or wear covers to protect the new carpet. Come check out to see if this is the home for you. Buyers agent to verify taxes.
Key facts
- Covered porch
- Large backyard
- New roof
Tags
Property features AI
Exterior
- Parking: No garage
- Utilities: Cable available; Public water available; Sewer connected; Water listed as not connected / public
- Home design: Two-story house; Resale property; Shingle roof
- Construction: Vinyl siding; Insulated attic/crawl hatchway(s); Stone foundation; Existing structure
- Exterior features: Blacktop driveway; Patio; Rectangular lot (139 x 60)
Interior
- Kitchen: Free-standing range; Oven; Range hood; Refrigerator; Exhaust fan
- Bedrooms: Bedroom 1 (Second level); Bedroom 2 (Second level); Bedroom 3 (Second level); Bedroom 4; Bedroom 5
- Flooring: Carpet; Laminate; Varied flooring
- Bathrooms: 1 full bathroom; 1 half bathroom; 1 main-level bathroom
- Heating & cooling: Gas forced-air heating
- Interior features: Ceiling fans; Country kitchen; Pull-down attic stairs; Full basement
- Laundry & utility: Washer; Dryer; Main-level laundry
Neighborhood map
What this means for you Summary
Snapshot
- This is a 3-bed/1.5-bath single-family listed at $115k.
Deal economics
- At list price, monthly cash flow is $101 ($1k/yr) — positive.
- The deal already cash-flows at list — no discount required.
- Meets the 1% rule at list price ($1k rent vs $115k).
- Recommended offer: $111k (3.0% below list) — sets the bar for market timing.
- Cap rate 7.3% vs local median 10.1% in Elmira — below-typical yield; the buyer is paying a premium for something (appreciation thesis, condition, location) that the cap rate doesn't capture.
Location & tenants
- Location reads 62/100 on livability (#832 in NY) — a middle-class / working-renter tenant base. Strengths: cost of living A+, housing A+, health & safety A+; Watch: schools F, crime F, amenities F.
- Elmira City School District (urban): math 23% / reading 35% proficiency, ranked #580 of 590 in NY (top 98%) — low school quality limits family demand, transient renter base, plan for 1-2y turnover.
- Market conditions: 78 active listings in the ZIP; 8 comparable units currently listed for rent nearby; rentals lingering (median 44d on market — plan ~5-8 weeks vacancy on turnover, expect pricing pressure); 100% of comp listings sitting > 30 days — soft ceiling on asking rent; 91 units permitted in Chemung County in 2024 (63 in 5+ unit buildings).
Forward outlook
- In year one you build about $12k of equity ($794 loan paydown + $11k appreciation (10.0% local appreciation)).
- Chemung County population projected at -17% by 2050 — secular population decline; favor cash flow + early exit over multi-decade hold.
- At projected returns (10.0% appreciation + 3.0% rent growth), your $32k cash investment doubles in ~3 years — after that, you're playing with house money.
- By year 3, paydown + projected appreciation supports a ~$31k cash-out refi (75% LTV) — recoverable capital for the next deal without selling this one.
Negotiation context
- It's been on market 38 days — a 3% lower offer ($111k) is reasonable based on typical stale-listing flexibility.
- 9 sale attempts since 22y ago with the ask held roughly flat each time — persistent listings suggest the price (not the market) is what's stuck; bring a comps-based counter.
- Current owner paid $67k; list at $115k implies a 71% gain — meaningful room to come down on a strong offer.
Risks & watch-outs
- Watch-outs: property tax is 2.9% of price; built in 1890 — expect roof / HVAC / electrical / plumbing capex.
Questions for the listing agent
- It's been on market 38 days. Have you received any prior offers? Is the seller open to a 3% concession, seller financing, or rate buy-down credit?
- Built in 1890 — when were the roof, HVAC, electrical panel, plumbing, and water heater last replaced?
- Property tax is high relative to price — has the assessment been appealed recently, and will the sale trigger a re-assessment?
- Is there a deadline driving the sale (1031 exchange, divorce, estate, relocation)? That informs how much negotiation room exists.
- Schools are F-rated, which usually means shorter tenancies and higher turnover. Who's the typical renter profile here, and what's been the actual vacancy rate?
- Crime grade is F in this area — have there been break-ins, vandalism, or insurance claims at this property in the last 3 years? What carrier currently insures it and at what premium?
- What's the average days-on-market for RENTAL listings here right now (not sales)? A rising rental-DOM trend means longer vacancies and softer asking-rent achievability than the comps imply.
- What's the recent tenant-quality profile in this submarket — average credit score on applications, eviction rate, late-payment / NSF rate, and stable-employment percentage? A property-management company in the area should have these aggregated.
- How much new for-sale + rental construction is in the pipeline within 1–3 miles? Heavy new supply typically softens prices + rents 12–24 months out; constrained supply supports both.
Investment metrics
- 1% rule
- 1.13% ✓
- Cap rate
- 7.35%
- Cash-on-cash
- 3.77%
- DSCR
- 1.17
- GRM
- 7.4
CMA / ARV
- ARV (median comp)
- $123,213
- List price
- $114,900
- Delta
- -6.75%
- Verdict
- FAIR
- Comps
- 20 within 1.0 mi
Show comp detail 12 sales within ~0.75 mi
| Address | Dist | Beds/Ba | Sqft | Sold | Price | $/sf | Match |
|---|---|---|---|---|---|---|---|
| 347 Irvine Pl | 0.27mi | 3/1.0 | 1,167 (-6%) | 5mo | $30,000 | $26 | 70 |
| 336 W Washington Ave | 0.25mi | 3/2.0 | 1,344 (+8%) | 5mo | $119,900 | $89 | 69 |
| 660 Walnut St | 0.14mi | 4/1.5 (+1) | 1,400 (+12%) | 1mo | $150,000 | $107 | 68 |
| 403 Roe Ave | 0.45mi | 3/1.5 | 1,272 (+2%) | 11mo | $148,000 | $116 | 67 |
| 1002 Johnson St | 0.49mi | 3/1.0 | 1,276 (+2%) | 8mo | $82,500 | $65 | 65 |
| 823 Canal St | 0.59mi | 2/— (-1) | 1,242 (-0%) | 8mo | $12,000 | $10 | 60 |
| 340 Webber Pl | 0.37mi | 3/1.0 | 1,131 (-9%) | 9mo | $115,000 | $102 | 57 |
| 418 Tompkins St | 0.67mi | 3/1.0 | 1,190 (-5%) | 4mo | $162,720 | $137 | 55 |
| 921 Grove St | 0.40mi | 3/1.0 | 1,414 (+13%) | 5mo | $134,000 | $95 | 52 |
| 965 Wisner St | 0.57mi | 3/1.0 | 1,358 (+9%) | 9mo | $20,000 | $15 | 49 |
| 561 W Washington Ave | 0.31mi | 2/1.5 (-1) | 1,421 (+14%) | 10mo | $130,000 | $91 | 49 |
| 1106 Walnut | 0.71mi | 2/1.0 (-1) | 1,390 (+11%) | 11mo | $94,000 | $68 | 31 |
Match score weights: distance 35% · size 25% · config 20% · recency 20%. Top-matched comps best support the ARV.
Projected returns pro-forma
10.0% appreciation · 3.0% rent growth · sell at horizon
- IRR
- 27.0%
- Equity multiple
- 3.15×
- Total profit
- $69,121
- Equity at exit
- $103,511
- IRR
- 23.7%
- Equity multiple
- 7.18×
- Total profit
- $198,680
- Equity at exit
- $223,225
Cash invested: $32,172 (down + closing). Projections, not guarantees.
Landlord ↔ Tenant lean methodology
- Overall (STATE)
- 15 Strongly Tenant-Friendly
- State New York
- 15 Strongly Tenant-Friendly · D+10
- County
- — inherits STATE
- City
- — inherits STATE
ZIP-level market 14901
- Home prices YoY
- 15.9%
- Active inventory
- 78
- Price-to-rent
- 7.4×
Monthly cashflow live
- Estimated rent
- $1,298 high interval (Pro) →
- Mortgage (P&I)
- −$603
- Tax from tax record
- −$274 /mo · $3,284/yr
- Insurance
- −$48
- HOA
- −$0
- Vacancy / Maint / Mgmt
- −$273
- Net cashflow
- $101
Break-even live
UW: 25.0% down · 7.5% · 30yr · 1.5% tax · 5.0% vac · 8.0% maint · 8.0% mgmt
Financing live
Cash to close
- Down payment
- $28,725
- Closing costs
- $3,447
- Reserves months
- —
- Total cash needed
- —
Loan-product check · same deal, 3 products live
Conventional
25% down · 7.5% · 30yr
- Down + closing
- —
- Monthly P&I
- —
- Monthly cashflow
- —
- DSCR
- —
- Eligible?
- —
Personal DTI + credit; lowest rate.
DSCR
20% down · 8.5% · 30yr
- Down + closing
- —
- Monthly P&I
- —
- Monthly cashflow
- —
- DSCR
- —
- Eligible?
- —
No personal income docs; deal must DSCR.
Hard money
10% down · 12.0% · 12mo
- Down + closing
- —
- Monthly P&I
- —
- Monthly cashflow
- —
- DSCR
- —
- Eligible?
- —
Short-term bridge; refi at stabilization.
Rent comps 8 comps
| Address | Beds | Baths | Sqft | Rent | $/sqft | DOM | Units | Dist |
|---|---|---|---|---|---|---|---|---|
| 454 W 2nd St Unit 1 Elmira, NY | 2.0 | 1.0 | 1400 | $1,000 | $0.71 | 43d | 1 | 0.33mi |
| 514 W 1st St Unit A Elmira, NY | 4.0 | 1.0 | 1416 | $1,275 | $0.90 | 43d | 1 | 0.42mi |
| 970 Scio St Elmira, NY | 2.0 | 1.0 | 911 | $1,200 | $1.32 | 43d | 1 | 0.55mi |
| 106 W 2nd St Unit A Elmira, NY | 3.0 | 1.0 | 1395 | $1,400 | $1.00 | 43d | 1 | 0.58mi |
| 363 W Water St #2 Elmira, NY | 3.0 | 1.0 | 1084 | $1,250 | $1.15 | 43d | 1 | 0.64mi |
| 410 E 2nd St Unit FS3W Elmira, NY | 3.0 | 1.0 | 800 | $1,250 | $1.56 | 43d | 1 | 0.86mi |
| 419 Jefferson St Unit A Elmira, NY | 2.0 | 2.0 | 1100 | $1,995 | $1.81 | 43d | 1 | 1.28mi |
| 1210 W Water St Elmira, NY | 2.0 | 2.0 | 1340 | $1,995 | $1.49 | 43d | 1 | 1.48mi |
Listing history 41 events
-
2026-06-19days on market $114,900 Active 38 DOM
-
2026-06-18days on market $114,900 Active 37 DOM
-
2026-06-17days on market $114,900 Active 36 DOM
-
2026-06-16days on market $114,900 Active 35 DOM
-
2026-06-16remarks 699-char remark
-
2026-06-15days on market $114,900 Active 34 DOM
-
2026-06-14days on market $114,900 Active 32 DOM
-
2026-06-12days on market $114,900 Active 31 DOM
-
2026-06-09days on market $114,900 Active 28 DOM
-
2026-06-08days on market $114,900 Active 27 DOM
-
2026-06-07days on market $114,900 Active 26 DOM
-
2026-06-05days on market $114,900 Active 23 DOM
-
2026-06-03days on market $114,900 Active 22 DOM
-
2026-06-02days on market $114,900 Active 21 DOM
-
2026-06-01days on market $114,900 Active 20 DOM
-
2026-05-31days on market $114,900 Active 19 DOM
-
2026-05-30days on market $114,900 Active 18 DOM
-
2026-05-12$114,900 Active 268-char remark
-
2025-03-23historical
-
2025-03-06price $123,000
-
2025-03-04price $123,900
-
2024-11-03historical $1,600
-
2024-09-23$124,900 Active
-
2024-07-19$1,600
-
2022-03-11soldstatus $67,000
-
2022-03-08soldstatus $66,000
Show marketing remark (491 chars)
Move in ready, with so much new, new, new! New Bathrooms, New flooring, New Carpet, hot water heater in 2019, New solid wood doors & New Paint. This 3 bedroom, 1.5 bath, First floor laundry, with a charming front porch, is ready for it's new owner. Nice back yard with a poured concrete slab that could be the start of a garage or nice shed. Please remove shoes or wear covers to protect the new carpet. Come check out to see if this is the home for you. Buyers agent to verify taxes.
-
2021-11-30$74,900
Show marketing remark (491 chars)
Move in ready, with so much new, new, new! New Bathrooms, New flooring, New Carpet, hot water heater in 2019, New solid wood doors & New Paint. This 3 bedroom, 1.5 bath, First floor laundry, with a charming front porch, is ready for it's new owner. Nice back yard with a poured concrete slab that could be the start of a garage or nice shed. Please remove shoes or wear covers to protect the new carpet. Come check out to see if this is the home for you. Buyers agent to verify taxes.
-
2021-04-13soldstatus $26,000
-
2017-11-20$29,000
-
2016-01-22historical
-
2015-07-22$50,000
-
2012-05-16soldstatus $22,000
-
2011-10-08historical
-
2011-04-08$71,000
-
2011-02-24historical
-
2010-08-24$57,500
-
2004-10-01soldstatus $27,000
-
2004-04-15$34,000
-
2004-03-12soldstatus $56,700
-
2000-05-22soldstatus $63,000
-
1993-09-01soldstatus $46,000
ⓘ Source: listings_history table (triggers on properties + properties_extension) + one-shot
backfill from property_details.listing_events for pre-trigger history.
Tax reassessment forecast NY · Partial reset (capped growth)
- Current annual tax
- $3,284 · $274/mo
- Projected year-2 tax
- $3,284 · $274/mo
- Expected delta
- $0/yr ($0/mo · 0.0%)
ⓘ Screening estimate from a state-policy table — verify with the county assessor before closing.
Climate risk First Street
- Flood 4/10 Moderate FEMA zone X · 20% chance over 30 yrs
- Wildfire 3/10 Moderate
- Heat 3/10 Moderate 7 d/yr ≥97°F today · 16 d/yr by 30 yrs out
- Wind 2/10 Low 100% chance of damaging wind over 30 yrs
- Air quality 1/10 Low 0 unhealthy d/yr today · 0 by 30 yrs out
Nearby sold comps map
Loading sold comps map…
Walkable amenities ~0.75 mi
Loading nearby amenities…
Taxation est. · year 1
- Rental income
- $15,574
- − Mortgage interest
- −$6,436
- − Property taxes
- −$3,284
- − Insurance
- −$574
- − Repairs & maintenance
- −$1,246
- − Management
- −$1,246
- − Depreciation
- −$3,343
- Taxable loss
- −$555
- Est. tax savings @ 24.0%
- +$133
- After-tax cash flow
- $1,347/yr
For passive investors: Depreciation is non-cash, so a rental often shows a tax loss while cash-flowing — sheltering income. Rental losses are passive: they offset passive income freely, and up to $25,000/yr can offset ordinary (W-2) income if you actively participate and your MAGI is under $100k (phasing out to $0 by $150k); unused losses carry forward. On sale, claimed depreciation is recaptured at up to 25%, and gains may owe capital-gains tax (a 1031 exchange can defer both). Figures are a year-1 estimate at your 24.0% rate — not tax advice; consult a CPA.
Schools (NCES district)
- District
- Elmira City School District
- NCES district ID
- 3610560
- Math proficiency
- 23% ▼ -7.00%
- Reading proficiency
- 35% ▲ 7.00%
- Median HH income
- $40,180
- Composite
- 24.39/100
- National rank
- #7688
- State rank
- #580 of 590 in NY
Livability — Elmira
- Score
- 62/100
- State rank
- #832
- US rank
- #16139
Category grades
Schools grade is shown separately in the Schools card above.
Census & demographics
- Census place
- Elmira, NY
- City population
- 14,276
- Population (ZIP)
- 14,430
Population outlook (Chemung County) Hauer SSP2
- Today (2025)
- 82,931 people
- By 2030
- 80,356 · -3.1%
- By 2040
- 74,745 · -9.9%
- By 2050
- 69,012 · -16.8%
- By 2075
- 55,689 · -32.8%
- By 2100
- 41,428 · -50.0%
Race, ethnicity, and origin ACS 2023
- Neighborhood character
- Predominantly White (70%)
- Race & ethnicity
- White 70% Black 15% Two or more races 7% Hispanic / Latino 7% Asian 1%
- Hispanic origin (detail)
- Mexican 1% Puerto Rican 3%
- Common ancestry
- Romanian 4% Slovak 3% Iranian 2%
- Foreign-born
- 4% · Canada, China
- Languages at home
- 93% English-only · Spanish 3% Russian/Polish/Slavic 1% Chinese 1%
Political lean MEDSL · Chemung
- 2024 margin
- R (+16.8) · D 41.6% · R 58.4%
- 2008→2024 swing
- -15.6pp toward R · 2008: -1.2pp · 2024: -16.8pp
- All cycles
- 2024: R+16.8 2020: R+13.4 2016: R+20.0 2012: R+2.9 2008: R+1.2
Not yet ingested
- Civics
- —
Market trends
- HPI YoY
- ▲ 32.34%
- Current HPI
- 236.2674
- Rent YoY
- —
- Metro
- —
- State GDP YoY
- ▲ 2.60%
- F500 in state
- 92
Industry mix (Fortune 500 HQ in NY)
| Industry | F500 HQs | Revenue |
|---|---|---|
| Financial Services | 10 | $950B |
|
||
| Consumer Goods | 9 | $162B |
|
||
| Insurance | 4 | $225B |
|
||
| Telecommunications | 2 | $144B |
|
||
| Pharmaceuticals | 2 | $112B |
|
||
| Media / Entertainment | 2 | $69B |
|
||
Price history
+149.8% since first listed24 events — show timeline
- 2026-05-12 Listed $114,900 UNYREIS
- 2025-03-23 Listing Removed — UNYREIS
- 2025-03-06 Price Changed $123,000 UNYREIS
- 2025-03-04 Price Changed $123,900 UNYREIS
- 2024-11-03 Rental Removed $1,600 APPFOLIO
- 2024-09-23 Listed $124,900 UNYREIS
- 2024-07-19 Listed for Rent $1,600 APPFOLIO
- 2022-03-11 Sold (Public Records) $67,000 Public Records
- 2022-03-08 Sold (MLS) $66,000 UNYREIS
- 2021-11-30 Listed $74,900 UNYREIS
- 2021-04-13 Sold (Public Records) $26,000 Public Records
- 2017-11-20 Listed $29,000 UNYREIS
- 2016-01-22 Listing Removed — UNYREIS
- 2015-07-22 Listed $50,000 UNYREIS
- 2012-05-16 Sold (Public Records) $22,000 Public Records
- 2011-10-08 Listing Removed — UNYREIS
- 2011-04-08 Listed $71,000 UNYREIS
- 2011-02-24 Listing Removed — UNYREIS
- 2010-08-24 Listed $57,500 UNYREIS
- 2004-10-01 Sold (MLS) $27,000 UNYREIS
- 2004-04-15 Listed $34,000 UNYREIS
- 2004-03-12 Sold (Public Records) $56,700 Public Records
- 2000-05-22 Sold (Public Records) $63,000 Public Records
- 1993-09-01 Sold (Public Records) $46,000 Public Records
Property tax history
+6.0%/yrLatest (2025): $3,284 · -34.4% YoY. Source: county tax records.
Cash-flow waterfall
monthlySold comps — $/sqft
last 12 mo · ≤1 miLoading sold comps…