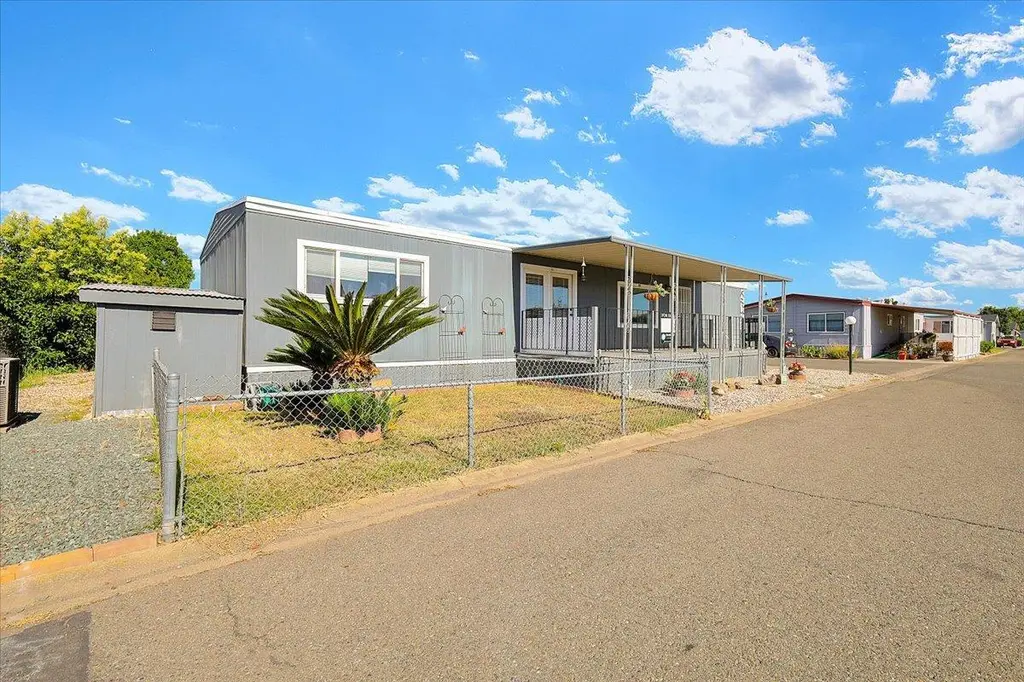
1155 Pease Rd #49 · Yuba City, CA
Flood risk 1/10 · Minimal
- FEMA flood zone
- —
- Chance of flooding over 30 yrs
- 0.0%
- Est. flood insurance / yr
- —
Fire risk 8/10 · Major
- Est. fire insurance / yr
- $659 – $1,223
Heat risk 7/10 · Major
- Hot days now (above 105°F)
- 7 days/yr
- Hot days in 30 yrs
- 16 days/yr
Wind risk 1/10 · Minimal
- Chance of severe wind over 30 yrs
- —
Air-quality risk 10/10 · Severe
- Unhealthy air days now
- 28 days/yr
- Unhealthy air days in 30 yrs
- 32 days/yr
Risk factors via First Street. Map © Google.
Why this score? — see what drove the B+ grade
The composite is a weighted blend of 9 inputs, each scored 0–100. Each bar is that input's sub-score; the figure is the points it added to the 100-point composite (weight × sub-score).
- Cash flow +30.0/30.0
- ARV discount +15.0/15.0
- 1% rule +10.0/10.0
- DSCR +10.0/10.0
- Condition / age +4.0/5.0
- Livability +3.8/5.0
- Schools +3.2/10.0
- Rent growth +2.9/5.0
- Appreciation +0.0/10.0
$115,000
🖨 Deal sheet 📄 Offer letter ✓ Due diligence
Listing remarks
Move-in ready home in a 55+ community! Spacious 1,500+ sq. ft. home features 3 bedrooms, 2 baths, and a cozy fireplace. Located on a corner lot in the peaceful Village Green Senior Park. Large open greatroom with master bedroom on one side of the home and additional 2 bedrooms on the opposite side. Exterior covered parking and plenty of gardening space. Fees include access to community pool & clubhouse, water, sewer and cable.
Key facts
- Gardening space
- Covered parking
- Clubhouse
Tags
Property features AI
Finance
- Other: Directions: Live Oak Blvd to Pease Rd; Address: 1155 Pease Rd #49, Yuba City, CA 95991
- Financial info: Land lease: No (land lease amount noted separately)
- HOA & community: No homeowners association; Senior community
Exterior
- Parking: Attached covered parking; No garage
- Utilities: Public water; Public sewer; Cable available; Electric: Other
- Home design: Manufactured in park (double wide); Updated/remodeled; Built in 1974
- Construction: Aluminum skirting; Lancer make; Bitumen roof
- Exterior features: Corner lot; Carport awning; Porch awning; Covered deck; Covered patio; Storage/shed(s)
Interior
- Kitchen: Pantry cabinet; Laminate countertops; Dishwasher; Free-standing electric range
- Bedrooms: 3 bedrooms (includes master bedroom)
- Flooring: Laminate flooring; Tile flooring
- Bathrooms: 2 full bathrooms; Tub with shower over
- Heating & cooling: Central heating; Central air conditioning; Ceiling fans
- Interior features: Updated/remodeled interior; One living room fireplace (in living room); Dual-pane full windows; Covered deck, covered patio, and porch steps; Porch awning and carport awning; Storage/shed(s) on property
- Laundry & utility: Inside laundry room
Neighborhood map
What this means for you Summary
Snapshot
- This is a 3-bed/2.0-bath manufactured listed at $115k. Condition is rated good.
Deal economics
- At list price, monthly cash flow is $1k ($13k/yr) — positive.
- The deal already cash-flows at list — no discount required.
- Meets the 1% rule at list price ($2k rent vs $115k).
- Recommended offer: $113k (1.5% below list) — sets the bar for market timing.
- Cap rate 17.5% vs local median 3.6% in Yuba City — top-decile yield for the area; either an underpriced asset or a hidden risk that comps aren't pricing in. Stress-test before assuming the spread holds.
Location & tenants
- Location reads 75/100 on livability (#111 in CA, #3,863 nationally) — a middle-class / working-renter tenant base. Strengths: commute A+, housing A+, health & safety A+; Watch: crime D+, schools D, cost of living F.
- Yuba City Unified (urban): math 20% / reading 53% proficiency, ranked #263 of 517 in CA (top 51%) — families likely to look elsewhere, expect single-tenant / working-renter base with shorter leases.
- Market conditions: Rents rising (+1.8%/yr); 149 active listings in the ZIP; 3 comparable units currently listed for rent nearby; rentals lingering (median 44d on market — plan ~5-8 weeks vacancy on turnover, expect pricing pressure); 67% of comp listings sitting > 30 days — soft ceiling on asking rent; 73 units permitted in Sutter County in 2024 (0 in 5+ unit buildings).
- This rent runs 40% of the median local income ($71k/yr) — at the standard rent-burdened threshold; future hikes will face affordability resistance.
Forward outlook
- Local home prices are declining (-3.0%/yr); year-one equity from $795 of loan paydown is wiped out by about $3k of value loss. Plan a longer hold.
- Sutter County population projected to shrink 4% by 2050 — rents likely to lag national; underwrite the cash flow, not the appreciation.
- At projected returns (-3.0% appreciation + 1.8% rent growth), your $32k cash investment doubles in ~4 years — after that, you're playing with house money.
Negotiation context
- It's been on market 19 days — a 2% lower offer ($113k) is reasonable based on typical stale-listing flexibility.
Risks & watch-outs
- Climate carrying-cost: severe wildfire risk; extreme-heat days projected 7→16/yr by 2055 (HVAC capex compounding) — expect insurance premiums to compound above CPI over the hold.
Questions for the listing agent
- Built in 1974 — when were the roof, HVAC, electrical panel, plumbing, and water heater last replaced?
- Is there a deadline driving the sale (1031 exchange, divorce, estate, relocation)? That informs how much negotiation room exists.
- Schools are D-rated, which usually means shorter tenancies and higher turnover. Who's the typical renter profile here, and what's been the actual vacancy rate?
- Crime grade is D in this area — have there been break-ins, vandalism, or insurance claims at this property in the last 3 years? What carrier currently insures it and at what premium?
- What's the average days-on-market for RENTAL listings here right now (not sales)? A rising rental-DOM trend means longer vacancies and softer asking-rent achievability than the comps imply.
- What's the recent tenant-quality profile in this submarket — average credit score on applications, eviction rate, late-payment / NSF rate, and stable-employment percentage? A property-management company in the area should have these aggregated.
- How much new for-sale + rental construction is in the pipeline within 1–3 miles? Heavy new supply typically softens prices + rents 12–24 months out; constrained supply supports both.
Investment metrics
- 1% rule
- 2.05% ✓
- Cap rate
- 17.48%
- Cash-on-cash
- 39.94%
- DSCR
- 2.78
- GRM
- 4.1
CMA / ARV
- ARV (on-the-fly)
- $161,280
- Comps found
- 12
Show comp detail 12 sales within ~0.75 mi
| Address | Dist | Beds/Ba | Sqft | Sold | Price | $/sf | Match |
|---|---|---|---|---|---|---|---|
| 1155 Pease Rd #517 | 0.16mi | 3/2.0 | 1,536 (0%) | 5mo | $95,000 | $62 | 88 |
| 1155 Pease Rd #12 | 0.16mi | 3/2.0 | 1,536 (0%) | 16mo | $115,000 | $75 | 79 |
| 3120 Live Oak Blvd #150 | 0.36mi | 4/2.0 (+1) | 1,560 (+2%) | 6mo | $177,777 | $114 | 70 |
| 3120 Live Oak Blvd #162 | 0.29mi | 4/2.0 (+1) | 1,560 (+2%) | 14mo | $205,000 | $131 | 68 |
| 3120 Live Oak Blvd #111 | 0.36mi | 3/2.0 | 1,664 (+8%) | 2mo | $175,000 | $105 | 68 |
| 3120 Live Oak #44 | 0.25mi | 3/2.0 | 1,440 (-6%) | 13mo | $177,500 | $123 | 67 |
| 3120 Live Oak Blvd #102 | 0.28mi | 3/2.0 | 1,680 (+9%) | 6mo | $165,000 | $98 | 66 |
| 1155 Pease Rd #224 | 0.05mi | 2/2.0 (-1) | 1,320 (-14%) | 4mo | $100,000 | $76 | 66 |
| 3120 Live Oak Blvd #23 | 0.37mi | 2/2.0 (-1) | 1,536 (0%) | 15mo | $160,000 | $104 | 65 |
| 3120 Live Oak Blvd #167 | 0.24mi | 3/2.0 | 1,338 (-13%) | 8mo | $140,000 | $105 | 61 |
| 3120 Live Oak Blvd #126 | 0.37mi | 2/2.0 (-1) | 1,508 (-2%) | 16mo | $199,000 | $132 | 61 |
| 3120 Live Oak Blvd #20 | 0.41mi | 2/2.0 (-1) | 1,440 (-6%) | 11mo | $202,000 | $140 | 57 |
Match score weights: distance 35% · size 25% · config 20% · recency 20%. Top-matched comps best support the ARV.
Projected returns pro-forma
-3.0% appreciation · 1.79% rent growth · sell at horizon
- IRR
- 34.9%
- Equity multiple
- 2.45×
- Total profit
- $46,824
- Equity at exit
- $17,147
- IRR
- 41.1%
- Equity multiple
- 4.65×
- Total profit
- $117,438
- Equity at exit
- $9,943
Cash invested: $32,200 (down + closing). Projections, not guarantees.
Landlord ↔ Tenant lean methodology
- Overall (STATE)
- 18 Strongly Tenant-Friendly
- State California
- 18 Strongly Tenant-Friendly · D+13
- County
- — inherits STATE
- City
- — inherits STATE
ZIP-level market 95991
- Rents YoY
- 1.8%
- Active inventory
- 149
- Price-to-rent
- 4.1×
Monthly cashflow live
- Estimated rent
- $2,363 medium interval (Pro) →
- Mortgage (P&I)
- −$603
- Tax est. 1.5%
- −$144 /mo · $1,725/yr
- Insurance
- −$48
- HOA
- −$0
- Vacancy / Maint / Mgmt
- −$496
- Net cashflow
- $1,072
Break-even live
UW: 25.0% down · 7.5% · 30yr · 1.5% tax · 5.0% vac · 8.0% maint · 8.0% mgmt
Financing live
Cash to close
- Down payment
- $28,750
- Closing costs
- $3,450
- Reserves months
- —
- Total cash needed
- —
Loan-product check · same deal, 3 products live
Conventional
25% down · 7.5% · 30yr
- Down + closing
- —
- Monthly P&I
- —
- Monthly cashflow
- —
- DSCR
- —
- Eligible?
- —
Personal DTI + credit; lowest rate.
DSCR
20% down · 8.5% · 30yr
- Down + closing
- —
- Monthly P&I
- —
- Monthly cashflow
- —
- DSCR
- —
- Eligible?
- —
No personal income docs; deal must DSCR.
Hard money
10% down · 12.0% · 12mo
- Down + closing
- —
- Monthly P&I
- —
- Monthly cashflow
- —
- DSCR
- —
- Eligible?
- —
Short-term bridge; refi at stabilization.
Rent comps 3 comps
| Address | Beds | Baths | Sqft | Rent | $/sqft | DOM | Units | Dist |
|---|---|---|---|---|---|---|---|---|
| 1335 Meadowlark Way Yuba City, CA | 3.0 | 2.0 | 1710 | $2,500 | $1.46 | 43d | 1 | 0.94mi |
| 1101 Northgate Dr Yuba City, CA | 3.0 | 2.0 | 1817 | $2,300 | $1.27 | 43d | 1 | 0.97mi |
| 1722 Clark Ave Yuba City, CA | 3.0 | 2.0 | 1479 | $2,500 | $1.69 | 21d | 1 | 1.18mi |
Listing history 16 events
-
2026-06-19days on market $115,000 Active 19 DOM
-
2026-06-18days on market $115,000 Active 18 DOM
-
2026-06-17days on market $115,000 Active 17 DOM
-
2026-06-16days on market $115,000 Active 16 DOM
-
2026-06-15days on market $115,000 Active 15 DOM
-
2026-06-14days on market $115,000 Active 13 DOM
-
2026-06-13days on market $115,000 Active 12 DOM
-
2026-06-10days on market $115,000 Active 10 DOM
-
2026-06-09days on market $115,000 Active 9 DOM
-
2026-06-08days on market $115,000 Active 8 DOM
-
2026-06-07days on market $115,000 Active 7 DOM
-
2026-06-05days on market $115,000 Active 4 DOM
-
2026-06-03days on market $115,000 Active 3 DOM
-
2026-06-02days on market $115,000 Active 2 DOM
-
2026-06-01remarks 433-char remark
-
2026-06-01$115,000 Active 1 DOM
ⓘ Source: listings_history table (triggers on properties + properties_extension) + one-shot
backfill from property_details.listing_events for pre-trigger history.
Climate risk First Street
- Flood 1/10 Low 0% chance over 30 yrs
- Wildfire 8/10 Severe
- Heat 7/10 Severe 7 d/yr ≥105°F today · 16 d/yr by 30 yrs out
- Wind 1/10 Low
- Air quality 10/10 Extreme 28 unhealthy d/yr today · 32 by 30 yrs out
Nearby sold comps map
Loading sold comps map…
Walkable amenities ~0.75 mi
Loading nearby amenities…
Taxation est. · year 1
- Rental income
- $28,353
- − Mortgage interest
- −$6,442
- − Property taxes
- −$1,725
- − Insurance
- −$575
- − Repairs & maintenance
- −$2,268
- − Management
- −$2,268
- − Depreciation
- −$3,345
- Taxable income
- $11,729
- Est. tax owed @ 24.0%
- −$2,815
- After-tax cash flow
- $10,047/yr
For passive investors: Depreciation is non-cash, so a rental often shows a tax loss while cash-flowing — sheltering income. Rental losses are passive: they offset passive income freely, and up to $25,000/yr can offset ordinary (W-2) income if you actively participate and your MAGI is under $100k (phasing out to $0 by $150k); unused losses carry forward. On sale, claimed depreciation is recaptured at up to 25%, and gains may owe capital-gains tax (a 1031 exchange can defer both). Figures are a year-1 estimate at your 24.0% rate — not tax advice; consult a CPA.
Condition & rehab AI · 12 photos
This move-in ready manufactured home in a 55+ community is in good condition with minimal updates needed to enhance its resale and rental value.
Value-add opportunities
- Both Painting the exterior — Enhances curb appeal and value.
- Both Landscaping improvements — Enhances curb appeal and value.
- Both New flooring in bathrooms — Improves aesthetics and functionality.
- Both New kitchen appliances — Modernizes the space and adds value.
- Both New paint in interior walls — Refreshes the space and adds value.
Renovation cost estimate screening
Value-add ROI direction
- Both Painting the exterior — Enhances curb appeal and value. ↑
- Both Landscaping improvements — Enhances curb appeal and value. ↑
- Both New flooring in bathrooms — Improves aesthetics and functionality. ↑
- Both New kitchen appliances — Modernizes the space and adds value. ↑
- Both New paint in interior walls — Refreshes the space and adds value. ↑
ⓘ Cost ranges are severity-bucket heuristics (US national rule-of-thumb). Get contractor quotes + a written scope before underwriting a rehab budget.
Schools (NCES district)
- District
- Yuba City Unified
- NCES district ID
- 0643470
- Math proficiency
- 20% ▼ -10.00%
- Reading proficiency
- 53% ▲ 5.00%
- Median HH income
- $50,923
- Composite
- 31.55/100
- National rank
- #5956
- State rank
- #263 of 517 in CA
Livability — Yuba City
- Score
- 75/100
- State rank
- #111
- US rank
- #3863
Category grades
Schools grade is shown separately in the Schools card above.
Census & demographics
- Census place
- Yuba City, CA
- County
- Sutter County · 81,625 people
- City population
- 81,625
- Metro
- Yuba City, CA
- Population (ZIP)
- 42,579
- Household income
- $70,590
- Rent vs Own
- Severe rent burden
- 1674.0
Population outlook (Sutter County) Hauer SSP2
- Today (2025)
- 97,244 people
- By 2030
- 97,170 · -0.1%
- By 2040
- 96,137 · -1.1%
- By 2050
- 93,604 · -3.7%
- By 2075
- 85,008 · -12.6%
- By 2100
- 71,584 · -26.4%
Race, ethnicity, and origin ACS 2023
- Neighborhood character
- Diverse neighborhood (Simpson 0.68)
- Race & ethnicity
- Hispanic / Latino 41% White 37% Two or more races 19% Asian 12% Black 2% Native American 2%
- Hispanic origin (detail)
- Mexican 36% Puerto Rican 2%
- Common ancestry
- Slovak 2% Russian 1% Portuguese 1%
- Foreign-born
- 24% · Canada, Jamaica
- Languages at home
- 60% English-only · Spanish 28% Other Indo-European 10% Other Asian/Pacific 1%
Political lean MEDSL · Sutter
- 2024 margin
- Solid R (+31.4) · D 33.1% · R 64.5% · Other 2.4%
- 2008→2024 swing
- -14.7pp toward R · 2008: -16.7pp · 2024: -31.4pp
- All cycles
- 2024: R+31.4 2020: R+16.4 2016: R+16.3 2012: R+21.8 2008: R+16.7
Not yet ingested
- Civics
- —
Market trends
- HPI YoY
- ▼ -343.11%
- Current HPI
- 240.3835
- Rent YoY
- ▲ 1.79%
- Metro
- Yuba City, CA
- State GDP YoY
- ▲ 3.21%
- F500 in state
- 116
Industry mix (Fortune 500 HQ in CA)
| Industry | F500 HQs | Revenue |
|---|---|---|
| Technology | 27 | $1,492B |
|
||
| Financial Services | 3 | $174B |
|
||
| Retail | 3 | $44B |
|
||
| Insurance | 3 | $26B |
|
||
| Media / Entertainment | 2 | $115B |
|
||
| Pharmaceuticals / Biotech | 2 | $62B |
|
||
Cash-flow waterfall
monthlySold comps — $/sqft
last 12 mo · ≤1 miLoading sold comps…