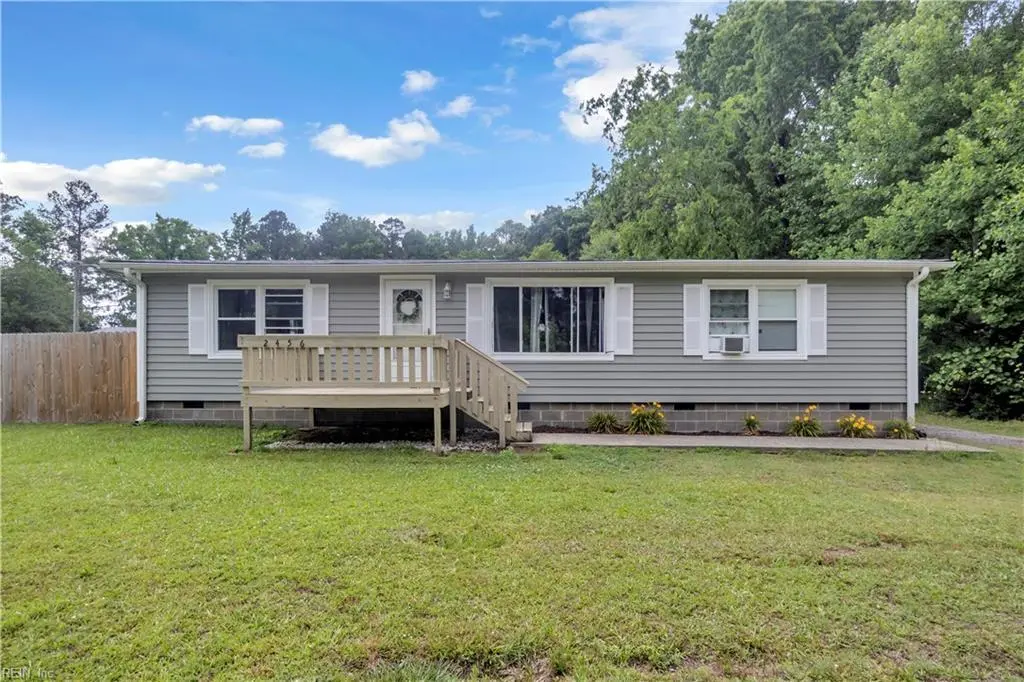
2456 Meadow Brook Trl · Suffolk, VA
Flood risk 1/10 · Minimal
- FEMA flood zone
- X (unshaded)
- Chance of flooding over 30 yrs
- 0.0%
- Est. flood insurance / yr
- $507 – $1,088
Fire risk 1/10 · Minimal
- Est. fire insurance / yr
- $666 – $1,236
Heat risk 8/10 · Major
- Hot days now (above 107°F)
- 7 days/yr
- Hot days in 30 yrs
- 16 days/yr
Wind risk 8/10 · Major
- Chance of severe wind over 30 yrs
- 80.0%
Air-quality risk 2/10 · Minimal
- Unhealthy air days now
- 1 days/yr
- Unhealthy air days in 30 yrs
- 1 days/yr
Risk factors via First Street. Map © Google.
Why this score? — see what drove the D- grade
The composite is a weighted blend of 9 inputs, each scored 0–100. Each bar is that input's sub-score; the figure is the points it added to the 100-point composite (weight × sub-score).
- ARV discount +8.5/15.0
- Cash flow +8.3/30.0
- Schools +4.8/10.0
- Rent growth +4.0/5.0
- Livability +3.9/5.0
- Condition / age +2.5/5.0
- DSCR +2.3/10.0
- 1% rule +1.9/10.0
- Appreciation +0.0/10.0
$310,000
🖨 Deal sheet (PDF) 📄 Offer letter ✓ Due diligence
Listing remarks
This beautiful ranch-style home offers comfort, space, and convenience all in one. Featuring huge rooms, oversized closets, and an extra-large pantry, there’s plenty of room to live and grow. The spacious primary suite includes a large bathroom, walk-in cedar-lined closet, and separate linen closet for added storage and luxury. Outside, enjoy a large storage shed/workshop plus an additional smaller shed — perfect for hobbies, tools, or extra storage. Located just minutes from shopping, dining, healthcare, the hospital, and local events in Suffolk, you’ll love having convenience without the congestion. Plus, easy access to all military bases makes commuting a breeze.
Key facts
- Ranch-style home
- Large storage shed
- Extra-large pantry
Tags
Property features AI
Finance
- HOA & community: No HOA (no association, no monthly POA/condo fees)
Exterior
- Parking: 2-space parking
- Utilities: City/County water; City/County sewer; Electric water heater; Electric service
- Home design: Detached single-story home; Farmhouse / Ranch / Traditional style; One living level
- Construction: Crawl foundation; Asphalt shingle roof
- Exterior features: Vinyl siding; Back yard fenced; Porch
Interior
- Kitchen: Electric range; Refrigerator; Dishwasher; Pantry; Breakfast area
- Bedrooms: First-floor master bedroom; One bedroom with ensuite
- Flooring: Carpet; Laminate
- Bathrooms: Two full bathrooms
- Heating & cooling: Heat pump heating; Central air conditioning
- Interior features: Walk-in closet; Carpet and laminate flooring
- Laundry & utility: Washer hookup; Dryer hookup; Utility room
Neighborhood map
What this means for you Summary
Snapshot
- This is a 3-bed/2.0-bath single-family listed at $310k.
Deal economics
- At list price, monthly cash flow is $-284 ($-3k/yr) — negative.
- To cash-flow at today's rent, offer at most $260k (16.2% below list).
- To meet the 1% rule (rent ≥ 1% of price), the offer needs to be $213k (31.3% below list).
- Recommended offer: $213k (31.3% below list) — sets the bar for 1% rule.
- Cap rate 5.2% vs local median 3.5% in Suffolk — top-decile yield for the area; either an underpriced asset or a hidden risk that comps aren't pricing in. Stress-test before assuming the spread holds.
Location & tenants
- Location reads 77/100 on livability (#88 in VA, #2,896 nationally) — a middle-class / working-renter tenant base. Strengths: housing A+, health & safety A+, employment A-; Watch: crime C-, commute F.
- Suffolk City Public School District (suburban): math 41% / reading 69% proficiency, ranked #72 of 131 in VA (top 55%) — acceptable for families but not a draw, mixed tenant base, ~2y average lease.
- Zoned schools: Hillpoint Elementary (math 31% / reading 57%, grade F, #851 of 1,108 statewide, top 77%, 737 students, 65% FRL); King'S Fork High (math 44% / reading 77%, grade C+, #244 of 319 statewide, top 77%, 1,697 students, 63% FRL) — zoned schools average 64% FRL vs 39% district-wide (25 pts higher); higher-poverty schools than district average — tighter screening recommended.
- Market conditions: Rents rising fast (+5.8%/yr); 546 active listings in the ZIP; 12 comparable units currently listed for rent nearby; rentals at typical pace (median 18d on market — plan ~3-4 weeks tenant-placement turnaround); 42% of comp listings sitting > 30 days — soft ceiling on asking rent; solid renter incomes; 680 units permitted in Suffolk city in 2024 (0 in 5+ unit buildings).
- This rent runs 32% of the median local income ($80k/yr) — at the standard rent-burdened threshold; future hikes will face affordability resistance.
Forward outlook
- Local home prices are declining (-3.0%/yr); year-one equity from $2k of loan paydown is wiped out by about $9k of value loss. Plan a longer hold.
- Suffolk County population projected at +11% by 2050 — modest demand growth; plan on rents tracking national, not racing it.
Negotiation context
- It's been on market 25 days — a 2% lower offer ($305k) is reasonable based on typical stale-listing flexibility.
- 4 sale attempts since 7y ago with the ask held roughly flat each time — persistent listings suggest the price (not the market) is what's stuck; bring a comps-based counter.
- Current owner paid $265k; 17% above their basis — modest negotiation headroom, anchor on the comps not their cost.
Risks & watch-outs
- Climate carrying-cost: severe wind risk, 80% chance of damaging wind over 30y; extreme-heat days projected 7→16/yr by 2055 (HVAC capex compounding) — expect insurance premiums to compound above CPI over the hold.
Questions for the listing agent
- What do current leases actually rent for vs. the listed asking? Can we see a recent rent roll and the last 12 months of T-12 income?
- Is there a deadline driving the sale (1031 exchange, divorce, estate, relocation)? That informs how much negotiation room exists.
- Schools are A-rated — typically a magnet for longer-tenancy family renters. What's the average tenant stay here, and is there a school-zone premium baked into asking?
- The area grade is low — what's the realistic commute time and amenity access for the typical tenant pool here? Any planned neighborhood developments (good or bad) we should know about?
- What's the average days-on-market for RENTAL listings here right now (not sales)? A rising rental-DOM trend means longer vacancies and softer asking-rent achievability than the comps imply.
- What's the recent tenant-quality profile in this submarket — average credit score on applications, eviction rate, late-payment / NSF rate, and stable-employment percentage? A property-management company in the area should have these aggregated.
- How much new for-sale + rental construction is in the pipeline within 1–3 miles? Heavy new supply typically softens prices + rents 12–24 months out; constrained supply supports both.
Investment metrics
- 1% rule
- 0.69% ✗
- Cap rate
- 5.19%
- Cash-on-cash
- -3.93%
- DSCR
- 0.83
- GRM
- 12.1
CMA / ARV
- ARV (on-the-fly)
- $317,016
- Comps found
- 12
Show comp detail 12 sales within ~0.75 mi
| Address | Dist | Beds/Ba | Sqft | Sold | Price | $/sf | Match |
|---|---|---|---|---|---|---|---|
| 318 Shore Dr | 0.37mi | 3/2.0 | 1,491 (+4%) | 5mo | $315,000 | $211 | 71 |
| 132 Ashford Dr | 0.53mi | 3/2.0 | 1,440 (+1%) | 7mo | $355,000 | $247 | 68 |
| 102 Berkshire Blvd | 0.70mi | 3/2.5 | 1,443 (+1%) | 0mo | $340,000 | $236 | 64 |
| 103 Hopemont Ln | 0.48mi | 3/2.0 | 1,541 (+8%) | 4mo | $319,000 | $207 | 61 |
| 303 Palmyra Dr | 0.49mi | 4/2.0 (+1) | 1,500 (+5%) | 6mo | $310,000 | $207 | 59 |
| 105 Dutchland Trl | 0.63mi | 3/2.5 | 1,480 (+4%) | 8mo | $349,999 | $236 | 56 |
| 520 Kemp Lndg | 0.65mi | 3/2.5 | 1,471 (+3%) | 8mo | $315,000 | $214 | 56 |
| 221 Waterwood Way | 0.31mi | 3/2.5 | 1,627 (+14%) | 7mo | $415,000 | $255 | 54 |
| 152 Ashford Dr | 0.57mi | 3/2.0 | 1,278 (-10%) | 3mo | $330,000 | $258 | 54 |
| 137 Kristen Ln | 0.67mi | 4/2.0 (+1) | 1,500 (+5%) | 3mo | $299,500 | $200 | 53 |
| 225 Abingdon Cir | 0.59mi | 3/2.0 | 1,554 (+9%) | 8mo | $345,000 | $222 | 51 |
| 236 Abingdon Cir | 0.63mi | 3/2.0 | 1,566 (+10%) | 7mo | $330,000 | $211 | 48 |
Match score weights: distance 35% · size 25% · config 20% · recency 20%. Top-matched comps best support the ARV.
Projected returns pro-forma
-3.0% appreciation · 5.84% rent growth · sell at horizon
- IRR
- -20.1%
- Equity multiple
- 0.28×
- Total profit
- $-62,164
- Equity at exit
- $46,222
- IRR
- -8.4%
- Equity multiple
- 0.42×
- Total profit
- $-50,542
- Equity at exit
- $26,803
Cash invested: $86,800 (down + closing). Projections, not guarantees.
Landlord ↔ Tenant lean methodology
- Overall (STATE)
- 55 Moderately Landlord-Leaning
- State Virginia
- 55 Moderately Landlord-Leaning · D+2
- County
- — inherits STATE
- City
- — inherits STATE
ZIP-level market 23434
- Rents YoY
- 5.8%
- Active inventory
- 546
- Price-to-rent
- 12.1×
Monthly cashflow live
- Estimated rent
- $2,130 high interval (Pro) →
- Mortgage (P&I)
- −$1,626
- Tax from tax record
- −$212 /mo · $2,542/yr
- Insurance
- −$129
- HOA
- −$0
- Vacancy / Maint / Mgmt
- −$447
- Net cashflow
- $-284
Break-even live
Sensitivity live
| Price | -10% $-109 | -5% $-197 | +0% $-284 | +5% $-372 | +10% $-460 |
|---|---|---|---|---|---|
| Rent | -10% $-453 | -5% $-369 | +0% $-284 | +5% $-200 | +10% $-116 |
| Rate | -1.0pp $-128 | -0.5pp $-206 | base $-284 | +0.5pp $-365 | +1.0pp $-446 |
UW: 25.0% down · 7.5% · 30yr · 1.5% tax · 5.0% vac · 8.0% maint · 8.0% mgmt
Financing live
Cash to close
- Down payment
- $77,500
- Closing costs
- $9,300
- Reserves months
- —
- Total cash needed
- —
Loan-product check · same deal, 3 products live
Conventional
25% down · 7.5% · 30yr
- Down + closing
- —
- Monthly P&I
- —
- Monthly cashflow
- —
- DSCR
- —
- Eligible?
- —
Personal DTI + credit; lowest rate.
DSCR
20% down · 8.5% · 30yr
- Down + closing
- —
- Monthly P&I
- —
- Monthly cashflow
- —
- DSCR
- —
- Eligible?
- —
No personal income docs; deal must DSCR.
Hard money
10% down · 12.0% · 12mo
- Down + closing
- —
- Monthly P&I
- —
- Monthly cashflow
- —
- DSCR
- —
- Eligible?
- —
Short-term bridge; refi at stabilization.
Rent comps 12 comps
| Address | Beds | Baths | Sqft | Rent | $/sqft | DOM | Units | Dist |
|---|---|---|---|---|---|---|---|---|
| 1231 Exchange Rd Suffolk, VA | 3.0 | 1.0 | 906 | $1,600 | $1.77 | 45d | 1 | 0.28mi |
| 1056 Centerbrooke Ln Suffolk, VA | 2.0 | 2.0 | 892 | $1,543 | $1.73 | 45d | 1 | 0.49mi |
| 1056 Centerbrooke Ln Suffolk, VA | 2.0 | 2.0 | 892 | $1,528 | $1.71 | 3d | 4 | 0.49mi |
| 220 Abingdon Cir Suffolk, VA | 3.0 | 2.5 | 1578 | $2,000 | $1.27 | 45d | 1 | 0.56mi |
| 1000 Meridian Obici Way Suffolk, VA | 1.0–2.0 | 1.0–2.0 | 889 | $2,024 | $2.28 | 3d | 10 | 0.59mi |
| 245 Wexford Dr W Suffolk, VA | 3.0 | 2.5 | 1500 | $2,285 | $1.52 | 45d | 1 | 0.83mi |
| 1000 Hallstead Blvd Suffolk, VA | 1.0–3.0 | 1.0–2.0 | 1041 | $2,499 | $2.40 | 3d | 1 | 0.85mi |
| 3061 Godwin Blvd Suffolk, VA | 3.0 | 1.0–2.0 | 1047 | $3,017 | $2.88 | 3d | 17 | 1.02mi |
| 128 Majestic Dr Suffolk, VA | 3.0 | 2.0 | 1680 | $2,150 | $1.28 | 18d | 1 | 1.03mi |
| 1007 Robinson Rd Suffolk, VA | 3.0 | 2.5 | 1584 | $3,400 | $2.15 | 9d | 1 | 1.04mi |
| 115 Squire Reach Suffolk, VA | 3.0 | 2.5 | 1140 | $2,100 | $1.84 | 45d | 1 | 1.11mi |
| 2005 Waterside Dr Suffolk, VA | 2.0–3.0 | 2.5 | 1657 | $3,068 | $1.85 | 3d | 1 | 1.32mi |
Listing history 23 events
-
2026-06-21days on market $310,000 Active 25 DOM
-
2026-06-18days on market $310,000 Active 22 DOM
-
2026-06-17days on market $310,000 Active 21 DOM
-
2026-06-16days on market $310,000 Active 20 DOM
-
2026-06-15days on market $310,000 Active 19 DOM
-
2026-06-13days on market $310,000 Active 17 DOM
-
2026-06-09days on market $310,000 Active 13 DOM
-
2026-06-08days on market $310,000 Active 12 DOM
-
2026-06-07days on market $310,000 Active 11 DOM
-
2026-06-03days on market $310,000 Active 7 DOM
-
2026-06-02days on market $310,000 Active 6 DOM
-
2026-06-01days on market $310,000 Active 5 DOM
-
2026-05-31days on market $310,000 Active 4 DOM
-
2026-05-27$310,000 Active
-
2023-06-30soldstatus $265,000
-
2023-05-16status Under Contract
-
2023-05-10historical Active Under Contract
-
2023-04-21$270,000 Active
-
2019-09-24historical
-
2019-08-26$189,000 Active
-
2019-07-29status Under Contract
-
2019-07-29historical
-
2019-04-26$180,000 Active
ⓘ Source: listings_history table (triggers on properties + properties_extension) + one-shot
backfill from property_details.listing_events for pre-trigger history.
Tax reassessment forecast VA · Resets to sale price
- Current annual tax
- $2,542 · $212/mo
- Projected year-2 tax
- $2,542 · $212/mo
- Expected delta
- $0/yr ($0/mo · 0.0%)
ⓘ Screening estimate from a state-policy table — verify with the county assessor before closing.
Climate risk First Street
- Flood 1/10 Low FEMA zone X (unshaded) · 0% chance over 30 yrs
- Wildfire 1/10 Low
- Heat 8/10 Severe 7 d/yr ≥107°F today · 16 d/yr by 30 yrs out
- Wind 8/10 Severe 80% chance of damaging wind over 30 yrs
- Air quality 2/10 Low 1 unhealthy d/yr today · 1 by 30 yrs out
Nearby sold comps map
Loading sold comps map…
Walkable amenities ~0.75 mi
Loading nearby amenities…
Taxation est. · year 1
- Rental income
- $25,554
- − Mortgage interest
- −$17,365
- − Property taxes
- −$2,542
- − Insurance
- −$1,550
- − Repairs & maintenance
- −$2,044
- − Management
- −$2,044
- − Depreciation
- −$9,018
- Taxable loss
- −$9,010
- Est. tax savings @ 24.0%
- +$2,162
- After-tax cash flow
- $-1,250/yr
For passive investors: Depreciation is non-cash, so a rental often shows a tax loss while cash-flowing — sheltering income. Rental losses are passive: they offset passive income freely, and up to $25,000/yr can offset ordinary (W-2) income if you actively participate and your MAGI is under $100k (phasing out to $0 by $150k); unused losses carry forward. On sale, claimed depreciation is recaptured at up to 25%, and gains may owe capital-gains tax (a 1031 exchange can defer both). Figures are a year-1 estimate at your 24.0% rate — not tax advice; consult a CPA.
Schools (NCES district)
- District
- Suffolk City Public School District
- NCES district ID
- 5103710
- Math proficiency
- 41% ▼ -43.00%
- Reading proficiency
- 69% ▼ -8.00%
- Median HH income
- $65,573
- Composite
- 48.31/100
- National rank
- #2151
- State rank
- #72 of 131 in VA
Livability — Suffolk
- Score
- 77/100
- State rank
- #88
- US rank
- #2896
Category grades
Schools grade is shown separately in the Schools card above.
Census & demographics
- Census place
- Suffolk, VA
- County
- Suffolk City · 88,108 people
- City population
- 88,108
- Metro
- Virginia Beach-Norfolk-Newport News, VA-NC
- Population (ZIP)
- 54,387
- Household income
- $79,877
- Rent vs Own
- Severe rent burden
- 1934.0
Population outlook (Suffolk County) Hauer SSP2
- Today (2025)
- 95,269 people
- By 2030
- 98,269 · +3.1%
- By 2040
- 103,177 · +8.3%
- By 2050
- 105,777 · +11.0%
- By 2075
- 110,963 · +16.5%
- By 2100
- 103,711 · +8.9%
Race, ethnicity, and origin ACS 2023
- Neighborhood character
- Diverse neighborhood (Simpson 0.58)
- Race & ethnicity
- Black 49% White 41% Two or more races 5% Hispanic / Latino 4% Asian 1%
- Common ancestry
- Lithuanian 1% Slovak 1% Italian 1%
- Foreign-born
- 3% · Canada
- Languages at home
- 96% English-only · Spanish 2%
Political lean MEDSL · Suffolk
- 2024 margin
- D (+15.9) · D 57.4% · R 41.5% · Other 1.2%
- 2008→2024 swing
- +2.7pp toward D · 2008: 13.2pp · 2024: 15.9pp
- All cycles
- 2024: D+15.9 2020: D+17.3 2016: D+13.8 2012: D+15.1 2008: D+13.2
Not yet ingested
- Civics
- —
Market trends
- HPI YoY
- ▼ -383.80%
- Current HPI
- 158.5866
- Rent YoY
- ▲ 5.84%
- Metro
- Virginia Beach-Norfolk-Newport News, VA-NC
- State GDP YoY
- ▲ 2.40%
- F500 in state
- 50
Industry mix (Fortune 500 HQ in VA)
| Industry | F500 HQs | Revenue |
|---|---|---|
| Aerospace / Defense | 4 | $236B |
|
||
| Technology / Defense | 3 | $32B |
|
||
| Financial Services | 2 | $176B |
|
||
| Utilities | 2 | $27B |
|
||
| Insurance | 2 | $25B |
|
||
| Technology | 2 | $15B |
|
||
Price history
+72.2% since first listed10 events — show timeline
- 2026-05-27 Listed $310,000 REINMLS
- 2023-06-30 Sold (Public Records) $265,000 Public Records
- 2023-05-16 Pending — REINMLS
- 2023-05-10 Contingent — REINMLS
- 2023-04-21 Listed $270,000 REINMLS
- 2019-09-24 Listing Removed — REINMLS
- 2019-08-26 Listed $189,000 REINMLS
- 2019-07-29 Pending — REINMLS
- 2019-07-29 Listing Removed — REINMLS
- 2019-04-26 Listed $180,000 REINMLS
Property tax history
+4.8%/yrLatest (2025): $2,542 · +5.0% YoY. Source: county tax records.
Cash-flow waterfall
monthlySold comps — $/sqft
last 12 mo · ≤1 miLoading sold comps…