42213 Blue Bay Dr · Hammond, LA
Flood risk 1/10 · Minimal
- FEMA flood zone
- X (unshaded)
- Chance of flooding over 30 yrs
- 0.0%
- Est. flood insurance / yr
- $507 – $1,088
Fire risk 4/10 · Minor
- Est. fire insurance / yr
- $1,269 – $2,357
Heat risk 9/10 · Severe
- Hot days now (above 109°F)
- 7 days/yr
- Hot days in 30 yrs
- 19 days/yr
Wind risk 9/10 · Severe
- Chance of severe wind over 30 yrs
- 99.0%
Air-quality risk 2/10 · Minimal
- Unhealthy air days now
- 0 days/yr
- Unhealthy air days in 30 yrs
- 1 days/yr
Risk factors via First Street. Map © Google.
Why this score? — see what drove the D grade
The composite is a weighted blend of 9 inputs, each scored 0–100. Each bar is that input's sub-score; the figure is the points it added to the 100-point composite (weight × sub-score).
- Cash flow +11.6/30.0
- ARV discount +10.5/15.0
- Condition / age +4.0/5.0
- 1% rule +3.5/10.0
- Livability +3.5/5.0
- DSCR +3.4/10.0
- Rent growth +2.7/5.0
- Schools +2.0/10.0
- Appreciation +0.0/10.0
$269,115
🖨 Deal sheet 📄 Offer letter ✓ Due diligence
Listing remarks MLS
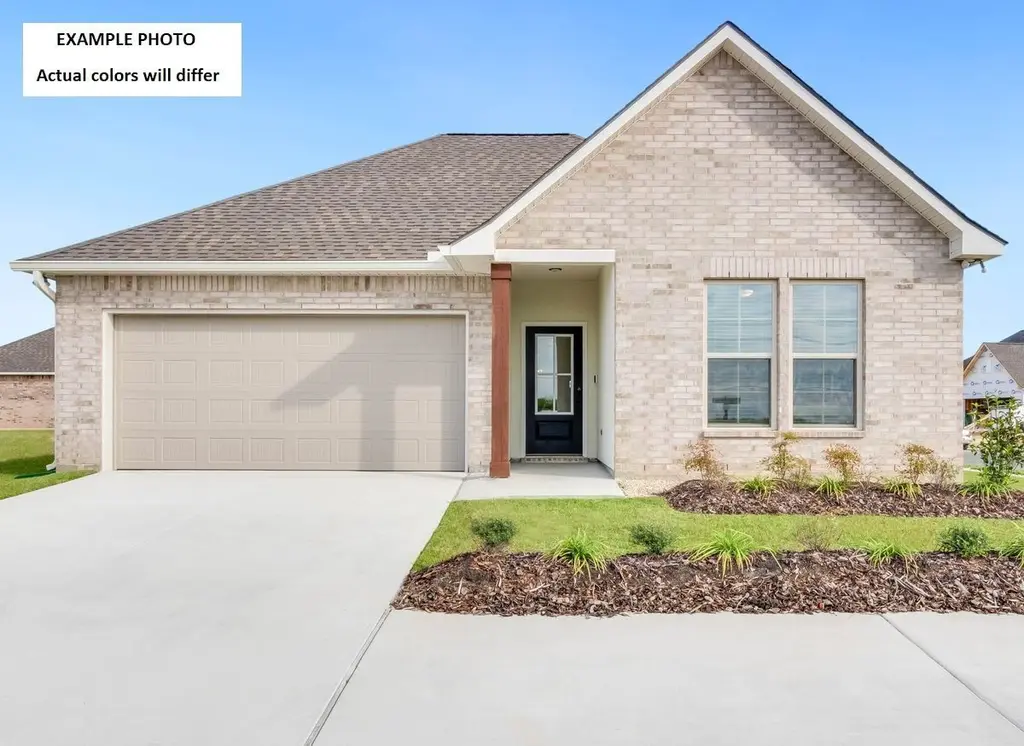
* 2/1 buydown with rate as low as 3.99% for the first 12 months. Contact Builder Sales Rep(s) for current incentive details. * BACKS TO POND! The YARDLEY III A has an open floor plan with 4 bedrooms & 2.5 bathrooms. This home includes upgraded cabinets, quartz counters, stainless appliances with a gas range, undermount cabinet lighting, culinary brushed gold kitchen faucet & more. Special features: kitchen island, under-mount sinks throughout, luxury vinyl plank flooring added in living room & all wet areas, custom framed mirrors in all bathrooms, large walk-in closet, garden tub & separate shower in primary suite, smart connect Wi-Fi thermostat, gas tank-less water heater, radiant barrier roof decking, low E tilt-in windows, fully sodded yard with seasonal landscaping & so much more!
Key facts
- Backs to pond
- Under-mount sinks
- Kitchen island
Tags
Neighborhood map
What this means for you Summary
Snapshot
- This is a 4-bed/2.5-bath single-family listed at $269k. Condition is rated good.
Deal economics
- At list price, monthly cash flow is $-83 ($-1k/yr) — negative.
- To cash-flow at today's rent, offer at most $257k (4.5% below list).
- To meet the 1% rule (rent ≥ 1% of price), the offer needs to be $228k (15.5% below list).
- Recommended offer: $228k (15.5% below list) — sets the bar for 1% rule.
Location & tenants
- Location reads 69/100 on livability (#77 in LA) — a middle-class / working-renter tenant base. Strengths: cost of living A+, health & safety A+; Watch: amenities C-, commute D+, schools D.
- Tangipahoa Parish (rural): math 18% / reading 29% proficiency, ranked #63 of 98 in LA (top 64%) — low school quality limits family demand, transient renter base, plan for 1-2y turnover; 73% free/reduced lunch — lower-income household profile, screen leases tightly.
- Market conditions: Rents flat; 526 active listings in the ZIP; 3 comparable units currently listed for rent nearby; rentals lingering (median 44d on market — plan ~5-8 weeks vacancy on turnover, expect pricing pressure); 100% of comp listings sitting > 30 days — soft ceiling on asking rent; 1,085 units permitted in Tangipahoa Parish in 2024 (378 in 5+ unit buildings).
- This rent runs 38% of the median local income ($72k/yr) — at the standard rent-burdened threshold; future hikes will face affordability resistance.
Forward outlook
- Local home prices are declining (-3.0%/yr); year-one equity from $2k of loan paydown is wiped out by about $8k of value loss. Plan a longer hold.
- Tangipahoa County population projected at +22% by 2050 — long-run rental-demand tailwind backs the buy-and-hold thesis.
Negotiation context
- It's been on market 64 days — a 6% lower offer ($253k) is reasonable based on typical stale-listing flexibility.
- 3 sale attempts with the ask held roughly flat each time — persistent listings suggest the price (not the market) is what's stuck; bring a comps-based counter.
Risks & watch-outs
- Climate carrying-cost: severe wind risk, 99% chance of damaging wind over 30y; extreme-heat days projected 7→19/yr by 2055 (HVAC capex compounding) — expect insurance premiums to compound above CPI over the hold.
Questions for the listing agent
- What do current leases actually rent for vs. the listed asking? Can we see a recent rent roll and the last 12 months of T-12 income?
- It's been on market 64 days. Have you received any prior offers? Is the seller open to a 15% concession, seller financing, or rate buy-down credit?
- What does the HOA fee cover, when was the last increase, and are there any pending special assessments or reserve-fund shortfalls?
- Why hasn't it sold? Are there any deal-killer items the seller is aware of (foundation, flood, title, zoning, code violations)?
- Is there a deadline driving the sale (1031 exchange, divorce, estate, relocation)? That informs how much negotiation room exists.
- Schools are D-rated, which usually means shorter tenancies and higher turnover. Who's the typical renter profile here, and what's been the actual vacancy rate?
- Crime grade is F in this area — have there been break-ins, vandalism, or insurance claims at this property in the last 3 years? What carrier currently insures it and at what premium?
- The area grade is low — what's the realistic commute time and amenity access for the typical tenant pool here? Any planned neighborhood developments (good or bad) we should know about?
- What's the average days-on-market for RENTAL listings here right now (not sales)? A rising rental-DOM trend means longer vacancies and softer asking-rent achievability than the comps imply.
- What's the recent tenant-quality profile in this submarket — average credit score on applications, eviction rate, late-payment / NSF rate, and stable-employment percentage? A property-management company in the area should have these aggregated.
- How much new for-sale + rental construction is in the pipeline within 1–3 miles? Heavy new supply typically softens prices + rents 12–24 months out; constrained supply supports both.
Investment metrics
- 1% rule
- 0.85% ✗
- Cap rate
- 5.92%
- Cash-on-cash
- -1.33%
- DSCR
- 0.94
- GRM
- 9.9
CMA / ARV
- ARV (median comp)
- $288,523
- List price
- $269,115
- Delta
- -6.73%
- Verdict
- FAIR
- Comps
- 20 within 1.0 mi
Show comp detail 12 sales within ~0.75 mi
| Address | Dist | Beds/Ba | Sqft | Sold | Price | $/sf | Match |
|---|---|---|---|---|---|---|---|
| 26092 Salt Grass Dr | 0.12mi | 4/2.5 | 1,833 (0%) | 1mo | $269,235 | $147 | 94 |
| 42143 Blue Bay Dr | 0.03mi | 3/2.0 (-1) | 1,887 (+3%) | 1mo | $274,800 | $146 | 86 |
| 42521 Blue Bay Dr | 0.08mi | 3/2.0 (-1) | 1,887 (+3%) | 2mo | $271,015 | $144 | 83 |
| 42242 Blue Bay Dr | 0.03mi | 3/2.0 (-1) | 1,887 (+3%) | 9mo | $270,150 | $143 | 80 |
| 42318 Blue Bay Dr | 0.19mi | 3/2.0 (-1) | 1,887 (+3%) | 1mo | $271,354 | $144 | 79 |
| 42362 Blue Bay Dr | 0.19mi | 3/2.0 (-1) | 1,887 (+3%) | 8mo | $270,150 | $143 | 73 |
| 42416 Blue Bay Dr | 0.07mi | 4/3.0 | 2,072 (+13%) | 3mo | $279,980 | $135 | 70 |
| 42282 Blue Bay Dr | 0.10mi | 4/3.0 | 2,072 (+13%) | 3mo | $283,715 | $137 | 69 |
| 42114 Dothan Pl | 0.68mi | 4/2.0 | 1,820 (-1%) | 1mo | $260,000 | $143 | 64 |
| 42308 Blue Bay Dr | 0.16mi | 4/3.0 | 2,072 (+13%) | 9mo | $286,445 | $138 | 62 |
| 42159 Delacer Ln | 0.51mi | 3/2.0 (-1) | 1,685 (-8%) | 7mo | $264,000 | $157 | 50 |
| 42195 Millbrook Way | 0.56mi | 3/2.0 (-1) | 1,593 (-13%) | 0mo | $234,400 | $147 | 45 |
Match score weights: distance 35% · size 25% · config 20% · recency 20%. Top-matched comps best support the ARV.
Projected returns pro-forma
-3.0% appreciation · 0.66% rent growth · sell at horizon
- IRR
- -21.2%
- Equity multiple
- 0.28×
- Total profit
- $-54,108
- Equity at exit
- $40,126
- IRR
- -21.3%
- Equity multiple
- 0.01×
- Total profit
- $-74,261
- Equity at exit
- $23,268
Cash invested: $75,352 (down + closing). Projections, not guarantees.
Landlord ↔ Tenant lean methodology
- Overall (STATE)
- 90 Strongly Landlord-Friendly
- State Louisiana
- 90 Strongly Landlord-Friendly · R+12
- County
- — inherits STATE
- City
- — inherits STATE
ZIP-level market 70454
- Rents YoY
- 0.7%
- Active inventory
- 526
- Price-to-rent
- 9.9×
Monthly cashflow live
- Estimated rent
- $2,275 medium interval (Pro) →
- Mortgage (P&I)
- −$1,411
- Tax est. 1.5%
- −$336 /mo · $4,037/yr
- Insurance
- −$112
- HOA
- −$21
- Vacancy / Maint / Mgmt
- −$478
- Net cashflow
- $-83
Break-even live
UW: 25.0% down · 7.5% · 30yr · 1.5% tax · 5.0% vac · 8.0% maint · 8.0% mgmt
Financing live
Cash to close
- Down payment
- $67,279
- Closing costs
- $8,073
- Reserves months
- —
- Total cash needed
- —
Loan-product check · same deal, 3 products live
Conventional
25% down · 7.5% · 30yr
- Down + closing
- —
- Monthly P&I
- —
- Monthly cashflow
- —
- DSCR
- —
- Eligible?
- —
Personal DTI + credit; lowest rate.
DSCR
20% down · 8.5% · 30yr
- Down + closing
- —
- Monthly P&I
- —
- Monthly cashflow
- —
- DSCR
- —
- Eligible?
- —
No personal income docs; deal must DSCR.
Hard money
10% down · 12.0% · 12mo
- Down + closing
- —
- Monthly P&I
- —
- Monthly cashflow
- —
- DSCR
- —
- Eligible?
- —
Short-term bridge; refi at stabilization.
Rent comps 3 comps
| Address | Beds | Baths | Sqft | Rent | $/sqft | DOM | Units | Dist |
|---|---|---|---|---|---|---|---|---|
| 42290 Blue Bay Dr Ponchatoula, LA | 4.0 | 2.0 | 1858 | $2,150 | $1.16 | 43d | 1 | 0.11mi |
| 26122 Trinity Ln Ponchatoula, LA | 4.0 | 3.0 | 2175 | $2,500 | $1.15 | 43d | 1 | 0.22mi |
| 42293 Atmore Pl Ponchatoula, LA | 4.0 | 2.0 | 1820 | $2,150 | $1.18 | 43d | 1 | 0.89mi |
HOA detail
- Monthly dues
- $21 · $252/yr
- Likely covers
- watergasinternetlandscaping
Listing history 20 events
-
2026-06-19days on market $269,115 Active 64 DOM
-
2026-06-18days on market $269,115 Active 63 DOM
-
2026-06-17days on market $269,115 Active 62 DOM
-
2026-06-16days on market $269,115 Active 61 DOM
-
2026-06-15days on market $269,115 Active 60 DOM
-
2026-06-14days on market $269,115 Active 58 DOM
-
2026-06-13days on market $269,115 Active 57 DOM
-
2026-06-10days on market $269,115 Active 55 DOM
-
2026-06-09days on market $269,115 Active 54 DOM
-
2026-06-08days on market $269,115 Active 53 DOM
-
2026-06-07days on market $269,115 Active 52 DOM
-
2026-06-05days on market $269,115 Active 49 DOM
-
2026-06-03days on market $269,115 Active 48 DOM
-
2026-06-02days on market $269,115 Active 47 DOM
-
2026-06-01days on market $269,115 Active 46 DOM
-
2026-05-31days on market $269,115 Active 45 DOM
-
2026-05-30days on market $269,115 Active 44 DOM
-
2026-04-17$269,115 Active 827-char remark
Show marketing remark (827 chars)
* 2/1 buydown with rate as low as 3.99% for the first 12 months. Contact Builder Sales Rep(s) for current incentive details. * BACKS TO POND! The YARDLEY III A has an open floor plan with 4 bedrooms & 2.5 bathrooms. This home includes upgraded cabinets, quartz counters, stainless appliances with a gas range, undermount cabinet lighting, culinary brushed gold kitchen faucet & more. Special features: kitchen island, under-mount sinks throughout, luxury vinyl plank flooring added in living room & all wet areas, custom framed mirrors in all bathrooms, large walk-in closet, garden tub & separate shower in primary suite, smart connect Wi-Fi thermostat, gas tank-less water heater, radiant barrier roof decking, low E tilt-in windows, fully sodded yard with seasonal landscaping & so much more!
-
2026-04-16$269,115 Active 852-char remark
Show marketing remark (852 chars)
Awesome builder rate + FREE front gutters OR window blinds(restrictions apply)! BACKS TO POND! Brand NEW Construction built by DSLD HOMES in The Estates at Silver Hill! The YARDLEY III A has an open floor plan with 4 bedrooms & 2.5 bathrooms. This home includes upgraded cabinets, quartz counters, stainless appliances with a gas range, undermount cabinet lighting, culinary brushed gold kitchen faucet & more. Special features: kitchen island, under-mount sinks throughout, luxury vinyl plank flooring added in living room & all wet areas, custom framed mirrors in all bathrooms, large walk-in closet, garden tub & separate shower in primary suite, smart connect Wi-Fi thermostat, gas tank-less water heater, radiant barrier roof decking, low E tilt-in windows, fully sodded yard with seasonal landscaping & so much more!
ⓘ Source: listings_history table (triggers on properties + properties_extension) + one-shot
backfill from property_details.listing_events for pre-trigger history.
Climate risk First Street
- Flood 1/10 Low FEMA zone X (unshaded) · 0% chance over 30 yrs
- Wildfire 4/10 Moderate
- Heat 9/10 Extreme 7 d/yr ≥109°F today · 19 d/yr by 30 yrs out
- Wind 9/10 Extreme 99% chance of damaging wind over 30 yrs
- Air quality 2/10 Low 0 unhealthy d/yr today · 1 by 30 yrs out
Nearby sold comps map
Loading sold comps map…
Walkable amenities ~0.75 mi
Loading nearby amenities…
Taxation est. · year 1
- Rental income
- $27,302
- − Mortgage interest
- −$15,075
- − Property taxes
- −$4,037
- − Insurance
- −$1,346
- − Repairs & maintenance
- −$2,184
- − Management
- −$2,184
- − HOA
- −$252
- − Depreciation
- −$7,829
- Taxable loss
- −$5,604
- Est. tax savings @ 24.0%
- +$1,345
- After-tax cash flow
- $344/yr
For passive investors: Depreciation is non-cash, so a rental often shows a tax loss while cash-flowing — sheltering income. Rental losses are passive: they offset passive income freely, and up to $25,000/yr can offset ordinary (W-2) income if you actively participate and your MAGI is under $100k (phasing out to $0 by $150k); unused losses carry forward. On sale, claimed depreciation is recaptured at up to 25%, and gains may owe capital-gains tax (a 1031 exchange can defer both). Figures are a year-1 estimate at your 24.0% rate — not tax advice; consult a CPA.
Condition & rehab AI · 2 photos
This home is a brand-new construction with excellent condition and features. It is move-in ready with minimal maintenance required.
Value-add opportunities
- Both Painting exterior and interior walls — Enhances curb appeal and interior aesthetics
- Both Landscaping improvements — Enhances curb appeal and adds value
- Resale New flooring in bedrooms — Improves living space and adds value
- Resale New kitchen appliances — Enhances functionality and appeal
Renovation cost estimate screening
Value-add ROI direction
- Both Painting exterior and interior walls — Enhances curb appeal and interior aesthetics ↑
- Both Landscaping improvements — Enhances curb appeal and adds value ↑
- Resale New flooring in bedrooms — Improves living space and adds value ↑
- Resale New kitchen appliances — Enhances functionality and appeal ↑
ⓘ Cost ranges are severity-bucket heuristics (US national rule-of-thumb). Get contractor quotes + a written scope before underwriting a rehab budget.
Schools (NCES district)
- District
- Tangipahoa Parish
- NCES district ID
- 2201680
- Math proficiency
- 18% ▼ -32.00%
- Reading proficiency
- 29% ▼ -31.00%
- Median HH income
- $41,283
- Composite
- 19.94/100
- National rank
- #8676
- State rank
- #63 of 98 in LA
Livability — Hammond
- Score
- 69/100
- State rank
- #77
- US rank
- #8868
Category grades
Schools grade is shown separately in the Schools card above.
Census & demographics
- County
- Tangipahoa Parish · 85,958 people
- City population
- 51,394
- Metro
- Hammond, LA
- Population (ZIP)
- 34,564
- Household income
- $71,611
- Rent vs Own
- Severe rent burden
- 479.0
Population outlook (Tangipahoa County) Hauer SSP2
- Today (2025)
- 144,204 people
- By 2030
- 151,413 · +5.0%
- By 2040
- 164,374 · +14.0%
- By 2050
- 175,427 · +21.7%
- By 2075
- 195,165 · +35.3%
- By 2100
- 201,641 · +39.8%
Race, ethnicity, and origin ACS 2023
- Neighborhood character
- Predominantly White (73%)
- Race & ethnicity
- White 73% Black 16% Two or more races 8% Hispanic / Latino 8%
- Hispanic origin (detail)
- Mexican 2%
- Common ancestry
- Lithuanian 15% Slovak 1% Portuguese 1%
- Foreign-born
- 3% · Canada
- Languages at home
- 94% English-only · Spanish 5%
Political lean MEDSL · Tangipahoa
- 2024 margin
- Solid R (+37.4) · D 30.6% · R 68.0% · Other 1.3%
- 2008→2024 swing
- -6.5pp toward R · 2008: -30.9pp · 2024: -37.4pp
- All cycles
- 2024: R+37.4 2020: R+32.8 2016: R+32.6 2012: R+27.7 2008: R+30.9
Not yet ingested
- Civics
- —
Market trends
- HPI YoY
- ▼ -83.55%
- Current HPI
- 129.6069
- Rent YoY
- ▲ 0.66%
- Metro
- Hammond, LA
- State GDP YoY
- ▲ 3.29%
- F500 in state
- 10
Industry mix (Fortune 500 HQ in LA)
| Industry | F500 HQs | Revenue |
|---|---|---|
| Telecommunications | 2 | $23B |
|
||
| Utilities | 1 | $12B |
|
||
| Wholesale / Distribution | 1 | $5B |
|
||
| Advertising | 1 | $2B |
|
||
Price history
+0.0% since first listed3 events — show timeline
- 2026-04-17 Listed $269,115 Zillow
- 2026-04-16 Listed $269,115 AcadianaMLS
- 2026-04-16 Listed $269,115 GSREIN
Cash-flow waterfall
monthlySold comps — $/sqft
last 12 mo · ≤1 miLoading sold comps…