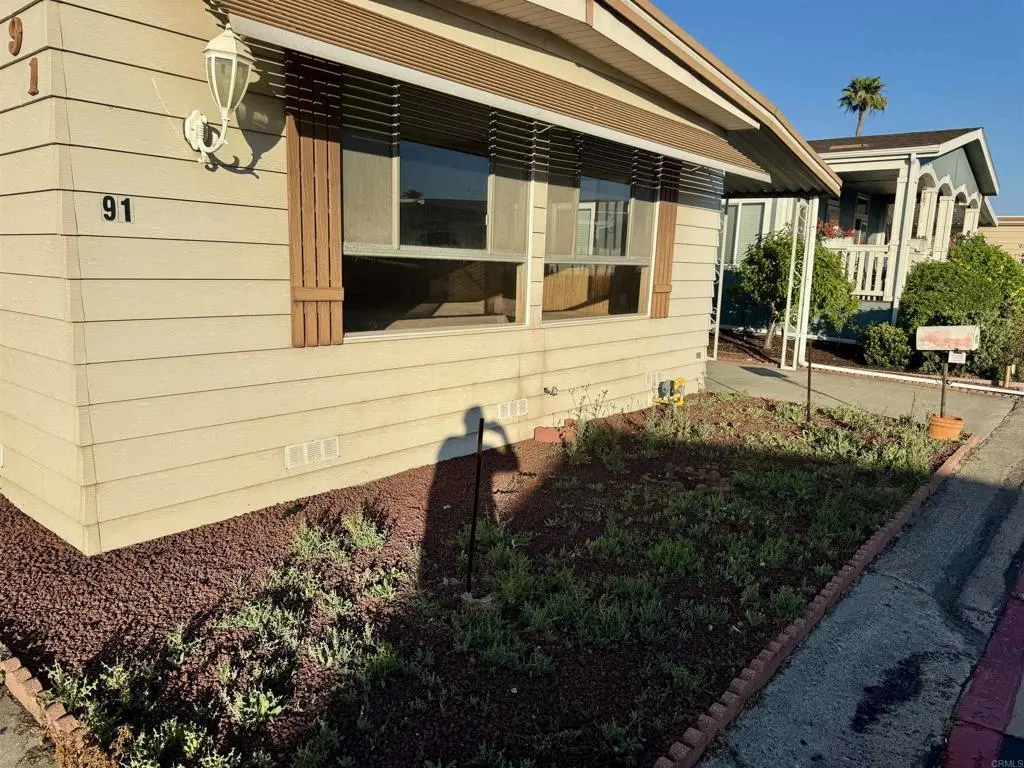
1401 El Norte Pkwy Spc 91 · San Marcos, CA
Flood risk 4/10 · Minor
- FEMA flood zone
- X (unshaded)
- Chance of flooding over 30 yrs
- 0.22%
- Est. flood insurance / yr
- $507 – $1,088
Fire risk 6/10 · Moderate
- Est. fire insurance / yr
- $659 – $1,223
Heat risk 5/10 · Moderate
- Hot days now (above 97°F)
- 7 days/yr
- Hot days in 30 yrs
- 21 days/yr
Wind risk 1/10 · Minimal
- Chance of severe wind over 30 yrs
- —
Air-quality risk 3/10 · Minor
- Unhealthy air days now
- 4 days/yr
- Unhealthy air days in 30 yrs
- 4 days/yr
Risk factors via First Street. Map © Google.
Why this score? — see what drove the B- grade
The composite is a weighted blend of 9 inputs, each scored 0–100. Each bar is that input's sub-score; the figure is the points it added to the 100-point composite (weight × sub-score).
- Cash flow +22.7/30.0
- ARV discount +15.0/15.0
- DSCR +7.3/10.0
- 1% rule +6.3/10.0
- Schools +5.4/10.0
- Livability +3.9/5.0
- Rent growth +2.6/5.0
- Condition / age +2.5/5.0
- Appreciation +0.0/10.0
$300,000
🖨 Deal sheet 📄 Offer letter ✓ Due diligence
Listing remarks MLS
Looking for a mobile home to upgrade using your own specifications and with building materials to suit your fancy? With this home, comes great bones and a blank canvas for a great start to creating your own comfortable way of living. You will enjoy this country club type community setting and all the amenities that come with it. HOA fee only $185.00 a month. This home to be sold in its present condition and at asking price.
Key facts
- Low hoa fees
- Pool and spa
- Land-owned community
Tags
Property features AI
Finance
- Other: Zoned R-1 (single family residential); Directions: W El Norte Parkway into the complex, between Woodland Parkway and Bennett Avenue
- HOA & community: Part of an association (Madrid Mnor); Monthly association fee of $177 plus a secondary monthly fee of $39; Community amenities: pool, spa, clubhouse, meeting room, billiard room, gym/exercise room, tennis, pickleball, recreational/multipurpose room; Pets permitted (subject to association rules); Senior community; Approximately 330 units in the community
Exterior
- Parking: Two parking spaces; Two carport spaces
- Utilities: Public sewer
- Home design: Single-story property; No shared/common walls
- Construction: Year built per assessor
- Exterior features: Rectangular lot shape; Community in-ground pool; Community spa; Has a view; Suburban setting
Interior
- Bedrooms: Primary bedroom on the main floor; Additional main floor bedroom
- Bathrooms: Two full bathrooms (both on the main level)
- Interior features: Single-level home with front entry; Main-level primary bedroom; Main-level bedrooms and bathrooms
- Laundry & utility: Laundry inside; Washer hookup; Gas dryer hookup
Neighborhood map
What this means for you Summary
Snapshot
- This is a 2-bed/2.0-bath manufactured listed at $300k.
Deal economics
- At list price, monthly cash flow is $518 ($6k/yr) — positive.
- The deal already cash-flows at list — no discount required.
- Meets the 1% rule at list price ($3k rent vs $300k).
- Recommended offer: $291k (3.0% below list) — sets the bar for market timing.
- Cap rate 8.4% vs local median 2.5% in San Marcos — top-decile yield for the area; either an underpriced asset or a hidden risk that comps aren't pricing in. Stress-test before assuming the spread holds.
Location & tenants
- Location reads 77/100 on livability (#80 in CA, #3,074 nationally) — a middle-class / working-renter tenant base. Strengths: amenities A+, commute A+, employment A+; Watch: health & safety D+, cost of living F.
- San Marcos Unified (suburban): math 52% / reading 67% proficiency, ranked #249 of 1,400 in CA (top 18%) — acceptable for families but not a draw, mixed tenant base, ~2y average lease.
- Market conditions: Rents flat; 115 active listings in the ZIP; 8 comparable units currently listed for rent nearby; rentals leasing fast (median 5d on market — plan ~1-2 weeks tenant-placement turnaround); solid renter incomes; 11,759 units permitted in San Diego County in 2024 (7,244 in 5+ unit buildings).
- This rent runs 42% of the median local income ($97k/yr) — at the standard rent-burdened threshold; future hikes will face affordability resistance.
Forward outlook
- Local home prices are declining (-3.0%/yr); year-one equity from $2k of loan paydown is wiped out by about $9k of value loss. Plan a longer hold.
- San Diego County population projected at +20% by 2050 — long-run rental-demand tailwind backs the buy-and-hold thesis.
Negotiation context
- It's been on market 51 days — a 3% lower offer ($291k) is reasonable based on typical stale-listing flexibility.
- 5 sale attempts since 2y ago with the ask held roughly flat each time — persistent listings suggest the price (not the market) is what's stuck; bring a comps-based counter.
Risks & watch-outs
- Climate carrying-cost: major wildfire risk; extreme-heat days projected 7→21/yr by 2055 (HVAC capex compounding) — expect insurance premiums to compound above CPI over the hold.
Questions for the listing agent
- It's been on market 51 days. Have you received any prior offers? Is the seller open to a 3% concession, seller financing, or rate buy-down credit?
- Built in 1971 — when were the roof, HVAC, electrical panel, plumbing, and water heater last replaced?
- What does the HOA fee cover, when was the last increase, and are there any pending special assessments or reserve-fund shortfalls?
- Is there a deadline driving the sale (1031 exchange, divorce, estate, relocation)? That informs how much negotiation room exists.
- What's the average days-on-market for RENTAL listings here right now (not sales)? A rising rental-DOM trend means longer vacancies and softer asking-rent achievability than the comps imply.
- What's the recent tenant-quality profile in this submarket — average credit score on applications, eviction rate, late-payment / NSF rate, and stable-employment percentage? A property-management company in the area should have these aggregated.
- How much new for-sale + rental construction is in the pipeline within 1–3 miles? Heavy new supply typically softens prices + rents 12–24 months out; constrained supply supports both.
Investment metrics
- 1% rule
- 1.13% ✓
- Cap rate
- 8.37%
- Cash-on-cash
- 7.40%
- DSCR
- 1.33
- GRM
- 7.4
CMA / ARV
- ARV (median comp)
- $441,420
- List price
- $300,000
- Delta
- -32.04%
- Verdict
- UNDERPRICED
- Comps
- 19 within 1.0 mi
Show comp detail 12 sales within ~0.75 mi
| Address | Dist | Beds/Ba | Sqft | Sold | Price | $/sf | Match |
|---|---|---|---|---|---|---|---|
| 1401 El Norte Pkwy Spc 60 | 0.00mi | 2/2.0 | 1,560 (+1%) | 4mo | $441,420 | $283 | 95 |
| 1401 El Norte Pkwy #42 | 0.00mi | 3/2.0 (+1) | 1,580 (+2%) | 8mo | $445,000 | $282 | 84 |
| 1401 El Norte Pkwy Spc 237 | 0.00mi | 2/2.0 | 1,647 (+7%) | 8mo | $470,000 | $285 | 82 |
| 1401 El Norte Pkwy #57 | 0.00mi | 2/2.0 | 1,368 (-11%) | 2mo | $287,000 | $210 | 79 |
| 1401 EL Norte Pkwy #323 | 0.00mi | 2/2.0 | 1,440 (-7%) | 12mo | $350,000 | $243 | 78 |
| 1401 El Norte Pkwy #9 | 0.00mi | 2/2.0 | 1,368 (-11%) | 9mo | $345,000 | $252 | 73 |
| 1401 El Norte Pkwy #230 | 0.00mi | 3/2.0 (+1) | 1,440 (-7%) | 13mo | $480,000 | $333 | 73 |
| 1723 Kiwi Gln | 0.48mi | 2/2.0 | 1,440 (-7%) | 3mo | $460,000 | $319 | 64 |
| 971 Borden Rd #2 | 0.59mi | 2/2.0 | 1,440 (-7%) | 3mo | $260,000 | $181 | 59 |
| 1609 Desert Gln | 0.56mi | 2/2.0 | 1,440 (-7%) | 7mo | $495,000 | $344 | 57 |
| 971 Borden Rd #122 | 0.59mi | 3/2.0 (+1) | 1,401 (-9%) | 3mo | $375,000 | $268 | 49 |
| 1627 Toyon | 0.59mi | 2/2.0 | 1,344 (-13%) | 9mo | $450,000 | $335 | 44 |
Match score weights: distance 35% · size 25% · config 20% · recency 20%. Top-matched comps best support the ARV.
Projected returns pro-forma
-3.0% appreciation · 0.55% rent growth · sell at horizon
- IRR
- -7.8%
- Equity multiple
- 0.72×
- Total profit
- $-23,662
- Equity at exit
- $44,731
- IRR
- -1.9%
- Equity multiple
- 0.89×
- Total profit
- $-9,548
- Equity at exit
- $25,939
Cash invested: $84,000 (down + closing). Projections, not guarantees.
Landlord ↔ Tenant lean methodology
- Overall (STATE)
- 18 Strongly Tenant-Friendly
- State California
- 18 Strongly Tenant-Friendly · D+13
- County
- — inherits STATE
- City
- — inherits STATE
ZIP-level market 92069
- Rents YoY
- 0.6%
- Active inventory
- 115
- Price-to-rent
- 7.4×
Monthly cashflow live
- Estimated rent
- $3,389 high interval (Pro) →
- Mortgage (P&I)
- −$1,573
- Tax from tax record
- −$245 /mo · $2,941/yr
- Insurance
- −$125
- HOA
- −$216
- Vacancy / Maint / Mgmt
- −$712
- Net cashflow
- $518
Break-even live
UW: 25.0% down · 7.5% · 30yr · 1.5% tax · 5.0% vac · 8.0% maint · 8.0% mgmt
Financing live
Cash to close
- Down payment
- $75,000
- Closing costs
- $9,000
- Reserves months
- —
- Total cash needed
- —
Loan-product check · same deal, 3 products live
Conventional
25% down · 7.5% · 30yr
- Down + closing
- —
- Monthly P&I
- —
- Monthly cashflow
- —
- DSCR
- —
- Eligible?
- —
Personal DTI + credit; lowest rate.
DSCR
20% down · 8.5% · 30yr
- Down + closing
- —
- Monthly P&I
- —
- Monthly cashflow
- —
- DSCR
- —
- Eligible?
- —
No personal income docs; deal must DSCR.
Hard money
10% down · 12.0% · 12mo
- Down + closing
- —
- Monthly P&I
- —
- Monthly cashflow
- —
- DSCR
- —
- Eligible?
- —
Short-term bridge; refi at stabilization.
Rent comps 8 comps
| Address | Beds | Baths | Sqft | Rent | $/sqft | DOM | Units | Dist |
|---|---|---|---|---|---|---|---|---|
| 1920 Edith Dr Escondido, CA | 2.0 | 2.0 | 1330 | $3,699 | $2.78 | 1d | 1 | 0.42mi |
| 1918 Firestone Dr Escondido, CA | 3.0 | 2.0 | 2047 | $4,595 | $2.24 | 1d | 1 | 0.53mi |
| 909 Richland Rd San Marcos, CA | 2.0 | 2.0 | 1688 | $3,300 | $1.95 | 5d | 1 | 0.74mi |
| 909 Richland Rd #142 San Marcos, CA | 2.0 | 2.0 | 1688 | $3,500 | $2.07 | 24d | 1 | 0.74mi |
| 909 Richland Rd #89 San Marcos, CA | 2.0 | 2.0 | 1440 | $2,800 | $1.94 | 43d | 1 | 0.74mi |
| 786 Fulton Rd San Marcos, CA | 3.0 | 2.0 | 1821 | $3,895 | $2.14 | 43d | 1 | 1.00mi |
| 131 Avenida Chapala #105 San Marcos, CA | 3.0 | 2.5 | 1379 | $3,425 | $2.48 | 1d | 1 | 1.21mi |
| 823 Nordahl Rd San Marcos, CA | 1.0–3.0 | 1.0–2.0 | 887 | $2,808 | $3.17 | 2d | 1 | 1.33mi |
HOA detail
- Monthly dues
- $216 · $2,592/yr
Listing history 30 events
-
2026-06-18days on market $300,000 Active 51 DOM
-
2026-06-17days on market $300,000 Active 50 DOM
-
2026-06-16days on market $300,000 Active 49 DOM
-
2026-06-15days on market $300,000 Active 48 DOM
-
2026-06-13days on market $300,000 Active 46 DOM
-
2026-06-09days on market $300,000 Active 42 DOM
-
2026-06-08days on market $300,000 Active 41 DOM
-
2026-06-07days on market $300,000 Active 40 DOM
-
2026-06-04days on market $300,000 Active 37 DOM
-
2026-06-03days on market $300,000 Active 36 DOM
-
2026-06-02days on market $300,000 Active 35 DOM
-
2026-06-01days on market $300,000 Active 34 DOM
-
2026-05-31days on market $300,000 Active 33 DOM
-
2026-04-29historical
-
2026-04-28$300,000 Active 950-char remark
-
2026-04-08$300,000 Active
-
2025-05-16soldstatus $265,000 Sold
Show marketing remark (427 chars)
Looking for a mobile home to upgrade using your own specifications and with building materials to suit your fancy? With this home, comes great bones and a blank canvas for a great start to creating your own comfortable way of living. You will enjoy this country club type community setting and all the amenities that come with it. HOA fee only $185.00 a month. This home to be sold in its present condition and at asking price.
-
2025-04-01status Pending
Show marketing remark (427 chars)
Looking for a mobile home to upgrade using your own specifications and with building materials to suit your fancy? With this home, comes great bones and a blank canvas for a great start to creating your own comfortable way of living. You will enjoy this country club type community setting and all the amenities that come with it. HOA fee only $185.00 a month. This home to be sold in its present condition and at asking price.
-
2025-03-24historical
-
2025-03-22$289,000 Active
Show marketing remark (427 chars)
Looking for a mobile home to upgrade using your own specifications and with building materials to suit your fancy? With this home, comes great bones and a blank canvas for a great start to creating your own comfortable way of living. You will enjoy this country club type community setting and all the amenities that come with it. HOA fee only $185.00 a month. This home to be sold in its present condition and at asking price.
-
2025-02-24$295,000 Active
-
2025-01-12historical
-
2024-12-20price $295,000
-
2024-12-03price $299,500
-
2024-11-11price $309,999
-
2024-11-11price $299,000
-
2024-10-18price $320,000
-
2024-09-30$350,000 Active
-
1999-09-17soldstatus $59,000
-
1985-12-17soldstatus $22,500
ⓘ Source: listings_history table (triggers on properties + properties_extension) + one-shot
backfill from property_details.listing_events for pre-trigger history.
Tax reassessment forecast CA · Resets to sale price
- Current annual tax
- $2,941 · $245/mo
- Projected year-2 tax
- $2,941 · $245/mo
- Expected delta
- $0/yr ($0/mo · 0.0%)
ⓘ Screening estimate from a state-policy table — verify with the county assessor before closing.
Climate risk First Street
- Flood 4/10 Moderate FEMA zone X (unshaded) · 22% chance over 30 yrs
- Wildfire 6/10 Major
- Heat 5/10 Major 7 d/yr ≥97°F today · 21 d/yr by 30 yrs out
- Wind 1/10 Low
- Air quality 3/10 Moderate 4 unhealthy d/yr today · 4 by 30 yrs out
Nearby sold comps map
Loading sold comps map…
Walkable amenities ~0.75 mi
Loading nearby amenities…
Taxation est. · year 1
- Rental income
- $40,671
- − Mortgage interest
- −$16,805
- − Property taxes
- −$2,941
- − Insurance
- −$1,500
- − Repairs & maintenance
- −$3,254
- − Management
- −$3,254
- − HOA
- −$2,592
- − Depreciation
- −$8,727
- Taxable income
- $1,598
- Est. tax owed @ 24.0%
- −$384
- After-tax cash flow
- $5,834/yr
For passive investors: Depreciation is non-cash, so a rental often shows a tax loss while cash-flowing — sheltering income. Rental losses are passive: they offset passive income freely, and up to $25,000/yr can offset ordinary (W-2) income if you actively participate and your MAGI is under $100k (phasing out to $0 by $150k); unused losses carry forward. On sale, claimed depreciation is recaptured at up to 25%, and gains may owe capital-gains tax (a 1031 exchange can defer both). Figures are a year-1 estimate at your 24.0% rate — not tax advice; consult a CPA.
Schools (NCES district)
- District
- San Marcos Unified
- NCES district ID
- 0634880
- Math proficiency
- 52% ▲ 1.00%
- Reading proficiency
- 67% ▲ 2.00%
- Median HH income
- $64,752
- Composite
- 53.67/100
- National rank
- #3093
- State rank
- #249 of 1400 in CA
Livability — San Marcos
- Score
- 77/100
- State rank
- #80
- US rank
- #3074
Category grades
Schools grade is shown separately in the Schools card above.
Census & demographics
- Census place
- San Marcos, CA
- County
- San Diego County · 3,178,799 people
- City population
- 100,940
- Metro
- San Diego-Chula Vista-Carlsbad, CA
- Population (ZIP)
- 47,335
- Household income
- $96,771
- Rent vs Own
- Severe rent burden
- 2399.0
Population outlook (San Diego County) Hauer SSP2
- Today (2025)
- 3,678,185 people
- By 2030
- 3,856,546 · +4.8%
- By 2040
- 4,171,407 · +13.4%
- By 2050
- 4,421,607 · +20.2%
- By 2075
- 4,831,599 · +31.4%
- By 2100
- 4,832,502 · +31.4%
Race, ethnicity, and origin ACS 2023
- Neighborhood character
- Diverse neighborhood (Simpson 0.64)
- Race & ethnicity
- Hispanic / Latino 46% White 36% Two or more races 20% Asian 11% Native American 1% Black 1%
- Hispanic origin (detail)
- Mexican 41%
- Common ancestry
- Lithuanian 2% Romanian 2% Portuguese 2%
- Foreign-born
- 26% · Canada, China, Vietnam
- Languages at home
- 57% English-only · Spanish 32% Tagalog/Filipino 2% Other Asian/Pacific 2%
Political lean MEDSL · San Diego
- 2024 margin
- D (+16.8) · D 56.9% · R 40.1% · Other 2.9%
- 2008→2024 swing
- +6.6pp toward D · 2008: 10.2pp · 2024: 16.8pp
- All cycles
- 2024: D+16.8 2020: D+22.8 2016: D+17.8 2012: D+5.1 2008: D+10.2
Not yet ingested
- Civics
- —
Market trends
- HPI YoY
- ▼ -522.69%
- Current HPI
- 376.182
- Rent YoY
- ▲ 0.55%
- Metro
- San Diego-Chula Vista-Carlsbad, CA
- State GDP YoY
- ▲ 3.21%
- F500 in state
- 116
Industry mix (Fortune 500 HQ in CA)
| Industry | F500 HQs | Revenue |
|---|---|---|
| Technology | 27 | $1,492B |
|
||
| Financial Services | 3 | $174B |
|
||
| Retail | 3 | $44B |
|
||
| Insurance | 3 | $26B |
|
||
| Media / Entertainment | 2 | $115B |
|
||
| Pharmaceuticals / Biotech | 2 | $62B |
|
||
Price history
+1233.3% since first listed17 events — show timeline
- 2026-04-29 Listing Removed — CRMLS
- 2026-04-28 Listed $300,000 CRMLS
- 2026-04-08 Listed $300,000 CRMLS
- 2025-05-16 Sold (MLS) $265,000 SDMLS
- 2025-04-01 Pending — SDMLS
- 2025-03-24 Listing Removed — CRMLS
- 2025-03-22 Listed $289,000 SDMLS
- 2025-02-24 Listed $295,000 CRMLS
- 2025-01-12 Listing Removed — CRMLS
- 2024-12-20 Price Changed $295,000 CRMLS
- 2024-12-03 Price Changed $299,500 CRMLS
- 2024-11-11 Price Changed $309,999 CRMLS
- 2024-11-11 Price Changed $299,000 CRMLS
- 2024-10-18 Price Changed $320,000 CRMLS
- 2024-09-30 Listed $350,000 CRMLS
- 1999-09-17 Sold (Public Records) $59,000 Public Records
- 1985-12-17 Sold (Public Records) $22,500 Public Records
Property tax history
+13.1%/yrLatest (2025): $2,941 · +483.1% YoY. Source: county tax records.
Cash-flow waterfall
monthlySold comps — $/sqft
last 12 mo · ≤1 miLoading sold comps…