 🏗️ New Construction
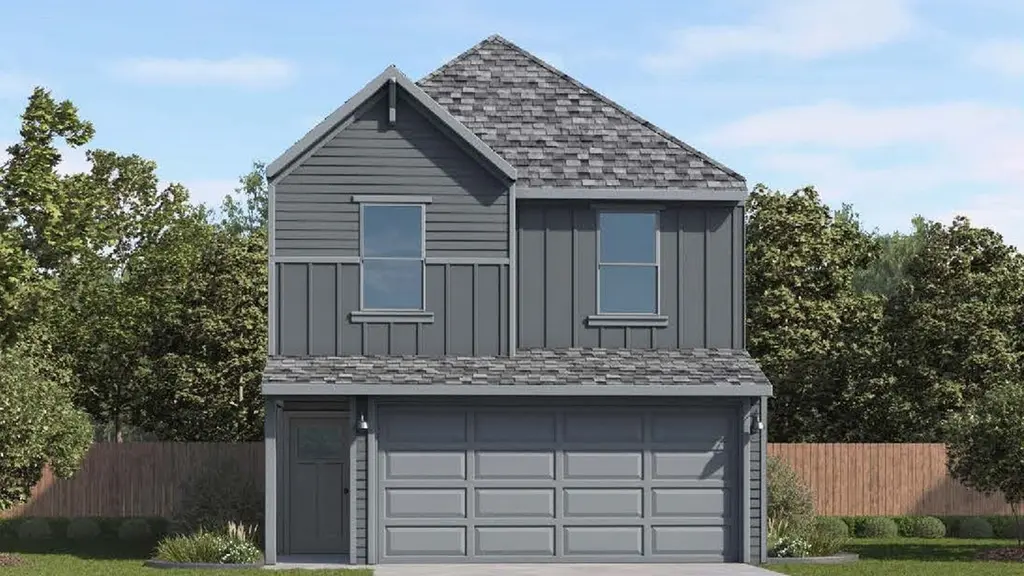
Hibiscus Plan · Sonterra, TX
Flood risk No data
- FEMA flood zone
- —
- Chance of flooding over 30 yrs
- —
- Est. flood insurance / yr
- —
Fire risk No data
- Est. fire insurance / yr
- —
Heat risk No data
- Hot days now (above threshold)
- —
- Hot days in 30 yrs
- —
Wind risk No data
- Chance of severe wind over 30 yrs
- —
Air-quality risk No data
- Unhealthy air days now
- —
- Unhealthy air days in 30 yrs
- —
Risk factors via First Street. Map © Google.
Why this score? — see what drove the F grade
The composite is a weighted blend of 9 inputs, each scored 0–100. Each bar is that input's sub-score; the figure is the points it added to the 100-point composite (weight × sub-score).
- ARV discount +7.5/15.0
- Cash flow +6.4/30.0
- Condition / age +4.0/5.0
- Livability +2.5/5.0
- Rent growth +2.1/5.0
- Schools +2.1/10.0
- 1% rule +1.6/10.0
- DSCR +0.7/10.0
- Appreciation +0.0/10.0
$233,990
🖨 Deal sheet 📄 Offer letter ✓ Due diligence
Listing remarks MLS
Discover the Hibiscus floor plan, a spacious two-story home in our Cool Water community in Jarrell, TX. This inviting 3-bedroom, 2.5 bathroom home offers approximately 1,483 square feet and includes a two-car garage. As you step inside, you'll be greeted by a charming front foyer that leads into the open-concept dining, living, and kitchen area, creating a welcoming and functional space for family gatherings and entertaining. The kitchen features a large island that offers additional storage and seating, making it a perfect hub for meal preparation and casual dining. Just off the kitchen, the living room is the ideal place for relaxing or entertaining. The staircase leading to the second story is located just off the living room, offering a seamless transition to the upper level. Upstairs, the two secondary bedrooms are located to the left, each with its own walk-in closet, providing plenty of storage space. The laundry room is conveniently located next to the secondary bathroom and bedrooms, making laundry day a breeze. At the back of the home, the primary bedroom offers privacy and comfort. The adjoining primary bathroom offers a two-sink vanity, a standing shower, and a spacious walk-in closet, ensuring you have all the room you need. The Hibiscus floor plan offers the perfect balance of modern design, functional living spaces, and comfort, making it the ideal home for families. Don't miss out on the opportunity to make the Hibiscus your new home today!
Key facts
- Walk-in closet
- Hibiscus floor plan
- Large island
Tags
Neighborhood map
What this means for you Summary
Snapshot
- This is a 3-bed/2.5-bath single-family listed at $234k. Condition is rated good.
Deal economics
- At list price, monthly cash flow is $-496 ($-6k/yr) — negative.
- To cash-flow at today's rent, offer at most $217k (7.4% below list).
- To meet the 1% rule (rent ≥ 1% of price), the offer needs to be $190k (19.0% below list).
- Recommended offer: $190k (19.0% below list) — sets the bar for 1% rule.
Location & tenants
- Location reads: area grade F — affects rentability + tenant quality, not the cash-flow math above.
- Jarrell ISD (rural): math 19% / reading 28% proficiency, ranked #713 of 826 in TX (top 86%) — low school quality limits family demand, transient renter base, plan for 1-2y turnover.
- Market conditions: Rents soft (-1.7%/yr); 761 active listings in the ZIP; 34 comparable units currently listed for rent nearby; rentals at typical pace (median 18d on market — plan ~3-4 weeks tenant-placement turnaround); solid renter incomes; 7,543 units permitted in Williamson County in 2024 (1,425 in 5+ unit buildings).
Forward outlook
- Local home prices are declining (-3.0%/yr); year-one equity from $2k of loan paydown is wiped out by about $9k of value loss. Plan a longer hold.
- Williamson County population projected at +69% by 2050 — long-run rental-demand tailwind backs the buy-and-hold thesis.
Negotiation context
- It's been on market 96 days — a 9% lower offer ($213k) is reasonable based on typical stale-listing flexibility.
Questions for the listing agent
- What do current leases actually rent for vs. the listed asking? Can we see a recent rent roll and the last 12 months of T-12 income?
- It's been on market 96 days. Have you received any prior offers? Is the seller open to a 19% concession, seller financing, or rate buy-down credit?
- Why hasn't it sold? Are there any deal-killer items the seller is aware of (foundation, flood, title, zoning, code violations)?
- Is there a deadline driving the sale (1031 exchange, divorce, estate, relocation)? That informs how much negotiation room exists.
- The area grade is low — what's the realistic commute time and amenity access for the typical tenant pool here? Any planned neighborhood developments (good or bad) we should know about?
- What's the average days-on-market for RENTAL listings here right now (not sales)? A rising rental-DOM trend means longer vacancies and softer asking-rent achievability than the comps imply.
- What's the recent tenant-quality profile in this submarket — average credit score on applications, eviction rate, late-payment / NSF rate, and stable-employment percentage? A property-management company in the area should have these aggregated.
- How much new for-sale + rental construction is in the pipeline within 1–3 miles? Heavy new supply typically softens prices + rents 12–24 months out; constrained supply supports both.
Investment metrics
- 1% rule
- 0.66% ✗
- Cap rate
- 4.23%
- Cash-on-cash
- -7.37%
- DSCR
- 0.67
- GRM
- 12.7
CMA / ARV
- ARV (median comp)
- $288,447
- List price
- $233,990
- Delta
- -18.88%
- Verdict
- UNDERPRICED
- Comps
- 20 within 1.0 mi
Show comp detail 12 sales within ~0.75 mi
| Address | Dist | Beds/Ba | Sqft | Sold | Price | $/sf | Match |
|---|---|---|---|---|---|---|---|
| 149 Starpacker Ln | 0.31mi | 3/2.0 | 1,418 (-4%) | 0mo | $204,999 | $145 | 76 |
| 141 Starpacker Ln | 0.31mi | 3/2.0 | 1,418 (-4%) | 1mo | $204,999 | $145 | 75 |
| 129 Starpacker Ln | 0.32mi | 3/2.0 | 1,418 (-4%) | 1mo | $218,999 | $154 | 75 |
| 360 Brannigan Dr | 0.32mi | 3/2.0 | 1,409 (-5%) | 1mo | $216,999 | $154 | 74 |
| 113 Starpacker Ln | 0.34mi | 3/2.0 | 1,418 (-4%) | 3mo | $226,990 | $160 | 73 |
| 116 Starpacker Ln | 0.31mi | 4/2.0 (+1) | 1,607 (+8%) | 1mo | $246,999 | $154 | 64 |
| 129 Morrison Dr | 0.48mi | 3/2.0 | 1,580 (+6%) | 2mo | $252,900 | $160 | 63 |
| 356 Brannigan Dr | 0.32mi | 4/2.0 (+1) | 1,607 (+8%) | 2mo | $239,990 | $149 | 63 |
| 121 Starpacker Ln | 0.33mi | 4/2.0 (+1) | 1,607 (+8%) | 1mo | $232,999 | $145 | 62 |
| 344 Brannigan Dr | 0.33mi | 4/2.0 (+1) | 1,607 (+8%) | 2mo | $229,990 | $143 | 62 |
| 117 Starpacker Ln | 0.34mi | 3/2.0 | 1,273 (-14%) | 1mo | $201,999 | $159 | 58 |
| 109 Green Berets Bnd | 0.63mi | 3/2.5 | 1,625 (+10%) | 2mo | $271,990 | $167 | 53 |
Match score weights: distance 35% · size 25% · config 20% · recency 20%. Top-matched comps best support the ARV.
Projected returns pro-forma
-3.0% appreciation · 0.0% rent growth · sell at horizon
- IRR
- -32.5%
- Equity multiple
- -0.04×
- Total profit
- $-83,857
- Equity at exit
- $43,008
- IRR
- -59.8%
- Equity multiple
- -0.67×
- Total profit
- $-135,049
- Equity at exit
- $24,940
Cash invested: $80,765 (down + closing). Projections, not guarantees.
Landlord ↔ Tenant lean methodology
- Overall (STATE)
- 87 Strongly Landlord-Friendly
- State Texas
- 87 Strongly Landlord-Friendly · R+5
- County
- — inherits STATE
- City
- — inherits STATE
ZIP-level market 76537
- Home prices YoY
- -14.4%
- Rents YoY
- -1.7%
- Active inventory
- 761
- Price-to-rent
- 10.3×
Monthly cashflow live
- Estimated rent
- $1,895 high interval (Pro) →
- Mortgage (P&I)
- −$1,513
- Tax est. 1.5%
- −$361 /mo · $4,327/yr
- Insurance
- −$120
- HOA
- −$0
- Vacancy / Maint / Mgmt
- −$398
- Net cashflow
- $-496
Break-even live
UW: 25.0% down · 7.5% · 30yr · 1.5% tax · 5.0% vac · 8.0% maint · 8.0% mgmt
Financing live
Cash to close
- Down payment
- $72,112
- Closing costs
- $8,653
- Reserves months
- —
- Total cash needed
- —
Loan-product check · same deal, 3 products live
Conventional
25% down · 7.5% · 30yr
- Down + closing
- —
- Monthly P&I
- —
- Monthly cashflow
- —
- DSCR
- —
- Eligible?
- —
Personal DTI + credit; lowest rate.
DSCR
20% down · 8.5% · 30yr
- Down + closing
- —
- Monthly P&I
- —
- Monthly cashflow
- —
- DSCR
- —
- Eligible?
- —
No personal income docs; deal must DSCR.
Hard money
10% down · 12.0% · 12mo
- Down + closing
- —
- Monthly P&I
- —
- Monthly cashflow
- —
- DSCR
- —
- Eligible?
- —
Short-term bridge; refi at stabilization.
Rent comps 34 comps
| Address | Beds | Baths | Sqft | Rent | $/sqft | DOM | Units | Dist |
|---|---|---|---|---|---|---|---|---|
| 121 Old Stagecoach Rd Jarrell, TX | 4.0 | 2.0 | 1531 | $1,800 | $1.18 | 43d | 1 | 0.19mi |
| 104 Fighting Seabees Run Unit NA Jarrell, TX | 2.0 | 1.0 | 900 | $1,500 | $1.67 | 2d | 1 | 0.20mi |
| 201 Fighting Seabees Run Jarrell, TX | 4.0 | 2.0 | 1667 | $1,900 | $1.14 | 7d | 1 | 0.24mi |
| 105 McLintock Rd Jarrell, TX | 3.0–5.0 | 2.0–3.5 | 1773 | $2,055 | $1.16 | 1d | 1 | 0.29mi |
| 313 McLintock Rd Jarrell, TX | 4.0 | 2.0 | 1855 | $2,000 | $1.08 | 2d | 1 | 0.29mi |
| 360 Brannigan Dr Jarrell, TX | 3.0 | 2.0 | 1409 | $1,700 | $1.21 | 1d | 1 | 0.32mi |
| 221 Barbary Coast Ln Jarrell, TX | 3.0 | 2.0 | 1450 | $1,750 | $1.21 | 1d | 1 | 0.37mi |
| 120 Morrison Dr Jarrell, TX | 3.0 | 2.0 | 1580 | $2,210 | $1.40 | 16d | 1 | 0.45mi |
| 252 Wild Wind Trl Jarrell, TX | 3.0 | 2.0 | 1243 | $1,650 | $1.33 | 17d | 1 | 0.85mi |
| 107 Wild Wind Cv Jarrell, TX | 3.0 | 2.0 | 1214 | $1,700 | $1.40 | 43d | 1 | 0.88mi |
| 154 Hammond Jarrell, TX | 3.0 | 2.0 | 1500 | $1,900 | $1.27 | 3d | 1 | 0.95mi |
| 104 Hellfighters Way Jarrell, TX | 3.0 | 2.5 | 1619 | $2,000 | $1.24 | 43d | 1 | 0.98mi |
| 112 Ragnar Jarrell, TX | 3.0 | 2.0 | 1251 | $1,495 | $1.20 | 19d | 1 | 1.01mi |
| 112 Ragnar Jarrell, TX | 3.0 | 2.0 | 1251 | $1,495 | $1.20 | 16d | 1 | 1.01mi |
| 241 Alcatraz Loop Jarrell, TX | 3.0 | 2.0 | 1288 | $1,895 | $1.47 | 17d | 1 | 1.03mi |
| 449 Stone Water Ln Jarrell, TX | 3.0 | 2.5 | 1674 | $1,900 | $1.14 | 43d | 1 | 1.04mi |
| 621 Xanadu Dr Jarrell, TX | 3.0 | 2.0 | 1586 | $1,750 | $1.10 | 4d | 1 | 1.14mi |
| 137 Kellys Heroes Way Jarrell, TX | 3.0 | 2.0 | 1214 | $1,695 | $1.40 | 43d | 1 | 1.15mi |
| 125 Kellys Heroes Way Jarrell, TX | 3.0 | 2.0 | 1641 | $1,650 | $1.01 | 43d | 1 | 1.16mi |
| 149 Vulcan Dr Jarrell, TX | 3.0 | 2.0 | 1450 | $1,799 | $1.24 | 23d | 1 | 1.26mi |
| 117 Galaxy Way Jarrell, TX | 3.0 | 2.0 | 1276 | $1,650 | $1.29 | 20d | 1 | 1.29mi |
| 600 Shimek St Unit 19A Jarrell, TX | 3.0 | 2.0 | 1357 | $1,650 | $1.22 | 17d | 1 | 1.31mi |
| 873 Circle Way Jarrell, TX | 3.0 | 2.0 | 1450 | $1,650 | $1.14 | 14d | 1 | 1.31mi |
| 1100 Jackson Ln Jarrell, TX | 4.0 | 2.5 | 1839 | $1,745 | $0.95 | 4d | 1 | 1.39mi |
| 324 Circle Way Jarrell, TX | 3.0 | 2.5 | 1661 | $1,650 | $0.99 | 11d | 1 | 1.39mi |
| 104 Perfect World Loop Jarrell, TX | 4.0 | 2.0 | 1751 | $1,885 | $1.08 | 4d | 1 | 1.40mi |
| 104 Perfect World Loop Jarrell, TX | 4.0 | 2.0 | 1751 | $1,885 | $1.08 | 2d | 1 | 1.40mi |
| 637 The Ugly Way Jarrell, TX | 4.0 | 2.0 | 1688 | $1,795 | $1.06 | 43d | 1 | 1.42mi |
| 504 Wyatt Way Jarrell, TX | 4.0 | 2.0 | 1612 | $1,895 | $1.18 | 17d | 1 | 1.42mi |
| 508 Wyatt Way Jarrell, TX | 3.0 | 2.0 | 1500 | $1,800 | $1.20 | 43d | 1 | 1.43mi |
| 340 The Bad Way Jarrell, TX | 4.0 | 2.0 | 1616 | $1,695 | $1.05 | 43d | 1 | 1.44mi |
| 340 The Bad Way Jarrell, TX | 4.0 | 2.0 | 1616 | $1,695 | $1.05 | 23d | 1 | 1.44mi |
| 244 Circle Way Jarrell, TX | 3.0 | 2.0 | 1242 | $1,545 | $1.24 | 20d | 1 | 1.45mi |
| 420 Perfect World Loop Jarrell, TX | 3.0 | 2.0 | 1242 | $1,500 | $1.21 | 4d | 1 | 1.48mi |
Listing history 14 events
-
2026-06-18days on market $233,990 Active 96 DOM
-
2026-06-17days on market $233,990 Active 95 DOM
-
2026-06-16days on market $233,990 Active 94 DOM
-
2026-06-15days on market $233,990 Active 93 DOM
-
2026-06-13days on market $233,990 Active 91 DOM
-
2026-06-09days on market $233,990 Active 87 DOM
-
2026-06-08days on market $233,990 Active 86 DOM
-
2026-06-07days on market $233,990 Active 85 DOM
-
2026-06-04days on market $233,990 Active 82 DOM
-
2026-06-03days on market $233,990 Active 81 DOM
-
2026-06-02days on market $233,990 Active 80 DOM
-
2026-06-01days on market $233,990 Active 79 DOM
-
2026-05-31days on market $233,990 Active 78 DOM
-
2026-03-14$233,990 Active 1480-char remark
Show marketing remark (1480 chars)
Discover the Hibiscus floor plan, a spacious two-story home in our Cool Water community in Jarrell, TX. This inviting 3-bedroom, 2.5 bathroom home offers approximately 1,483 square feet and includes a two-car garage. As you step inside, you'll be greeted by a charming front foyer that leads into the open-concept dining, living, and kitchen area, creating a welcoming and functional space for family gatherings and entertaining. The kitchen features a large island that offers additional storage and seating, making it a perfect hub for meal preparation and casual dining. Just off the kitchen, the living room is the ideal place for relaxing or entertaining. The staircase leading to the second story is located just off the living room, offering a seamless transition to the upper level. Upstairs, the two secondary bedrooms are located to the left, each with its own walk-in closet, providing plenty of storage space. The laundry room is conveniently located next to the secondary bathroom and bedrooms, making laundry day a breeze. At the back of the home, the primary bedroom offers privacy and comfort. The adjoining primary bathroom offers a two-sink vanity, a standing shower, and a spacious walk-in closet, ensuring you have all the room you need. The Hibiscus floor plan offers the perfect balance of modern design, functional living spaces, and comfort, making it the ideal home for families. Don't miss out on the opportunity to make the Hibiscus your new home today!
ⓘ Source: listings_history table (triggers on properties + properties_extension) + one-shot
backfill from property_details.listing_events for pre-trigger history.
Nearby sold comps map
Loading sold comps map…
Walkable amenities ~0.75 mi
Loading nearby amenities…
Taxation est. · year 1
- Rental income
- $22,745
- − Mortgage interest
- −$16,158
- − Property taxes
- −$4,327
- − Insurance
- −$1,442
- − Repairs & maintenance
- −$1,820
- − Management
- −$1,820
- − Depreciation
- −$8,391
- Taxable loss
- −$11,212
- Est. tax savings @ 24.0%
- +$2,691
- After-tax cash flow
- $-3,261/yr
For passive investors: Depreciation is non-cash, so a rental often shows a tax loss while cash-flowing — sheltering income. Rental losses are passive: they offset passive income freely, and up to $25,000/yr can offset ordinary (W-2) income if you actively participate and your MAGI is under $100k (phasing out to $0 by $150k); unused losses carry forward. On sale, claimed depreciation is recaptured at up to 25%, and gains may owe capital-gains tax (a 1031 exchange can defer both). Figures are a year-1 estimate at your 24.0% rate — not tax advice; consult a CPA.
Condition & rehab AI · 12 photos
This Hibiscus floor plan home in Sonterra, TX, is in good condition with modern finishes and a well-maintained exterior. It offers a spacious and functional living space with a good ROI potential for both resale and rental.
Value-add opportunities
- Both Painting exterior and interior walls — Fresh paint enhances curb appeal and interior aesthetics.
- Both Landscaping improvements — Enhances curb appeal and adds value to the property.
Renovation cost estimate screening
Value-add ROI direction
- Both Painting exterior and interior walls — Fresh paint enhances curb appeal and interior aesthetics. ↑
- Both Landscaping improvements — Enhances curb appeal and adds value to the property. ↑
ⓘ Cost ranges are severity-bucket heuristics (US national rule-of-thumb). Get contractor quotes + a written scope before underwriting a rehab budget.
Schools (NCES district)
- District
- Jarrell ISD
- NCES district ID
- 4824600
- Math proficiency
- 19% ▼ -18.00%
- Reading proficiency
- 28% ▼ -5.00%
- Median HH income
- $57,132
- Composite
- 21.47/100
- National rank
- #8335
- State rank
- #713 of 826 in TX
Livability — Sonterra
No livability data for this city. (Only ~50 U.S. cities are tracked.)
Census & demographics
- County
- Williamson County · 680,029 people
- City population
- 12,526
- Metro
- Austin-Round Rock-Georgetown, TX
- Population (ZIP)
- 16,272
- Household income
- $98,199
- Rent vs Own
- Severe rent burden
- 225.0
Population outlook (Williamson County) Hauer SSP2
- Today (2025)
- 699,027 people
- By 2030
- 795,537 · +13.8%
- By 2040
- 990,683 · +41.7%
- By 2050
- 1,184,292 · +69.4%
- By 2075
- 1,623,825 · +132.3%
- By 2100
- 1,924,153 · +175.3%
Race, ethnicity, and origin ACS 2023
- Neighborhood character
- Diverse neighborhood (Simpson 0.63)
- Race & ethnicity
- White 48% Hispanic / Latino 36% Two or more races 14% Black 7% Asian 4%
- Hispanic origin (detail)
- Mexican 30% Puerto Rican 5%
- Common ancestry
- Romanian 3% Italian 2% Slovak 1%
- Foreign-born
- 13% · Canada, Vietnam
- Languages at home
- 69% English-only · Spanish 26% Chinese 2% French/Haitian/Cajun 1%
Political lean MEDSL · Williamson
- 2024 margin
- Toss-up / Even · D 48.0% · R 50.4% · Other 1.6%
- 2008→2024 swing
- +10.6pp toward D · 2008: -13.0pp · 2024: -2.5pp
- All cycles
- 2024: R+2.5 2020: D+1.4 2016: R+9.9 2012: R+21.5 2008: R+13.0
Not yet ingested
- Civics
- —
Market trends
- HPI YoY
- ▼ -31.03%
- Current HPI
- 184.8935
- Rent YoY
- ▼ -1.73%
- Metro
- Austin-Round Rock-Georgetown, TX
- State GDP YoY
- ▲ 3.95%
- F500 in state
- 110
Industry mix (Fortune 500 HQ in TX)
| Industry | F500 HQs | Revenue |
|---|---|---|
| Energy | 16 | $1,198B |
|
||
| Technology | 5 | $198B |
|
||
| Engineering / Construction | 4 | $72B |
|
||
| Energy Services | 3 | $60B |
|
||
| Utilities | 3 | $41B |
|
||
| Healthcare | 2 | $330B |
|
||
Price history
1 event — show timeline
- 2026-03-14 Listed $233,990 Zillow
Cash-flow waterfall
monthlySold comps — $/sqft
last 12 mo · ≤1 miLoading sold comps…