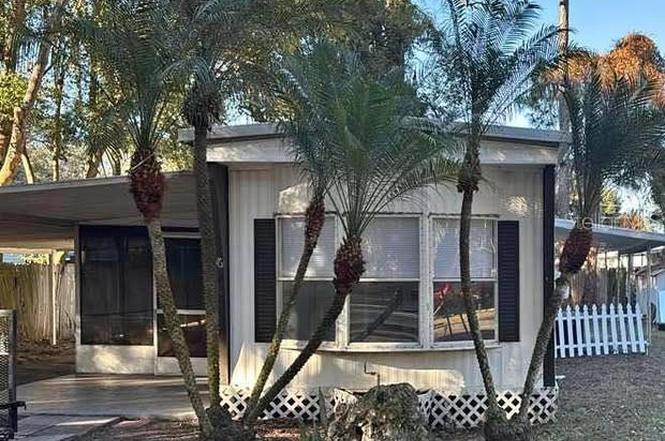
212 Sunset Dr · Lake Alfred, FL
Flood risk 1/10 · Minimal
- FEMA flood zone
- X (unshaded)
- Chance of flooding over 30 yrs
- 0.0%
- Est. flood insurance / yr
- $507 – $1,088
Fire risk 5/10 · Moderate
- Est. fire insurance / yr
- $947 – $1,759
Heat risk 8/10 · Major
- Hot days now (above 107°F)
- 7 days/yr
- Hot days in 30 yrs
- 23 days/yr
Wind risk 9/10 · Severe
- Chance of severe wind over 30 yrs
- 99.0%
Air-quality risk 2/10 · Minimal
- Unhealthy air days now
- 0 days/yr
- Unhealthy air days in 30 yrs
- 1 days/yr
Risk factors via First Street. Map © Google.
Why this score? — see what drove the B- grade
The composite is a weighted blend of 9 inputs, each scored 0–100. Each bar is that input's sub-score; the figure is the points it added to the 100-point composite (weight × sub-score).
- Cash flow +30.0/30.0
- DSCR +10.0/10.0
- 1% rule +8.5/10.0
- ARV discount +7.5/15.0
- Livability +3.6/5.0
- Schools +3.5/10.0
- Rent growth +2.5/5.0
- Condition / age +2.5/5.0
- Appreciation +0.0/10.0
$109,000
🖨 Deal sheet 📄 Offer letter ✓ Due diligence
Listing remarks
Price greatly reduced. .. No lot rent or HOA fees. Clean 2/1 in Lake Alfred ready for your next project or rental. Features a durable metal roof, luxury vinyl floors, and a private carport. Owner financing is on the table! Excellent location near Lake Mariana boat ramps perfect for attracting long-term tenants or vacationing anglers. No lease restrictions provide maximum flexibility for your investment strategy. Property has rented for $1200 monthly in the past. Act fast on this low-carry-cost opportunity in a prime central Florida location. All sizes are approximate to be verified by buyer.
Key facts
- Carport
- Public boat ramps
- Welcoming porch
Tags
Property features AI
Finance
- Other: Lot size about 0.1 acre (0 to less than 1/4 acre)
- HOA & community: No association indicated
Exterior
- Parking: Carport with 1 space
- Utilities: Public water; Public sewer; Cable available; Electricity available
- Home design: Residential mobile home (single wide); One story; Fixer condition; Home faces south; Entry level: One
- Construction: Metal frame construction; Metal siding; Metal roof; Crawlspace and slab foundation (other foundation type listed); Built area approximately 1,000–1,200 square feet
- Exterior features: Other exterior features; Asphalt road access; Public maintained road
Interior
- Kitchen: Refrigerator
- Bedrooms: 2 bedrooms
- Bathrooms: 1 full bathroom
- Heating & cooling: Ductless heating; Wall/window air conditioning units
- Interior features: Living room and dining room combined; Solid surface counters; Other interior features
- Laundry & utility: Washer; Dryer; Electric water heater; Laundry located inside
Neighborhood map
What this means for you Summary
Snapshot
- This is a 2-bed/1.0-bath manufactured listed at $109k.
Deal economics
- At list price, monthly cash flow is $433 ($5k/yr) — positive.
- The deal already cash-flows at list — no discount required.
- Meets the 1% rule at list price ($1k rent vs $109k).
- Recommended offer: $99k (9.0% below list) — sets the bar for market timing.
Location & tenants
- Location reads 72/100 on livability (#363 in FL) — a middle-class / working-renter tenant base. Strengths: crime A+, cost of living A+, housing A+; Watch: schools C-, employment D, amenities F.
- Polk (suburban): math 39% / reading 43% proficiency, ranked #62 of 73 in FL (top 85%) — families likely to look elsewhere, expect single-tenant / working-renter base with shorter leases.
- Market conditions: 279 active listings in the ZIP; 10,384 units permitted in Polk County in 2024 (1,716 in 5+ unit buildings).
Forward outlook
- Local home prices are declining (-3.0%/yr); year-one equity from $754 of loan paydown is wiped out by about $3k of value loss. Plan a longer hold.
- Polk County population projected at +33% by 2050 — long-run rental-demand tailwind backs the buy-and-hold thesis.
- At projected returns (-3.0% appreciation + 3.0% rent growth), your $31k cash investment doubles in ~8 years — after that, you're playing with house money.
Negotiation context
- It's been on market 95 days — a 9% lower offer ($99k) is reasonable based on typical stale-listing flexibility.
- Current owner paid $42k; list at $109k implies a 160% gain — meaningful room to come down on a strong offer.
Risks & watch-outs
- Climate carrying-cost: severe wind risk, 99% chance of damaging wind over 30y; moderate wildfire risk; extreme-heat days projected 7→23/yr by 2055 (HVAC capex compounding) — expect insurance premiums to compound above CPI over the hold.
Questions for the listing agent
- It's been on market 95 days. Have you received any prior offers? Is the seller open to a 9% concession, seller financing, or rate buy-down credit?
- Built in 1972 — when were the roof, HVAC, electrical panel, plumbing, and water heater last replaced?
- Why hasn't it sold? Are there any deal-killer items the seller is aware of (foundation, flood, title, zoning, code violations)?
- Is there a deadline driving the sale (1031 exchange, divorce, estate, relocation)? That informs how much negotiation room exists.
- What's the average days-on-market for RENTAL listings here right now (not sales)? A rising rental-DOM trend means longer vacancies and softer asking-rent achievability than the comps imply.
- What's the recent tenant-quality profile in this submarket — average credit score on applications, eviction rate, late-payment / NSF rate, and stable-employment percentage? A property-management company in the area should have these aggregated.
- How much new for-sale + rental construction is in the pipeline within 1–3 miles? Heavy new supply typically softens prices + rents 12–24 months out; constrained supply supports both.
Investment metrics
- 1% rule
- 1.35% ✓
- Cap rate
- 11.06%
- Cash-on-cash
- 17.04%
- DSCR
- 1.76
- GRM
- 6.2
CMA / ARV
No comps found within radius.
Projected returns pro-forma
-3.0% appreciation · 3.0% rent growth · sell at horizon
- IRR
- 8.3%
- Equity multiple
- 1.33×
- Total profit
- $9,951
- Equity at exit
- $16,252
- IRR
- 17.6%
- Equity multiple
- 2.45×
- Total profit
- $44,249
- Equity at exit
- $9,424
Cash invested: $30,520 (down + closing). Projections, not guarantees.
Landlord ↔ Tenant lean methodology
- Overall (STATE)
- 87 Strongly Landlord-Friendly
- State Florida
- 87 Strongly Landlord-Friendly · R+3
- County
- — inherits STATE
- City
- — inherits STATE
ZIP-level market 33850
- Home prices YoY
- -8.5%
- Active inventory
- 279
- Price-to-rent
- 6.2×
Monthly cashflow live
- Estimated rent
- $1,476 medium interval (Pro) →
- Mortgage (P&I)
- −$572
- Tax from tax record
- −$115 /mo · $1,385/yr
- Insurance
- −$45
- HOA
- −$0
- Vacancy / Maint / Mgmt
- −$310
- Net cashflow
- $433
Break-even live
UW: 25.0% down · 7.5% · 30yr · 1.5% tax · 5.0% vac · 8.0% maint · 8.0% mgmt
Financing live
Cash to close
- Down payment
- $27,250
- Closing costs
- $3,270
- Reserves months
- —
- Total cash needed
- —
Loan-product check · same deal, 3 products live
Conventional
25% down · 7.5% · 30yr
- Down + closing
- —
- Monthly P&I
- —
- Monthly cashflow
- —
- DSCR
- —
- Eligible?
- —
Personal DTI + credit; lowest rate.
DSCR
20% down · 8.5% · 30yr
- Down + closing
- —
- Monthly P&I
- —
- Monthly cashflow
- —
- DSCR
- —
- Eligible?
- —
No personal income docs; deal must DSCR.
Hard money
10% down · 12.0% · 12mo
- Down + closing
- —
- Monthly P&I
- —
- Monthly cashflow
- —
- DSCR
- —
- Eligible?
- —
Short-term bridge; refi at stabilization.
Listing history 22 events
-
2026-06-18price $109,000 Active 95 DOM
-
2026-06-18days on market $119,000 Active 95 DOM
-
2026-06-17days on market $119,000 Active 94 DOM
-
2026-06-16days on market $119,000 Active 93 DOM
-
2026-06-15days on market $119,000 Active 92 DOM
-
2026-06-13days on market $119,000 Active 90 DOM
-
2026-06-10days on market $119,000 Active 87 DOM
-
2026-06-09days on market $119,000 Active 86 DOM
-
2026-06-08days on market $119,000 Active 85 DOM
-
2026-06-07days on market $119,000 Active 84 DOM
-
2026-06-05days on market $119,000 Active 81 DOM
-
2026-06-03days on market $119,000 Active 80 DOM
-
2026-06-03days on market $119,000 Active 79 DOM
-
2026-06-01days on market $119,000 Active 78 DOM
-
2026-05-31days on market $119,000 Active 77 DOM
-
2026-04-28price $119,000
-
2026-04-09price $50,000
-
2026-03-15$129,000 Active
-
2007-05-07soldstatus $42,000
-
2003-10-09soldstatus $26,500
-
2001-09-10soldstatus $25,000
-
1996-10-07soldstatus $21,500
ⓘ Source: listings_history table (triggers on properties + properties_extension) + one-shot
backfill from property_details.listing_events for pre-trigger history.
Tax reassessment forecast FL · Resets to sale price
- Current annual tax
- $1,385 · $115/mo
- Projected year-2 tax
- $1,385 · $115/mo
- Expected delta
- $0/yr ($0/mo · 0.0%)
ⓘ Screening estimate from a state-policy table — verify with the county assessor before closing.
Climate risk First Street
- Flood 1/10 Low FEMA zone X (unshaded) · 0% chance over 30 yrs
- Wildfire 5/10 Major
- Heat 8/10 Severe 7 d/yr ≥107°F today · 23 d/yr by 30 yrs out
- Wind 9/10 Extreme 99% chance of damaging wind over 30 yrs
- Air quality 2/10 Low 0 unhealthy d/yr today · 1 by 30 yrs out
Nearby sold comps map
Loading sold comps map…
Walkable amenities ~0.75 mi
Loading nearby amenities…
Taxation est. · year 1
- Rental income
- $17,709
- − Mortgage interest
- −$6,106
- − Property taxes
- −$1,385
- − Insurance
- −$545
- − Repairs & maintenance
- −$1,417
- − Management
- −$1,417
- − Depreciation
- −$3,171
- Taxable income
- $3,669
- Est. tax owed @ 24.0%
- −$881
- After-tax cash flow
- $4,320/yr
For passive investors: Depreciation is non-cash, so a rental often shows a tax loss while cash-flowing — sheltering income. Rental losses are passive: they offset passive income freely, and up to $25,000/yr can offset ordinary (W-2) income if you actively participate and your MAGI is under $100k (phasing out to $0 by $150k); unused losses carry forward. On sale, claimed depreciation is recaptured at up to 25%, and gains may owe capital-gains tax (a 1031 exchange can defer both). Figures are a year-1 estimate at your 24.0% rate — not tax advice; consult a CPA.
Schools (NCES district)
- District
- Polk
- NCES district ID
- 1201590
- Math proficiency
- 39% ▼ -11.00%
- Reading proficiency
- 43% ▼ -4.00%
- Median HH income
- $43,979
- Composite
- 34.74/100
- National rank
- #5132
- State rank
- #62 of 73 in FL
Livability — Lake Alfred
- Score
- 72/100
- State rank
- #363
- US rank
- #6406
Category grades
Schools grade is shown separately in the Schools card above.
Census & demographics
- County
- Polk County · 740,051 people
- City population
- 9,757
- Metro
- Lakeland-Winter Haven, FL
- Population (ZIP)
- 9,757
- Household income
- $61,622
- Rent vs Own
- Severe rent burden
- 431.0
Population outlook (Polk County) Hauer SSP2
- Today (2025)
- 752,975 people
- By 2030
- 804,621 · +6.9%
- By 2040
- 906,117 · +20.3%
- By 2050
- 1,000,476 · +32.9%
- By 2075
- 1,197,520 · +59.0%
- By 2100
- 1,271,518 · +68.9%
Race, ethnicity, and origin ACS 2023
- Neighborhood character
- Diverse neighborhood (Simpson 0.63)
- Race & ethnicity
- White 54% Hispanic / Latino 24% Black 11% Asian 9% Two or more races 8%
- Hispanic origin (detail)
- Mexican 3% Puerto Rican 15% Dominican 2%
- Common ancestry
- Lithuanian 2% Italian 2% Romanian 1%
- Foreign-born
- 15% · Canada, China
- Languages at home
- 72% English-only · Spanish 21% Other Asian/Pacific 2% Other Indo-European 2%
Political lean MEDSL · Polk
- 2024 margin
- Strong R (+20.7) · D 39.2% · R 59.9%
- 2008→2024 swing
- -14.6pp toward R · 2008: -6.1pp · 2024: -20.7pp
- All cycles
- 2024: R+20.7 2020: R+14.4 2016: R+14.1 2012: R+6.8 2008: R+6.1
Not yet ingested
- Civics
- —
Market trends
- HPI YoY
- ▼ -32.91%
- Current HPI
- 353.941
- Rent YoY
- —
- Metro
- Lakeland-Winter Haven, FL
- State GDP YoY
- ▲ 3.28%
- F500 in state
- 36
Industry mix (Fortune 500 HQ in FL)
| Industry | F500 HQs | Revenue |
|---|---|---|
| Industrial Technology | 2 | $29B |
|
||
| Insurance | 2 | $17B |
|
||
| Retail | 1 | $60B |
|
||
| Technology Distribution | 1 | $58B |
|
||
| Homebuilding | 1 | $35B |
|
||
| Technology Manufacturing | 1 | $35B |
|
||
Price history
+453.5% since first listed7 events — show timeline
- 2026-04-28 Price Changed $119,000 Stellar MLS as Distributed by MLS Grid
- 2026-04-09 Price Changed $50,000 Stellar MLS as Distributed by MLS Grid
- 2026-03-15 Listed $129,000 Stellar MLS as Distributed by MLS Grid
- 2007-05-07 Sold (Public Records) $42,000 Public Records
- 2003-10-09 Sold (Public Records) $26,500 Public Records
- 2001-09-10 Sold (Public Records) $25,000 Public Records
- 1996-10-07 Sold (Public Records) $21,500 Public Records
Property tax history
+12.9%/yrLatest (2025): $1,385 · +11.6% YoY. Source: county tax records.
Cash-flow waterfall
monthlySold comps — $/sqft
last 12 mo · ≤1 miLoading sold comps…