 🏗️ New Construction
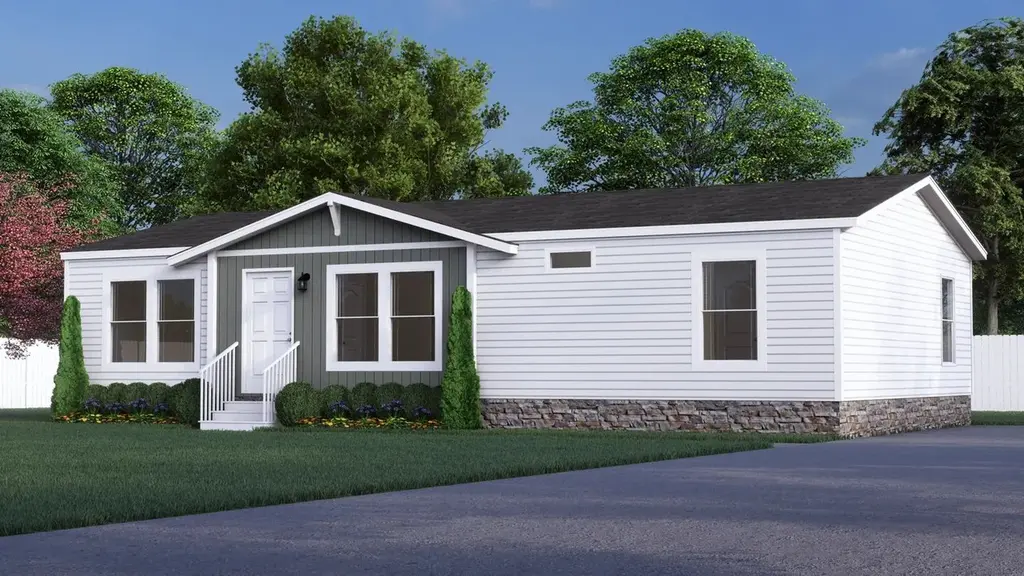
Renegade Plan · Austin, TX
Flood risk 1/10 · Minimal
- FEMA flood zone
- X (unshaded)
- Chance of flooding over 30 yrs
- 0.0%
- Est. flood insurance / yr
- $507 – $1,088
Fire risk 5/10 · Moderate
- Est. fire insurance / yr
- $1,222 – $2,270
Heat risk 8/10 · Major
- Hot days now (above 108°F)
- 7 days/yr
- Hot days in 30 yrs
- 25 days/yr
Wind risk 8/10 · Major
- Chance of severe wind over 30 yrs
- 80.0%
Air-quality risk 2/10 · Minimal
- Unhealthy air days now
- 0 days/yr
- Unhealthy air days in 30 yrs
- 1 days/yr
Risk factors via First Street. Map © Google.
Why this score? — see what drove the D+ grade
The composite is a weighted blend of 9 inputs, each scored 0–100. Each bar is that input's sub-score; the figure is the points it added to the 100-point composite (weight × sub-score).
- Cash flow +17.6/30.0
- ARV discount +7.5/15.0
- DSCR +5.5/10.0
- 1% rule +4.7/10.0
- Livability +4.1/5.0
- Condition / age +4.0/5.0
- Rent growth +2.6/5.0
- Schools +2.0/10.0
- Appreciation +0.0/10.0
$119,995
🖨 Deal sheet 📄 Offer letter ✓ Due diligence
Listing remarks MLS
The Renegade blends style, comfort, and efficiency in a thoughtfully designed manufactured home. With an open floor plan that feels expansive, it's perfect for both lively gatherings and quiet evenings. The luxurious master suite offers a private retreat, while the split-bedroom layout ensures space and privacy for the whole family. A chef-inspired kitchen with a countertop bar island makes cooking, meals, and conversations effortless. Daily living is simplified with an easy-access bathroom and nearby washer/dryer space. Built with Clayton's eBuilt™ system, this home includes 25+ eco-friendly features, combining energy savings with modern comfort. Key Features: Open floor plan Master suite retreat Split-bedroom design Countertop bar island Washer/dryer space 25+ eco-friendly features with eBuilt™
Key facts
- Open floor plan
- Master suite retreat
- Washer dryer space
Tags
Neighborhood map
What this means for you Summary
Snapshot
- This is a 3-bed/2.0-bath manufactured listed at $120k. Condition is rated good.
Deal economics
- At list price, monthly cash flow is $160 ($2k/yr) — positive.
- The deal already cash-flows at list — no discount required.
- Meets the 1% rule at list price ($2k rent vs $120k).
- Recommended offer: $113k (6.0% below list) — sets the bar for market timing.
- Cap rate 7.2% vs local median 1.8% in Austin — top-decile yield for the area; either an underpriced asset or a hidden risk that comps aren't pricing in. Stress-test before assuming the spread holds.
Location & tenants
- Location reads 82/100 on livability (#16 in TX, #1,208 nationally) — a professional / high-income tenant draw. Strengths: amenities A+, commute A+, employment A+; Watch: cost of living D, crime F.
- Manor ISD (rural): math 18% / reading 26% proficiency, ranked #729 of 826 in TX (top 88%) — low school quality limits family demand, transient renter base, plan for 1-2y turnover; 71% free/reduced lunch — lower-income household profile, screen leases tightly.
- Market conditions: Rents flat; 176 active listings in the ZIP; 32 comparable units currently listed for rent nearby; rentals at typical pace (median 20d on market — plan ~3-4 weeks tenant-placement turnaround); solid renter incomes; 17,121 units permitted in Travis County in 2024 (11,963 in 5+ unit buildings).
- This rent runs 31% of the median local income ($78k/yr) — at the standard rent-burdened threshold; future hikes will face affordability resistance.
Forward outlook
- Local home prices are declining (-3.0%/yr); year-one equity from $1k of loan paydown is wiped out by about $6k of value loss. Plan a longer hold.
- Travis County population projected at +60% by 2050 — long-run rental-demand tailwind backs the buy-and-hold thesis.
Negotiation context
- It's been on market 68 days — a 6% lower offer ($113k) is reasonable based on typical stale-listing flexibility.
Risks & watch-outs
- Watch-outs: property tax is 2.6% of price.
- Climate carrying-cost: severe wind risk, 80% chance of damaging wind over 30y; moderate wildfire risk; extreme-heat days projected 7→25/yr by 2055 (HVAC capex compounding) — expect insurance premiums to compound above CPI over the hold.
Questions for the listing agent
- It's been on market 68 days. Have you received any prior offers? Is the seller open to a 6% concession, seller financing, or rate buy-down credit?
- Property tax is high relative to price — has the assessment been appealed recently, and will the sale trigger a re-assessment?
- Why hasn't it sold? Are there any deal-killer items the seller is aware of (foundation, flood, title, zoning, code violations)?
- Is there a deadline driving the sale (1031 exchange, divorce, estate, relocation)? That informs how much negotiation room exists.
- Crime grade is F in this area — have there been break-ins, vandalism, or insurance claims at this property in the last 3 years? What carrier currently insures it and at what premium?
- The area grade is low — what's the realistic commute time and amenity access for the typical tenant pool here? Any planned neighborhood developments (good or bad) we should know about?
- What's the average days-on-market for RENTAL listings here right now (not sales)? A rising rental-DOM trend means longer vacancies and softer asking-rent achievability than the comps imply.
- What's the recent tenant-quality profile in this submarket — average credit score on applications, eviction rate, late-payment / NSF rate, and stable-employment percentage? A property-management company in the area should have these aggregated.
- How much new for-sale + rental construction is in the pipeline within 1–3 miles? Heavy new supply typically softens prices + rents 12–24 months out; constrained supply supports both.
Investment metrics
- 1% rule
- 0.97% ✗
- Cap rate
- 7.23%
- Cash-on-cash
- 3.35%
- DSCR
- 1.15
- GRM
- 8.6
CMA / ARV
- ARV (median comp)
- $205,435
- List price
- $119,995
- Delta
- -41.59%
- Verdict
- UNDERPRICED
- Comps
- 2 within 2.0 mi
Projected returns pro-forma
-3.0% appreciation · 0.26% rent growth · sell at horizon
- IRR
- -14.2%
- Equity multiple
- 0.51×
- Total profit
- $-28,409
- Equity at exit
- $30,631
- IRR
- -10.6%
- Equity multiple
- 0.44×
- Total profit
- $-32,308
- Equity at exit
- $17,762
Cash invested: $57,522 (down + closing). Projections, not guarantees.
Landlord ↔ Tenant lean methodology
- Overall (STATE)
- 87 Strongly Landlord-Friendly
- State Texas
- 87 Strongly Landlord-Friendly · R+5
- County
- — inherits STATE
- City
- — inherits STATE
ZIP-level market 78724
- Home prices YoY
- -13.1%
- Rents YoY
- 0.3%
- Active inventory
- 176
- Price-to-rent
- 5.0×
Monthly cashflow live
- Estimated rent
- $2,000 high interval (Pro) →
- Mortgage (P&I)
- −$1,077
- Tax est. 1.5%
- −$257 /mo · $3,082/yr
- Insurance
- −$86
- HOA
- −$0
- Vacancy / Maint / Mgmt
- −$420
- Net cashflow
- $160
Break-even live
UW: 25.0% down · 7.5% · 30yr · 1.5% tax · 5.0% vac · 8.0% maint · 8.0% mgmt
Financing live
Cash to close
- Down payment
- $51,359
- Closing costs
- $6,163
- Reserves months
- —
- Total cash needed
- —
Loan-product check · same deal, 3 products live
Conventional
25% down · 7.5% · 30yr
- Down + closing
- —
- Monthly P&I
- —
- Monthly cashflow
- —
- DSCR
- —
- Eligible?
- —
Personal DTI + credit; lowest rate.
DSCR
20% down · 8.5% · 30yr
- Down + closing
- —
- Monthly P&I
- —
- Monthly cashflow
- —
- DSCR
- —
- Eligible?
- —
No personal income docs; deal must DSCR.
Hard money
10% down · 12.0% · 12mo
- Down + closing
- —
- Monthly P&I
- —
- Monthly cashflow
- —
- DSCR
- —
- Eligible?
- —
Short-term bridge; refi at stabilization.
Rent comps 32 comps
| Address | Beds | Baths | Sqft | Rent | $/sqft | DOM | Units | Dist |
|---|---|---|---|---|---|---|---|---|
| 6109 Decker Ln Austin, TX | 2.0 | 2.0 | 1277 | $2,059 | $1.61 | 20d | 1 | 0.15mi |
| 6109 Decker Ln Austin, TX | 3.0 | 2.0 | 1513 | $2,275 | $1.50 | 16d | 1 | 0.15mi |
| 8310 Canoga Ave Austin, TX | 2.0 | 2.0 | 1167 | $1,450 | $1.24 | 43d | 1 | 0.16mi |
| 6107 Decker Ln Austin, TX | 1.0–3.0 | 1.0–2.0 | 991 | $2,785 | $2.81 | 1d | 62 | 0.20mi |
| 6506 Decker Ln Austin, TX | 2.0 | 2.0 | 1164 | $1,599 | $1.37 | 43d | 1 | 0.33mi |
| 8701 Decker Lake Rd Austin, TX | 1.0–2.0 | 1.0–2.0 | 935 | $1,887 | $2.02 | 1d | 142 | 0.39mi |
| 8703 Decker Lake Rd Austin, TX | 2.0 | 2.0 | 1241 | $1,747 | $1.41 | 20d | 1 | 0.42mi |
| 8101 Loyola Ln Austin, TX | 1.0–3.0 | 1.0–3.5 | 1333 | $3,049 | $2.29 | 2d | 99 | 0.48mi |
| 8305 Garcreek Cir Unit A&C Austin, TX | 3.0 | 2.5 | 1100 | $1,399 | $1.27 | 43d | 1 | 0.55mi |
| 8401 Garcreek Cir Austin, TX | 3.0 | 2.0 | 1200 | $1,850 | $1.54 | 3d | 1 | 0.57mi |
| 9212 China Rose Dr Austin, TX | 3.0 | 2.0 | 1429 | $1,800 | $1.26 | 43d | 1 | 0.58mi |
| 9351 Decker Lake Rd Austin, TX | 1.0–4.0 | 1.0–2.0 | 1002 | $1,732 | $1.73 | 1d | 12 | 0.59mi |
| 5813 Knoll Pines Pass Austin, TX | 3.0 | 2.0 | 1516 | $1,750 | $1.15 | 4d | 1 | 0.62mi |
| 5301 Decker Ln Austin, TX | 1.0–2.0 | 1.0–2.0 | 1025 | $1,752 | $1.71 | 1d | 15 | 0.63mi |
| 9025 Sun Shower Bnd Austin, TX | 3.0 | 2.0 | 1704 | $2,200 | $1.29 | 23d | 1 | 0.65mi |
| 8401 Colony Loop Dr Unit D Austin, TX | 2.0 | 1.5 | 1020 | $1,100 | $1.08 | 23d | 1 | 0.68mi |
| 5717 Levenwood Ln Austin, TX | 3.0 | 2.0 | 1510 | $1,895 | $1.25 | 17d | 1 | 0.69mi |
| 5517 Agatha Cir Austin, TX | 3.0 | 2.5 | 1627 | $2,850 | $1.75 | 4d | 1 | 0.83mi |
| 7000 Decker Ln Austin, TX | 1.0–4.0 | 1.0–2.0 | 955 | $1,626 | $1.70 | 3d | 19 | 0.83mi |
| 5928 Signal Pt Austin, TX | 4.0 | 2.0 | 1500 | $1,800 | $1.20 | 44d | 1 | 0.85mi |
| 5724 Signal Pt Austin, TX | 3.0 | 2.0 | 1320 | $1,725 | $1.31 | 43d | 1 | 0.86mi |
| 6308 Perlita Dr Austin, TX | 3.0 | 2.5 | 1438 | $1,895 | $1.32 | 43d | 1 | 0.86mi |
| 5929 Alsace Trl Austin, TX | 3.0 | 2.0 | 1320 | $1,950 | $1.48 | 23d | 1 | 0.91mi |
| 6902 Colony Park Dr Austin, TX | 4.0 | 1.5 | 1500 | $2,250 | $1.50 | 23d | 1 | 1.27mi |
| 8340 Mimi Ln Austin, TX | 3.0 | 2.5 | 1811 | $2,700 | $1.49 | 4d | 1 | 1.29mi |
| 8025 City Top Blvd Austin, TX | 3.0 | 2.0 | 1472 | $2,300 | $1.56 | 23d | 1 | 1.34mi |
| 7106 Colony Park Dr Austin, TX | 3.0 | 2.0 | 1039 | $2,150 | $2.07 | 4d | 1 | 1.36mi |
| 7717 Lowenfield Dr Austin, TX | 3.0 | 2.0 | 1516 | $2,270 | $1.50 | 23d | 1 | 1.37mi |
| 7120 Carwill Dr Austin, TX | 3.0 | 2.0 | 1500 | $2,000 | $1.33 | 14d | 1 | 1.38mi |
| 7512 Daves Landing Dr Austin, TX | 3.0 | 2.0 | 1366 | $2,200 | $1.61 | 23d | 1 | 1.43mi |
| 6809 Jaired Dr Austin, TX | 3.0 | 2.0 | 1162 | $1,900 | $1.64 | 43d | 1 | 1.43mi |
| 7320 Muffin Dr Austin, TX | 3.0 | 2.0 | 1499 | $2,045 | $1.36 | 14d | 1 | 1.49mi |
Listing history 14 events
-
2026-06-18days on market $119,995 Active 68 DOM
-
2026-06-17days on market $119,995 Active 67 DOM
-
2026-06-16days on market $119,995 Active 66 DOM
-
2026-06-15days on market $119,995 Active 65 DOM
-
2026-06-13days on market $119,995 Active 63 DOM
-
2026-06-09days on market $119,995 Active 59 DOM
-
2026-06-08days on market $119,995 Active 58 DOM
-
2026-06-07days on market $119,995 Active 57 DOM
-
2026-06-05days on market $119,995 Active 54 DOM
-
2026-06-03days on market $119,995 Active 53 DOM
-
2026-06-02days on market $119,995 Active 52 DOM
-
2026-06-01days on market $119,995 Active 51 DOM
-
2026-05-31days on market $119,995 Active 50 DOM
-
2026-04-11$119,995 Active 819-char remark
Show marketing remark (819 chars)
The Renegade blends style, comfort, and efficiency in a thoughtfully designed manufactured home. With an open floor plan that feels expansive, it's perfect for both lively gatherings and quiet evenings. The luxurious master suite offers a private retreat, while the split-bedroom layout ensures space and privacy for the whole family. A chef-inspired kitchen with a countertop bar island makes cooking, meals, and conversations effortless. Daily living is simplified with an easy-access bathroom and nearby washer/dryer space. Built with Clayton's eBuilt™ system, this home includes 25+ eco-friendly features, combining energy savings with modern comfort. Key Features: Open floor plan Master suite retreat Split-bedroom design Countertop bar island Washer/dryer space 25+ eco-friendly features with eBuilt™
ⓘ Source: listings_history table (triggers on properties + properties_extension) + one-shot
backfill from property_details.listing_events for pre-trigger history.
Climate risk First Street
- Flood 1/10 Low FEMA zone X (unshaded) · 0% chance over 30 yrs
- Wildfire 5/10 Major
- Heat 8/10 Severe 7 d/yr ≥108°F today · 25 d/yr by 30 yrs out
- Wind 8/10 Severe 80% chance of damaging wind over 30 yrs
- Air quality 2/10 Low 0 unhealthy d/yr today · 1 by 30 yrs out
Nearby sold comps map
Loading sold comps map…
Walkable amenities ~0.75 mi
Loading nearby amenities…
Taxation est. · year 1
- Rental income
- $24,002
- − Mortgage interest
- −$11,508
- − Property taxes
- −$3,082
- − Insurance
- −$1,027
- − Repairs & maintenance
- −$1,920
- − Management
- −$1,920
- − Depreciation
- −$5,976
- Taxable loss
- −$1,431
- Est. tax savings @ 24.0%
- +$343
- After-tax cash flow
- $2,269/yr
For passive investors: Depreciation is non-cash, so a rental often shows a tax loss while cash-flowing — sheltering income. Rental losses are passive: they offset passive income freely, and up to $25,000/yr can offset ordinary (W-2) income if you actively participate and your MAGI is under $100k (phasing out to $0 by $150k); unused losses carry forward. On sale, claimed depreciation is recaptured at up to 25%, and gains may owe capital-gains tax (a 1031 exchange can defer both). Figures are a year-1 estimate at your 24.0% rate — not tax advice; consult a CPA.
Condition & rehab AI · 1 photo
The Renegade manufactured home is in excellent condition with no visible repairs needed. It offers a good return on investment with updates focusing on curb appeal and interior aesthetics.
Value-add opportunities
- Both Painting exterior and interior — Enhances curb appeal and interior aesthetics
- Both Landscaping improvements — Enhances curb appeal and adds value
- Both Kitchen appliances — Modernizes the kitchen and improves functionality
- Both Bathroom fixtures — Modernizes the bathroom and improves functionality
Renovation cost estimate screening
Value-add ROI direction
- Both Painting exterior and interior — Enhances curb appeal and interior aesthetics ↑
- Both Landscaping improvements — Enhances curb appeal and adds value ↑
- Both Kitchen appliances — Modernizes the kitchen and improves functionality ↑
- Both Bathroom fixtures — Modernizes the bathroom and improves functionality ↑
ⓘ Cost ranges are severity-bucket heuristics (US national rule-of-thumb). Get contractor quotes + a written scope before underwriting a rehab budget.
Schools (NCES district)
- District
- Manor ISD
- NCES district ID
- 4828890
- Math proficiency
- 18% ▼ -19.00%
- Reading proficiency
- 26% ▼ -10.00%
- Median HH income
- $56,255
- Composite
- 20.14/100
- National rank
- #8641
- State rank
- #729 of 826 in TX
Livability — Austin
- Score
- 82/100
- State rank
- #16
- US rank
- #1208
Category grades
Schools grade is shown separately in the Schools card above.
Census & demographics
- County
- Travis County · 1,299,254 people
- City population
- 1,066,854
- Metro
- Austin-Round Rock-Georgetown, TX
- Population (ZIP)
- 31,103
- Household income
- $77,926
- Rent vs Own
- Severe rent burden
- 873.0
Population outlook (Travis County) Hauer SSP2
- Today (2025)
- 1,545,133 people
- By 2030
- 1,729,269 · +11.9%
- By 2040
- 2,097,596 · +35.8%
- By 2050
- 2,463,890 · +59.5%
- By 2075
- 3,249,374 · +110.3%
- By 2100
- 3,801,868 · +146.1%
Race, ethnicity, and origin ACS 2023
- Neighborhood character
- Diverse neighborhood (Simpson 0.56)
- Race & ethnicity
- Hispanic / Latino 63% Two or more races 30% Black 15% White 15% Asian 3%
- Hispanic origin (detail)
- Mexican 54% Puerto Rican 2% Cuban 1%
- Common ancestry
- Slovak 2% Lithuanian 1%
- Foreign-born
- 23% · Canada, Jamaica, China
- Languages at home
- 48% English-only · Spanish 48% Other Asian/Pacific 1% Other Indo-European 1%
Political lean MEDSL · Travis
- 2024 margin
- Solid D (+39.3) · D 68.8% · R 29.4% · Other 1.8%
- 2008→2024 swing
- +9.9pp toward D · 2008: 29.4pp · 2024: 39.3pp
- All cycles
- 2024: D+39.3 2020: D+45.0 2016: D+38.9 2012: D+23.9 2008: D+29.4
Not yet ingested
- Civics
- —
Market trends
- HPI YoY
- ▼ -42.92%
- Current HPI
- 284.1007
- Rent YoY
- ▲ 0.26%
- Metro
- Austin-Round Rock-Georgetown, TX
- State GDP YoY
- ▲ 3.95%
- F500 in state
- 110
Industry mix (Fortune 500 HQ in TX)
| Industry | F500 HQs | Revenue |
|---|---|---|
| Energy | 16 | $1,198B |
|
||
| Technology | 5 | $198B |
|
||
| Engineering / Construction | 4 | $72B |
|
||
| Energy Services | 3 | $60B |
|
||
| Utilities | 3 | $41B |
|
||
| Healthcare | 2 | $330B |
|
||
Price history
1 event — show timeline
- 2026-04-11 Listed $119,995 Zillow
Cash-flow waterfall
monthlySold comps — $/sqft
last 12 mo · ≤1 miLoading sold comps…