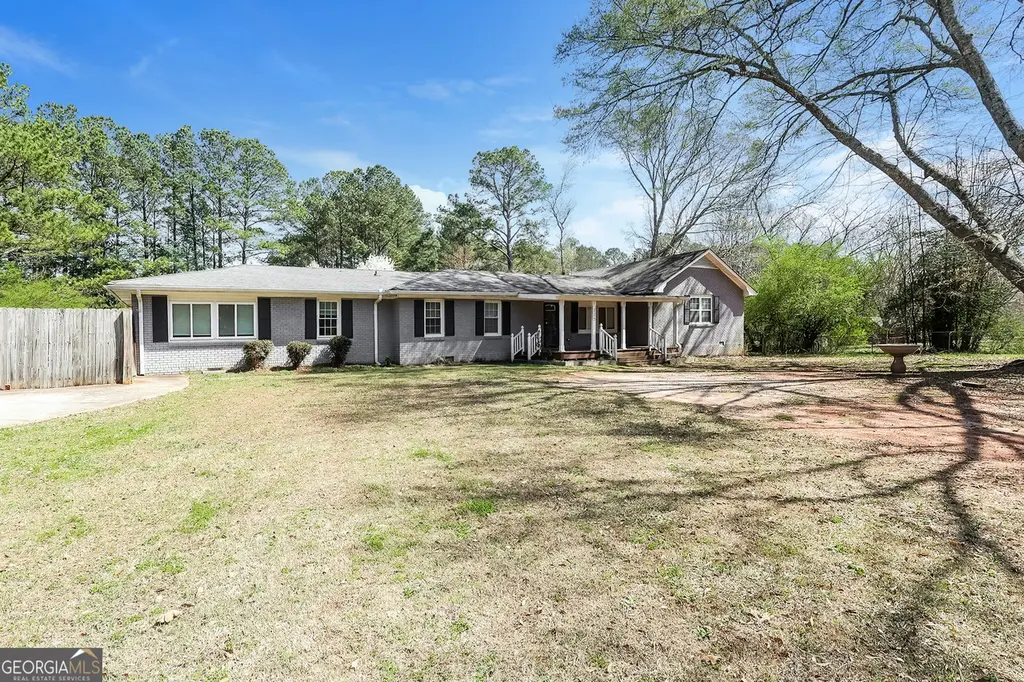
325 Longview Rd · Fayetteville, GA
Flood risk 1/10 · Minimal
- FEMA flood zone
- X (unshaded)
- Chance of flooding over 30 yrs
- 0.0%
- Est. flood insurance / yr
- $507 – $1,088
Fire risk 3/10 · Minor
- Est. fire insurance / yr
- $963 – $1,789
Heat risk 6/10 · Moderate
- Hot days now (above 105°F)
- 7 days/yr
- Hot days in 30 yrs
- 18 days/yr
Wind risk 6/10 · Moderate
- Chance of severe wind over 30 yrs
- 27.0%
Air-quality risk 4/10 · Minor
- Unhealthy air days now
- 3 days/yr
- Unhealthy air days in 30 yrs
- 5 days/yr
Risk factors via First Street. Map © Google.
Why this score? — see what drove the D grade
The composite is a weighted blend of 9 inputs, each scored 0–100. Each bar is that input's sub-score; the figure is the points it added to the 100-point composite (weight × sub-score).
- Cash flow +13.0/30.0
- ARV discount +7.3/15.0
- Schools +5.1/10.0
- DSCR +3.9/10.0
- Rent growth +3.6/5.0
- Livability +3.6/5.0
- 1% rule +3.0/10.0
- Condition / age +2.5/5.0
- Appreciation +0.0/10.0
$397,234
🖨 Deal sheet (PDF) 📄 Offer letter ✓ Due diligence
Listing remarks MLS
***SELLER IS NOT ACCEPTING OFFERS /NO SHOWINGS!***
Key facts
- Near starr's mill
- Finished sunroom
- Detached garage
Tags
Neighborhood map
What this means for you Summary
Snapshot
- This is a 4-bed/1.0-bath single-family listed at $397k.
Deal economics
- At list price, monthly cash flow is $-22 ($-267/yr) — negative.
- To cash-flow at today's rent, offer at most $393k (1.0% below list).
- To meet the 1% rule (rent ≥ 1% of price), the offer needs to be $318k (19.9% below list).
- Recommended offer: $318k (19.9% below list) — sets the bar for 1% rule.
- Cap rate 6.2% vs local median 4.3% in Fayetteville — top-decile yield for the area; either an underpriced asset or a hidden risk that comps aren't pricing in. Stress-test before assuming the spread holds.
Location & tenants
- Location reads 71/100 on livability (#86 in GA) — a middle-class / working-renter tenant base. Strengths: housing A+, health & safety B+, employment B; Watch: amenities F, commute F.
- Fayette County (suburban): math 52% / reading 60% proficiency, ranked #7 of 174 in GA (top 4%) — acceptable for families but not a draw, mixed tenant base, ~2y average lease.
- Zoned schools: North Fayette Elementary School (math 31% / reading 39%, grade F, #523 of 1,228 statewide, top 43%, 603 students, 62% FRL); Bennett'S Mill Middle School (math 24% / reading 51%, grade F, #162 of 470 statewide, top 35%, 891 students, 53% FRL); Fayette County High School (math 15% / reading 42%, grade F, #149 of 424 statewide, top 35%, 1,368 students, 46% FRL) — zoned schools average 54% FRL vs 21% district-wide (33 pts higher); higher-poverty schools than district average — tighter screening recommended.
- Zoned-school proficiency averages 34% at this address vs 56% district-wide (-22 pts) — the specific schools serving this property underperform the Fayette County average; the district grade overstates school quality for this exact location.
- Market conditions: Rents rising fast (+4.3%/yr); 378 active listings in the ZIP; 10 comparable units currently listed for rent nearby; rentals leasing fast (median 7d on market — plan ~1-2 weeks tenant-placement turnaround); solid renter incomes; 323 units permitted in Fayette County in 2024 (0 in 5+ unit buildings).
- This rent runs 42% of the median local income ($90k/yr) — at the standard rent-burdened threshold; future hikes will face affordability resistance.
Forward outlook
- Local home prices are declining (-3.0%/yr); year-one equity from $3k of loan paydown is wiped out by about $12k of value loss. Plan a longer hold.
- Fayette County population projected at +13% by 2050 — modest demand growth; plan on rents tracking national, not racing it.
Negotiation context
- It's been on market 59 days — a 3% lower offer ($385k) is reasonable based on typical stale-listing flexibility.
- 8 sale attempts since 11y ago; this cycle's ask is 13% above the opening price — seller raised mid-cycle; expect resistance to lowballs.
Risks & watch-outs
- Watch-outs: built in 1955 — expect roof / HVAC / electrical / plumbing capex.
- Climate carrying-cost: major wind risk, 27% chance of damaging wind over 30y; extreme-heat days projected 7→18/yr by 2055 (HVAC capex compounding) — expect insurance premiums to compound above CPI over the hold.
Questions for the listing agent
- What do current leases actually rent for vs. the listed asking? Can we see a recent rent roll and the last 12 months of T-12 income?
- It's been on market 59 days. Have you received any prior offers? Is the seller open to a 20% concession, seller financing, or rate buy-down credit?
- Built in 1955 — when were the roof, HVAC, electrical panel, plumbing, and water heater last replaced?
- Is there a deadline driving the sale (1031 exchange, divorce, estate, relocation)? That informs how much negotiation room exists.
- Schools are B-rated — typically a magnet for longer-tenancy family renters. What's the average tenant stay here, and is there a school-zone premium baked into asking?
- The area grade is low — what's the realistic commute time and amenity access for the typical tenant pool here? Any planned neighborhood developments (good or bad) we should know about?
- What's the average days-on-market for RENTAL listings here right now (not sales)? A rising rental-DOM trend means longer vacancies and softer asking-rent achievability than the comps imply.
- What's the recent tenant-quality profile in this submarket — average credit score on applications, eviction rate, late-payment / NSF rate, and stable-employment percentage? A property-management company in the area should have these aggregated.
- How much new for-sale + rental construction is in the pipeline within 1–3 miles? Heavy new supply typically softens prices + rents 12–24 months out; constrained supply supports both.
Investment metrics
- 1% rule
- 0.80% ✗
- Cap rate
- 6.23%
- Cash-on-cash
- -0.24%
- DSCR
- 0.99
- GRM
- 10.4
CMA / ARV
- ARV (median comp)
- $395,914
- List price
- $397,234
- Delta
- 0.33%
- Verdict
- FAIR
- Comps
- 20 within 1.0 mi
Show comp detail 4 sales within ~0.75 mi
| Address | Dist | Beds/Ba | Sqft | Sold | Price | $/sf | Match |
|---|---|---|---|---|---|---|---|
| 720 Highway 314 | 0.47mi | 3/3.0 (-1) | 2,220 (-8%) | 16mo | $285,000 | $128 | 37 |
| 474 Kenwood Rd | 0.72mi | 3/2.5 (-1) | 2,335 (-4%) | 20mo | $415,000 | $178 | 32 |
| 100 Longwood Dr | 0.55mi | 4/3.0 | 2,787 (+15%) | 13mo | $611,990 | $220 | 30 |
| 100 Byington Dr | 0.69mi | 4/2.5 | 2,762 (+14%) | 23mo | $380,000 | $138 | 19 |
Match score weights: distance 35% · size 25% · config 20% · recency 20%. Top-matched comps best support the ARV.
Projected returns pro-forma
-3.0% appreciation · 4.29% rent growth · sell at horizon
- IRR
- -15.4%
- Equity multiple
- 0.45×
- Total profit
- $-61,687
- Equity at exit
- $59,229
- IRR
- -5.0%
- Equity multiple
- 0.66×
- Total profit
- $-38,258
- Equity at exit
- $34,346
Cash invested: $111,226 (down + closing). Projections, not guarantees.
Landlord ↔ Tenant lean methodology
- Overall (STATE)
- 90 Strongly Landlord-Friendly
- State Georgia
- 90 Strongly Landlord-Friendly · R+3
- County
- — inherits STATE
- City
- — inherits STATE
ZIP-level market 30214
- Rents YoY
- 4.3%
- Active inventory
- 378
- Price-to-rent
- 10.4×
Monthly cashflow live
- Estimated rent
- $3,180 high interval (Pro) →
- Mortgage (P&I)
- −$2,083
- Tax from tax record
- −$286 /mo · $3,434/yr
- Insurance
- −$166
- HOA
- −$0
- Vacancy / Maint / Mgmt
- −$668
- Net cashflow
- $-22
Break-even live
Sensitivity live
| Price | -10% $203 | -5% $90 | +0% $-22 | +5% $-135 | +10% $-247 |
|---|---|---|---|---|---|
| Rent | -10% $-274 | -5% $-148 | +0% $-22 | +5% $103 | +10% $229 |
| Rate | -1.0pp $178 | -0.5pp $79 | base $-22 | +0.5pp $-125 | +1.0pp $-230 |
UW: 25.0% down · 7.5% · 30yr · 1.5% tax · 5.0% vac · 8.0% maint · 8.0% mgmt
Financing live
Cash to close
- Down payment
- $99,308
- Closing costs
- $11,917
- Reserves months
- —
- Total cash needed
- —
Loan-product check · same deal, 3 products live
Conventional
25% down · 7.5% · 30yr
- Down + closing
- —
- Monthly P&I
- —
- Monthly cashflow
- —
- DSCR
- —
- Eligible?
- —
Personal DTI + credit; lowest rate.
DSCR
20% down · 8.5% · 30yr
- Down + closing
- —
- Monthly P&I
- —
- Monthly cashflow
- —
- DSCR
- —
- Eligible?
- —
No personal income docs; deal must DSCR.
Hard money
10% down · 12.0% · 12mo
- Down + closing
- —
- Monthly P&I
- —
- Monthly cashflow
- —
- DSCR
- —
- Eligible?
- —
Short-term bridge; refi at stabilization.
Rent comps 10 comps
| Address | Beds | Baths | Sqft | Rent | $/sqft | DOM | Units | Dist |
|---|---|---|---|---|---|---|---|---|
| 325 Longview Rd Fayetteville, GA | 4.0 | 3.5 | 2864 | $3,270 | $1.14 | 0d | 1 | 0.02mi |
| 155 Byington Dr Fayetteville, GA | 4.0 | 3.0 | 2662 | $2,935 | $1.10 | 17d | 1 | 0.80mi |
| 558 Kenwood Rd Fayetteville, GA | 3.0 | 2.5 | 2254 | $4,290 | $1.90 | 14d | 1 | 1.02mi |
| 100 Creekwood Ct Fayetteville, GA | 4.0 | 3.0 | 2754 | $2,739 | $0.99 | 7d | 1 | 1.04mi |
| 110 Wilmington Ln Fayetteville, GA | 4.0 | 2.5 | 2309 | $2,295 | $0.99 | 7d | 1 | 1.24mi |
| 255 Squire Ln Fayetteville, GA | 5.0 | 4.0 | 2659 | $2,900 | $1.09 | 45d | 1 | 1.28mi |
| 130 Wilmington Ln Fayetteville, GA | 3.0 | 2.0 | 2244 | $2,230 | $0.99 | 26d | 1 | 1.32mi |
| 230 New Oak Ridge Trl Fayetteville, GA | 3.0 | 3.0 | 2425 | $2,250 | $0.93 | 4d | 1 | 1.34mi |
| 165 N Fayette Dr Fayetteville, GA | 4.0 | 2.5 | 2192 | $7,500 | $3.42 | 6d | 1 | 1.43mi |
| 245 Bentley Way Fayetteville, GA | 4.0 | 2.5 | 1740 | $2,449 | $1.41 | 4d | 1 | 1.49mi |
Listing history 39 events
-
2026-06-04days on market $397,234 Active 59 DOM
-
2026-06-03days on market $397,234 Active 58 DOM
-
2026-06-02days on market $397,234 Active 57 DOM
-
2026-06-01days on market $397,234 Active 56 DOM
-
2026-05-31days on market $397,234 Active 55 DOM
-
2026-05-19status Active 50-char remark
Show marketing remark (50 chars)
***SELLER IS NOT ACCEPTING OFFERS /NO SHOWINGS!***
-
2026-04-22status Active 50-char remark
Show marketing remark (48 chars)
***SELLER IS NOT ACCEPTING OFFERS / NO SHOWINGS!
-
2026-04-22price $397,234 48-char remark
Show marketing remark (48 chars)
***SELLER IS NOT ACCEPTING OFFERS / NO SHOWINGS!
-
2026-04-10price $397,234 50-char remark
Show marketing remark (50 chars)
***SELLER IS NOT ACCEPTING OFFERS /NO SHOWINGS!***
-
2026-03-19$350,000 Active 50-char remark
Show marketing remark (48 chars)
***SELLER IS NOT ACCEPTING OFFERS / NO SHOWINGS!
-
2026-03-19$350,000 New 48-char remark
Show marketing remark (48 chars)
***SELLER IS NOT ACCEPTING OFFERS / NO SHOWINGS!
-
2022-09-13soldstatus $350,000
-
2022-09-12soldstatus $350,000 Sold
-
2022-09-12soldstatus $350,000 Closed
-
2022-09-10status Under Contract
-
2022-08-22historical Active Under Contract
-
2022-08-22historical Active Under Contract
-
2022-08-04price $389,000
-
2022-08-04price $389,000
-
2022-07-25price $398,500
-
2022-07-25price $398,500
-
2022-07-08$412,000 New
-
2022-07-08$412,000 Active
-
2015-11-28price $192,000
-
2015-11-18soldstatus $192,000
-
2015-11-12soldstatus $192,000 Sold
-
2015-10-21status Under Contract
-
2015-09-28historical Pending Approval
-
2015-09-21price $195,000
-
2015-08-18price $195,000
-
2015-08-18price $183,000
-
2015-07-25price $185,000
-
2015-07-23status Back On Market
-
2015-07-19status Under Contract
-
2015-07-16historical Pending Approval
-
2015-07-01$195,000 New
-
2008-12-09soldstatus $195,000
-
2007-03-16soldstatus $90,000
-
1999-12-29soldstatus $115,000
ⓘ Source: listings_history table (triggers on properties + properties_extension) + one-shot
backfill from property_details.listing_events for pre-trigger history.
Tax reassessment forecast GA · Resets to sale price
- Current annual tax
- $3,434 · $286/mo
- Projected year-2 tax
- $3,655 · $305/mo
- Expected delta
- +$220/yr (+$18/mo · 6.4%)
ⓘ Screening estimate from a state-policy table — verify with the county assessor before closing.
Climate risk First Street
- Flood 1/10 Low FEMA zone X (unshaded) · 0% chance over 30 yrs
- Wildfire 3/10 Moderate
- Heat 6/10 Major 7 d/yr ≥105°F today · 18 d/yr by 30 yrs out
- Wind 6/10 Major 27% chance of damaging wind over 30 yrs
- Air quality 4/10 Moderate 3 unhealthy d/yr today · 5 by 30 yrs out
Nearby sold comps map
Loading sold comps map…
Walkable amenities ~0.75 mi
Loading nearby amenities…
Taxation est. · year 1
- Rental income
- $38,166
- − Mortgage interest
- −$22,251
- − Property taxes
- −$3,434
- − Insurance
- −$1,986
- − Repairs & maintenance
- −$3,053
- − Management
- −$3,053
- − Depreciation
- −$11,556
- Taxable loss
- −$7,168
- Est. tax savings @ 24.0%
- +$1,720
- After-tax cash flow
- $1,453/yr
For passive investors: Depreciation is non-cash, so a rental often shows a tax loss while cash-flowing — sheltering income. Rental losses are passive: they offset passive income freely, and up to $25,000/yr can offset ordinary (W-2) income if you actively participate and your MAGI is under $100k (phasing out to $0 by $150k); unused losses carry forward. On sale, claimed depreciation is recaptured at up to 25%, and gains may owe capital-gains tax (a 1031 exchange can defer both). Figures are a year-1 estimate at your 24.0% rate — not tax advice; consult a CPA.
Schools (NCES district)
- District
- Fayette County
- NCES district ID
- 1302130
- Math proficiency
- 52% ▼ -12.00%
- Reading proficiency
- 60% ▼ -7.00%
- Median HH income
- $80,746
- Composite
- 50.67/100
- National rank
- #1824
- State rank
- #7 of 174 in GA
Livability — Fayetteville
- Score
- 71/100
- State rank
- #86
- US rank
- #7167
Category grades
Schools grade is shown separately in the Schools card above.
Census & demographics
- County
- Fayette County · 112,821 people
- City population
- 72,287
- Metro
- Atlanta-Sandy Springs-Alpharetta, GA
- Population (ZIP)
- 31,811
- Household income
- $89,912
- Rent vs Own
- Severe rent burden
- 634.0
Population outlook (Fayette County) Hauer SSP2
- Today (2025)
- 120,914 people
- By 2030
- 125,439 · +3.7%
- By 2040
- 132,378 · +9.5%
- By 2050
- 137,123 · +13.4%
- By 2075
- 156,091 · +29.1%
- By 2100
- 163,102 · +34.9%
Race, ethnicity, and origin ACS 2023
- Neighborhood character
- Diverse neighborhood (Simpson 0.62)
- Race & ethnicity
- Black 51% White 33% Hispanic / Latino 9% Two or more races 5% Asian 3%
- Hispanic origin (detail)
- Mexican 6% Puerto Rican 1%
- Common ancestry
- Italian 2% Slovak 1% Serbian 1%
- Foreign-born
- 10% · Canada, Vietnam
- Languages at home
- 85% English-only · Spanish 8% Other Asian/Pacific 1% French/Haitian/Cajun 1%
Political lean MEDSL · Fayette
- 2024 margin
- Toss-up / Even · D 48.0% · R 51.1%
- 2008→2024 swing
- +27.5pp toward D · 2008: -30.7pp · 2024: -3.1pp
- All cycles
- 2024: R+3.1 2020: R+6.8 2016: R+19.5 2012: R+31.4 2008: R+30.7
Not yet ingested
- Civics
- —
Market trends
- HPI YoY
- ▼ -142.65%
- Current HPI
- 243.9416
- Rent YoY
- ▲ 4.29%
- Metro
- Atlanta-Sandy Springs-Alpharetta, GA
- State GDP YoY
- ▲ 2.66%
- F500 in state
- 28
Industry mix (Fortune 500 HQ in GA)
| Industry | F500 HQs | Revenue |
|---|---|---|
| Paper / Packaging | 2 | $29B |
|
||
| Retail | 1 | $160B |
|
||
| Transportation / Logistics | 1 | $91B |
|
||
| Airlines | 1 | $62B |
|
||
| Consumer Goods | 1 | $47B |
|
||
| Utilities | 1 | $25B |
|
||
Price history
+245.4% since first listed34 events — show timeline
- 2026-05-19 Relisted — FMLS
- 2026-04-22 Relisted — FMLS
- 2026-04-22 Price Changed $397,234 GAMLS
- 2026-04-10 Price Changed $397,234 FMLS
- 2026-03-19 Listed $350,000 GAMLS
- 2026-03-19 Listed $350,000 FMLS
- 2022-09-13 Sold (Public Records) $350,000 Public Records
- 2022-09-12 Sold (MLS) $350,000 FMLS
- 2022-09-12 Sold (MLS) $350,000 GAMLS
- 2022-09-10 Pending — GAMLS
- 2022-08-22 Contingent — FMLS
- 2022-08-22 Contingent — GAMLS
- 2022-08-04 Price Changed $389,000 FMLS
- 2022-08-04 Price Changed $389,000 GAMLS
- 2022-07-25 Price Changed $398,500 FMLS
- 2022-07-25 Price Changed $398,500 GAMLS
- 2022-07-08 Listed $412,000 FMLS
- 2022-07-08 Listed $412,000 GAMLS
- 2015-11-28 Price Changed $192,000 GAMLS
- 2015-11-18 Sold (Public Records) $192,000 Public Records
- 2015-11-12 Sold (MLS) $192,000 GAMLS
- 2015-10-21 Pending — GAMLS
- 2015-09-28 Contingent — GAMLS
- 2015-09-21 Price Changed $195,000 GAMLS
- 2015-08-18 Price Changed $183,000 GAMLS
- 2015-08-18 Price Changed $195,000 GAMLS
- 2015-07-25 Price Changed $185,000 GAMLS
- 2015-07-23 Relisted — GAMLS
- 2015-07-19 Pending — GAMLS
- 2015-07-16 Contingent — GAMLS
- 2015-07-01 Listed $195,000 GAMLS
- 2008-12-09 Sold (Public Records) $195,000 Public Records
- 2007-03-16 Sold (Public Records) $90,000 Public Records
- 1999-12-29 Sold (Public Records) $115,000 Public Records
Property tax history
+4.0%/yrLatest (2025): $3,434 · -0.9% YoY. Source: county tax records.
Cash-flow waterfall
monthlySold comps — $/sqft
last 12 mo · ≤1 miLoading sold comps…